www.mcp-journal.de
SAXS Investigation on Morphological Change in Lamellar
Structures During Propagation Steps of Graft-Type Polymer
Electrolyte Membranes for Fuel Cell Applications
Tran Duy Tap,* La Ly Nguyen, Yue Zhao, Shin Hasegawa, Shin-ichi Sawada,
Nguyen Quang Hung, Luu Anh Tuyen, and Yasunari Maekawa*
Dr. T. D. Tap, L. L. Nguyen
Faculty of Materials Science and Technology University of Science
Vietnam National University Ho Chi Minh City
227 Nguyen Van Cu, District 5, Ho Chi Minh City, Vietnam E-mail: [email protected]
L. L. Nguyen, Dr. L. A. Tuyen Center for Nuclear Techniques Vietnam Atomic Energy Institute
217 Nguyen Trai, District 1, Ho Chi Minh City, Vietnam L. L. Nguyen
Institute for Nanotechnology (INT)
Vietnam National University Ho Chi Minh City Community 6, Linh Trung Ward, Thu Duc District Ho Chi Minh City, Vietnam
DOI: 10.1002/macp.201900325
their advantages over other fuel cells in terms of the clean and efficient power generation and lower operating tempera-ture.[1] They are expected to reduce the
fossil fuel consumption, which is believed to be the primary sources causing the climate change. PEM, which consists of super acid groups (i.e., sulfonic acid), has been considered as one of the key com-ponents in achieving the high fuel cell performance because of its unique fuel cell properties such as ionic conductance, mechanical strength, and thermal and chemical stabilities. When a dry PEM is immersed in water, the hydrophilic chains with sulfonic ion groups can absorb water and consequently form the interconnected ion channels inside the hydrated regions. The macro and microphase separations, viz., crystalline morphologies, conducting layers (ion channels), characteristic domain sizes, and the connection and dis-tribution of the ionic groups and water in the conducting layers and around the crys-talline phases are believed to play an important role in the con-ductivity and mechanical integrity of the PEMs.[2–4] Currently,
the main challenges to improve the conductivity and mechan-ical strength of the PEMs are the lack of detailed information
The changes of the lamellar periods (L1D), thickness of lamellar crystals (Lc),
and amorphous layers (La) within the stacked lamellae of poly(styrenesulfonic
acid)-grafted poly(ethylene-co-tetrafluoroethylene) polymer electrolyte membranes (ETFE-PEMs), induced by the preparation and water-absorbing steps are investigated using the small-angle X-ray scattering method. The
L1D values of all the samples quickly increase at a grafting degree (GD) range
of less than 19% and then level off. The solvent-induced recrystallization is observed at the early stage of grafting (GD < 10%) and at successive sulfona-tion and hydrasulfona-tion steps. The L1D, La, and Lc of dry and hydrated PEMs show
similar values at higher GD ranges (>34%), leading to the conclusion that most water molecules in the PEMs with higher GDs exist at the outside of the lamellar stacks. Accordingly, for the PEMs with low GD (<19%), all the hydrophilic graft-polymers (ion-channels) locate in the lamellar stacks and are strongly restricted by lamellar crystalline layers, which suppress the swelling of the PEMs. The unique lamellar structures of ETFE-PEMs characterized by
La and Lc are well connected with the high conductance and mechanical
prop-erties of the membranes, and are suitable for fuel cell applications.
1. Introduction
Proton exchange membrane (PEM) fuel cells have attracted many interests in solving the environmental problems due to
Dr. Y. Zhao, Dr. S. Hasegawa, Dr. S.-i. Sawada, Dr. Y. Maekawa Department of Advanced Functional Materials Research Takasaki Advanced Radiation Research Institute Quantum Beam Science Research Directorate
National Institutes for Quantum and Radiological Science and Technology (QST)
1233 Watanuki, Takasaki, Gunma 370-1292, Japan E-mail: [email protected]
Dr. N. Q. Hung
Institute of Fundamental and Applied Sciences Duy Tan University
10C Tran Nhat Duat Street, District 1, Ho Chi Minh City, Vietnam Dr. L. A. Tuyen
Joint Institute for Nuclear Research 6 Joliot Curie, 141980 Dubna, Russia The ORCID identification number(s) for the author(s) of this article
on the simultaneous change of the macro and microstructures when the membranes are exposed to the change of the oper-ating conditions such as temperature and humidity. Therefore, in order to improve the performance of the PEM fuel cells, it is highly desirable to have a detailed understanding on their struc-tural changes under the above-mentioned operating conditions. Pre-irradiation grafting, in which polymer substrates are irra-diated using a quantum beam, immersing them into a monomer solution for graft polymerization, and then carrying out the sub-sequent sulfonation on the graft polymers, is a widely recognized technique to prepare the PEMs for the fuel cell.[5] This radiation
technique allows us to introduce various functional grafted poly-mers directly bonded to the main chains of polymer substrates, while the inherent characteristics of the polymer substrates such as thermal stability, mechanical strength, and crystallinity are still retained. Morphology of the graft-type PEMs prepared by the above radiation grafting technique has been inten-sively investigated using the small-angle scattering methods with various matrix polymers of poly(tetrafluoroethylene) (PTFE),[6,7] poly(ether ether ketone) (PEEK),[8,9] poly(vinylidene
fluoride) (PVDF),[10–15] and poly(ethylene-co-tetrafluoroethylene)
(ETFE).[15–22] Consequently, various general features have been
well-established as follows. The sulfonic acid–water clusters were observed to form in the amorphous polymer matrix of PEEK, PVDF, and ETFE. The matrix polymers (PTFE, PEEK, PVDF, ETFE) possessed the layered structures (lamellae) and the variation of these structures depended on the amount of grafted materials.[7–11,15,16,19–22] In addition, the crystalline
struc-tures and the hydrophilic phases generated by the introduction of the graft materials were found to play an important role in the mechanical integrity and conductivity of the membranes, respec-tively. Despite many efforts to investigate the multiscale organi-zation, the detailed characteristic parameters (size, shape, and the organization) of the crystalline structures and amorphous phases have not been fully elucidated so far.
In our recent studies,[23,24] the synthesis and
characteriza-tion of poly(styrenesulfonic acid) (PSSA)-grafted ETFE polymer electrolyte membranes (ETFE-PEMs) with a wide range of ion exchange capacity (IEC) at the dry and humidified conditions have been reported. The ETFE-PEMs showed less dependent proton conductivity on relative humidity (RH) and strong dependence of mechanical strength on the PEM crystallinities, respectively. The hierarchical structures of the membranes were then investigated by using the small- and ultrasmall-angle X-ray scattering (SAXS/USAXS) methods.[25] It was found that, for
the ETFE-PEMs with high IECs (>2.7 mmol g−1), a higher
con-ductivity at 30% RH and compatible tensile strength at 100% RH and 80 °C, in comparison with Nafion-212, were originated respectively from the well-interconnected ion channels around the grains and the remaining lamellar crystals and grains as well. However, precise lamellar structures such as lamellar crystalline and amorphous layers within stacked lamellae and the variation of these characteristic sizes during the change of grafting degree (GD) or IEC under the dry and immersed con-ditions have not been evaluated yet.
Accordingly, in the present study, we have conducted the detailed and systematic investigation on the lamellar struc-tures such as the periods of lamellar crystalline and amorphous layers (Lc and La) in the ETFE-PEMs as well as the precursor
original ETFE and styrene-grafted films (grafted-ETFE) by using SAXS. As a starting point to understand the structure-property relationship, the variation of characteristic sizes of Lc and La in
the ETFE-PEMs as a function of GD or IEC were investigated under the dry state and water saturation. On the basis of the results obtained from the small angle scattering methods, the structure-property interplay was then essentially evaluated.
2. Experimental Section
2.1. Determination of Lamellar Structures
Details on the materials were described in the authors’ previous studies.[23,24] The equipments and procedures for the SAXS
measurements were also described explicitly in the recent work.[25] In this study, to determine the characteristic sizes of
lamellar structures, the SAXS profiles were analyzed based on a combination of two functions, namely 1D correlation function,
γ1D(r),[26,27] and interface distribution function, g(r).[28,29] The 1D
correlation function is defined as
r 1 I q q qr dq
0 cos 1D 0 2
∫
γγ
( )
( )
( )
=( )
∞ (1)where I(q) is the scattering intensity and r is the direction along which the electron density is measured. The term γ(0) in Equation (1) is the so-called scattering invariant, which is often defined based on the invariant Q of the form as
Q I q q dq 2 v Wc 1 Wc 0
2 2
1 2
2
∫
( )
π(
ρ ρ)
(
)
=∞ ≡ − − (2)
where v is total volume of the interface between the two phases having densities ρ1 and ρ2 and Wc is volume fraction of the
phase. The function γ1D(r) represents the probability of finding
the electron density as a function of the distance r within the material starting from the origin or zero position which, in the present case, can be taken at the center of a single crys-talline lamellar because the crystallinity of the films is lower than 50%.[23–26] The characteristic size of lamellar period (L
1D)
obtained from γ1D(r) is shown in Figure 1. Based on the
sim-plified lamellar two-phase model, which consists of an infinite array of alternating crystalline lamellar thickness Lc and
amor-phous lamellar thickness La (Figure 1), one can calculate easily
the lamellar period L1D by using the following formula[26]
1D c a
L = +L L (3)
The interface distribution function, g(r), is defined as the second derivative of γ1D(r) with respect to r2[28,29]
g r r
r
I q q qr dq
Q cos 2 1D 2 4 0
∫
γ
( )
( )
(
)
( )
=∂( )
∂ = −
∞
(4)
be expressed in terms of the Fourier transform of the interfer-ence function G(q)[28,29]
cos
0
g r
( )
=∫
∞G q( ) ( )
qr dq (5)where G(q) is given as
p B 4
2 2
G q
( )
= −k I q( ) ( )
−I q q e q σ
(6)
with kp being the Porod’s constant, IB(q) being the background
intensity arising from the thermal density fluctuation and amorphous phase halo, and σ being a parameter related to the thickness of the interface between the two phases. The illus-tration of lamellar period Lg determined from g(r) is shown in
Figure 1.
Note that for a system with diffuse boundary thickness, a corresponding ideal two-phase system can be defined in which the diffuse boundary thickness is substituted by the sharp one.[15,26] In the present study, this modification is conducted
by replacing the diffuse boundary material with that of the lamellar, which contains the same number of electrons.[15,26]
Since the experimentally accessible q-range is finite, the extrapolation to both low and high-q regions is necessary for the integrations in Equations (1), (2), (4), and (5) to avoid the truncation errors. Within the present work, the extrapolation to zero q was performed by using the Debye–Bueche model[30]
1 2 2 2
I q A
a qc
(
)
( )
=+ (7)
where A is constant and ac is the inhomogeneity length, whose
values can be determined from the plot I(q)−1/2 versus q2 at the
low-q region. The extrapolation to large-q region was carried out by employing the Porod–Vonk 6 model, whose equation is written as[31]
exp 2 2
4 B
I q k q
q I q
p
(
σ)
( )
= − +( )
(8)where IB(q) = F + bq6 (Vonk 6) with a and b being the arbitrary
constants obtained via the fitting to the experimental SAXS data at the high-q region.[32]
3. Results and Discussion
3.1. Preparation and Properties of Grafted Films and Membranes
The general membrane preparation procedures and chemical structures of the PEMs are shown in Scheme 1. The mem-branes were prepared by the pre-irradiation grafting method, in which the pristine ETFE films were irradiated by using the 60Co
γ-rays and then immersed into a styrene solution to give the sty-rene grafted ETFE (grafted-ETFE).[23,24] The GD of the
grafted-ETFE can be controlled in the range from 4.2 to 117% by changing the styrene concentration and grafting time, as listed in Table S1, Supporting Information. The grafted-ETFE films were sulfonated to obtain the poly(styrenesulfonic acid) (PSSA)-grafted ETFE (ETFE-PEM) with an IEC range of 0.52–3.1 mmol g−1 (Table S1, Supporting Information). The water uptake (WU)
increased from 11% to 145% with the IECs increasing from 0.52 to 3.1 mmol g−1. The detailed procedures and
characteriza-tion methods can be found in our previous papers.[23–25]
3.2. Determination of Lamellar Structures from SAXS Profiles
Figure 2 presents the typical Porod’s plots (I(q) × q4 vs q) for the
grafted-ETFE films with GDs of 0–117% and the corresponding dry and hydrated ETFE-PEMs with IECs of 0–3.1 mmol g−1 using
the SAXS data reported in our previous paper.[25] The SAXS
pro-file of the original ETFE film is characterized by a maximum Figure 1. Illustration of the simplified lamellar two-phase model in the
graft-type ETFE films consisting of crystalline (Lc) and amorphous (La)
thickness with a sharp boundary layer. ρc and ρa are the electron densities
of crystalline and amorphous phases, respectively. In the present study,
L1D is defined as the average distance between the centers of two adjacent
lamellar crystals, whereas Lg is defined as the average distance of adjacent
interfaces between the crystalline lamellae and the amorphous layers.
peak around q = 0.272 nm−1, which corresponds to the
charac-teristic distance of 23.1 nm, originated from the lamellar struc-ture.[15,16,25] As previously reported, the grafted-ETFE films and
ETFE-PEMs with dry and hydrated states showed similar scat-tering peaks to those of the pristine ETFE film, indicating the generation of a new phase, consisted of the graft polymers under the influence of the lamellar structure in the pristine ETFE film.[19–22,25] It should be noted here that no higher-order
scattering peaks were observed via these SAXS profiles. This behavior leads to an assumption that the lamellar stacks may exhibit the ordered arrangements at the local scale but more random at the global one. Moreover, the extrapolation to the high-q regions using the Porod–Vonk 6 model (Equation (8)) is more probable due to the single scattering peak of the SAXS pro-files. In Figure 2, the I(q) × q4 plots are mostly independent of q
in the q-range of 0.7–1.0 nm−1, indicating the existence of the
locally flat surfaces and the sharp interfaces within the lamellar stacks. In other words, the microphase-separated structures within the stacked lamellae in the ETFE based matrix film were not altered significantly through the preparation procedures or with the increase in the amount of grafted materials. The posi-tive curvatures at the higher q-range in the I(q) × q4 versus q plots
are due to thermal scattering and amorphous phase halo.[32]
Figure 3a presents the SAXS profile of the dry ETFE-PEM
having an IEC of 1.3 mmol g−1 with the fitting curves using
the Porod–Vonk 6 and Debye–Bueche models for the high- and low-q regions, respectively. Since ETFE films are one-dimentionally oriented due to the extrusion drawing step in the Figure 2. The Porod’s plots of SAXS profiles of grafted-ETFE films with
GDs of 0–117% (a) and the corresponding dry (b) and hydrated ETFE-PEMs (c) within the same GD values, which are equivalent to the IECs in the range of 0–3.1 mmol g−1.
Figure 3. a) The SAXS profile of the dry ETFE-PEM with an IEC of 1.3 mmol g−1 (GD = 19%) and the fitting curves obtained by using the Porod–Vonk 6
film preparation, the 1D correlation function, γ1D(r), and
inter-face distribution function, g(r), were calculated by Equations (1) and (5) (see Section 2) using the SAXS data with the extrapola-tion to both low- and high-q regions and listed in Figure 3b,c, respectively. The lamellar period (L1D= 24.7 nm) and
crystal-line lamellar thickness (Lc= 6.5 nm) can be determined from
the positions of the first maximum and the crossing point between the baseline and the sloping line of the self-correlation triangle in the plot of γ1D(r) (Figure 3b), respectively.[26] Thus,
La= 18.2 nm can be easily obtained. Likewise, the value of Lg=
19.2 nm is determined from the minimum position of g(r) and presented in Figure 3c.[28,29]
Contrary to Porod’s law, which can be so far only one pos-sible model for the extrapolation to the high-q region as in the case of the simplified lamellar two-phase system, several pos-sible approaches such as Debye–Bueche,[30] Gaussian,[15,33] and
linear models[34,35] are often used to extrapolate to the low-q one
and extended to q = 0 by extrapolation. Therefore, the Gaussian and linear models are evaluated for the extrapolation to the
low-q region for the dry ETFE-PEM with an IEC of 1.3 mmol g−1
for comparison with the Debye–Bueche model to see whether the models employing the low-q extrapolation could affect the values of characteristic distances (Figure S1a, Supporting Infor-mation). As depicted in Figure S1b, Supporting Information, the corresponding γ1D(r) plots obtained within these two models
indicate that the behavior as well as the minimum and max-imum positions of γ1D(r) are almost the same as that obtained
with Debye–Bueche model, which are shown in Figure 3. Three different extrapolation methods to the low-q region show the same characteristic sizes of lamellar stacks were obtained within those methods for all the samples. This result is similar to that found by Liu et al. in the miscible blends of semicrys-talline poly(vinylidene fluoride) and semicryssemicrys-talline poly(1,4-butylene adipate) (PVF2/PBA).[36] Moreover, it has been pointed
out in the earlier works by Vonk and Kortleve[37] and Strobl
et al.[38] that the extrapolation to the low-q region (using linear
model and others) should have very small effect on the position and height of the maximum and minimum.
It is well known that the background intensity (IB(q)) in
the high q-range due to electron density fluctuation and the amorphous phase scattering of polymer materials are crucial. The contribution of IB(q) to the observed scattering intensities
was reported to be approximately 90% in the high q-range of SAXS profiles of polymeric materials.[39] However, there are
no reports concerning the effect of models for background estimation when extrapolating the SAXS profiles to the
high-q region. Thus, in this study, to check whether the
extrapola-tion to the high-q region could affect the values of L, Lc, and La,
we applied other Ruland and Vonk models such as Ruland 2[40]
(Equation S1, Supporting Information) and Vonk 4[32] and
Vonk 8[32] (Equations S2 and S3, Supporting Information) for
background corrections (Figure S2a, Supporting Information). Similar to the case of extrapolation to the low-q region, the extrapolation to the high-q region shows no effect in the values of calculated L, Lc, and La (Figure S2b, Supporting
Informa-tion). The results seem to be seasonable because for the present polymer systems the background intensity is only crucial in the high q-region (q ≥ 3 nm−1) but negligible in the low-q range
(q ≤ 2 nm−1), as the results of our previous report.[41]
In the present work, we have also checked the trunca-tion errors by varying the extrapolatrunca-tion at high q-range from 2.14 to 10 nm−1 with keeping the low q-range at 0.0039 nm−1
(Figure S3a, Supporting Information). Similarly, we fix the high
q-range limit of extrapolation at 3.13 nm−1, whereas the low
q-range one is changed from 0.09 to 0.0039 nm−1 (Figure S3b,
Supporting Information). In all cases, we obtain no significant difference in the calculated correlation functions.
It is reported that the pristine ETFE substates are anisotropic due to oriented crystallites (lamellar grains), generated at a film stretching process. The anisotropic character of the ETFE is more or less preserved through the preparation procedures and during propagation steps.[16,19,25] However, these oriented
crystallites in the pristine ETFE, grafted films, and ETFE-PEMs were found to exist locally but not through the whole mem-branes. In other words, the amorphous and crystalline phases in the lamellar grains are destributed randomly at the global scale. Consequently, the 1D correlation function in Equation (1) is defined with the assumption that the present lamellar struc-ture consisting of alternating parallel crystalline and amor-phous layers are randomly oriented.[26]
Figure 4 plots the 1D correlation function, γ1D(r), for all the
samples. The initial region of γ1D(r) exhibits almost a straight
line, which is possibly due to the presence of a sharp diffuse interface, as explained in Figure 2. A similar structural feature has also been reported in different PVDF- and ETFE-based membranes, where the SAXS profiles contain no detectable transition layer.[15] Consequently, the present system can be
described by a simplified two-phase one. As shown in Figure 4, the maximum and minimum positions of γ1D(r) of all the films
with various GDs differ distinctly with each other.[26,27] When
the GDs of the grafted-ETFE films increase, the oscillation in
γ1D(r) becomes weaker around the maximum and minimum
positions and then disappears quickly at the higher r values (Figure 4a). This behavior can be explained by the broader dis-tribution in the characteristic sizes of the lamellar stacks caused by the grafting effects. The changes of γ1D(r) plots with GD in
the dry and hydrated ETFE-PEMs are similar to those obtained in the grafted-ETFE films as seen in Figure 4b,c.
The interface distribution function, g(r), for all the grafted-ETFE films and grafted-ETFE-PEMs under dry and hydrated condi-tions was also evaluated (Figure S4, Supporting Information). Namely, the first minimum in the g(r) plots is defined as lamellar periods, Lg. The obtained Lg as a function of GD
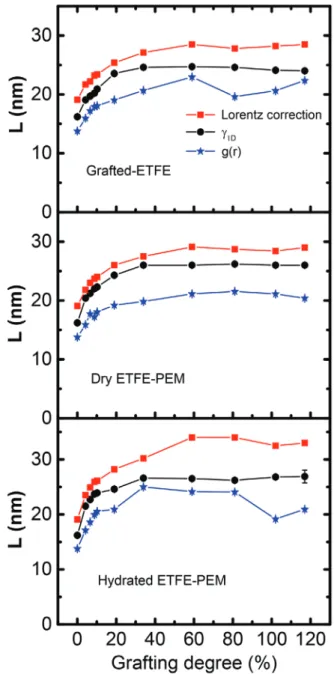
is depicted together with L1D in Figure 5. Furthermore, the
lamellar periods, which are evaluated based on the position of maxima q* of the Lorentz-corrected SAXS profiles using the Bragg law,[25] are also represented as L
L (=2π/q*) in Figure 5 in
order to make an intuitive comparison among all the methods. The values of Lg determined from g(r) are considerably lower
than those obtained from other two methods. These results are reasonable because the values of Lg are normally not affected by
the broad distribution of characteristic distances not as the case of γ1D(r).[26,27] Furthermore, the Lg values obtained from g(r) are
also smaller than those obtained from γ1D(r) even without any
separation of different contribution to g(r).[27] This difference
the determination of the lamellar periods based simply on the Bragg’s law in the SAXS profiles could lead sometime to inac-curate results in the weak ordering systems.[27] In other words,
the LL values, which are estimated from the peak maxima in
the Lorentz-corrected SAXS profiles, should be overestimated in the previous report.[25] As shown in Figure S4, Supporting
Information, the interface distribution functions showed very broad and weak peaks, which make the determination of the peak positions difficult. Accordingly, together with taking in account of the results from our previous investigations,[23–25]
we will take in advantage of the 1D correlation function for detailed analysis of the SAXS data for the predictions of the lamellar two-phase system.
3.3. Structural Changes in Lamellar Crystalline and Amorphous Layers
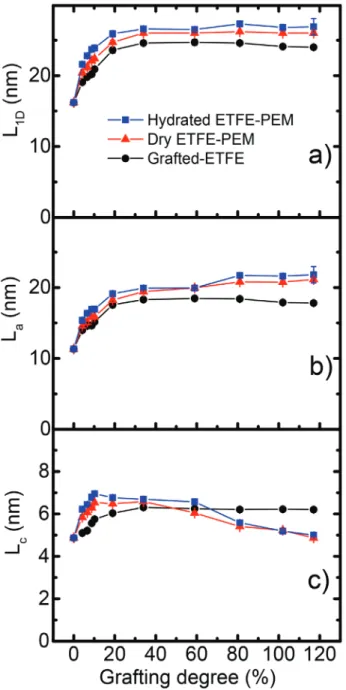
Figure 6 presents the L1D, La, and Lc of grafted-ETFE films
and ETFE-PEMs under dry and humidified conditions as a function of GD. All the values of L1D, La, and Lc are also
listed in Table S1, Supporting Information. As presented in Figure 6a, the values of L1D obtained from the grafted-ETFE
films increase sharply from 16.2 to 23.6 nm by increasing GD from 0 to 19% and then keep almost constant at higher GDs than 19%. The La of the films (Figure 6b) exhibits practically
the same profiles as that of L1D, namely it rises rapidly from Figure 4. The plots of 1D correlation function, γ1D(r), for the grafted-ETFE
films with GDs of 0–117% (a) and the corresponding dry (b) and hydrated ETFE-PEMs (c) within the same GD values, which are equivalent to the IECs in the range of 0–3.1 mmol g−1.
Figure 5. Average lamellar periods obtained by different evaluation methods, namely the position of maxima q* of the Lorentz-corrected SAXS profiles using the Bragg law (LL= 2π/q*), the first maximum in the
11.3 to 17.6 nm with the increase of GDs up to 19% and then remains relatively constant with GDs > 19%. The Lc of the
grafted-ETFE films (Figure 6c) also increases (4.9–5.8 nm) in the GD range of 0–10%. At GDs higher than 19%, the Lc keeps
virtually constant. The L1D and La versus GDs exhibit similar
profiles because an unambiguous reason for the increase of
L1D originate mainly from the expansion of La and partially
result from the slight increase of Lc. This finding partially
dif-fers from those obtained in the previous works, in which the enlargement of lamellar periods in the graft-type PEMs during the graft-polymerization was assigned as the expansion of the
amorphous lamellar thickness only.[7,20–22,25] The quick increase
of Lc at low GDs (<10%) can be elucidated by assuming solvent
induced recrystallization of ETFE amorphous layers. This is a kind of pretreatment effects of the polymer structures. Namely, in the present study, the graft polymerization (in styrene and toluene at 60 °C) and sulfonation (in chlorosulfonic acid and dichloroethane at 50 °C) to prepare the membranes were con-ducted. This kind of solvent induced recrystallization has not been reported for ETFE but well investigated for several poly-mers such as PEEK,[8,9,42] polypropylene (PP),[43] PVDF,[44] and
poly(ethylene terephthalate) (PET).[45]
For the dry ETFE-PEMs, the profile of L1D versus GDs is
likely to those of the grafted-ETFE films with slightly higher values (≈7%) in the whole GD range. The values of L1D
increase from 16.2 to 24.7 nm and then stay almost constant at lower and higher GD ranges than 19%, respectively. The values of Lc gradually increase from 4.9 to 6.5 nm as the case
of the grafted films at GDs < 10% and then slightly decrease back to the original level (6.5–4.9 nm) in the GD range of 10–117%. Namely, the ETFE-PEMs keep the lamellar crystal-line shape and thickness originated from the pristine ETFE during the graft-polymerization and sulfonation processes over the entire GD range. As in the case of La, the small gap
of Lc between the dry membranes and the grafted films can
be observed in the GD range of 59–79%. The re-increases of
La and the small gap with a GD around 79% should result
from the morphology change, which had been reported by the SAXS measurement previously.[25]
For the hydrated ETFE-PEMs, the L1D, La, and Lc values are
somewhat larger than those of the corresponding dry mem-branes owing to water absorption in the lamellae, but are very similar to each other at lower and higher GD ranges than 19%. Since the ETFE-PEMs with GDs of 34–117% have much larger water uptakes (WU = 41–145%), the water contents did not influence the expansion of L1D, La, and Lc. Accordingly, most
of water molecules in the ETFE-PEMs having higher GDs (>34%) exist at the outside of lamellar stacks. In other words, for the ETFE-PEMs with low GDs (<19%), all the hydrophilic graft-polymers (ion-channels) locate within the lamellar stacks and strongly restricted by lamellar crystalline layers, which suppress the swelling of the ion-channels. Since the Lc values
for the hydrated and dry PEMs are very similar to each other, the swelling within the stacked lamellar did not alter the lamellar crystalline layers. At higher GDs (>19%), the results obtained within the present work are similar to those reported in the previous studies for the same membranes, in which the thickness of the lamellar crystals was retained during the graft polymerization but decreased during the sulfonation process.[23,25]
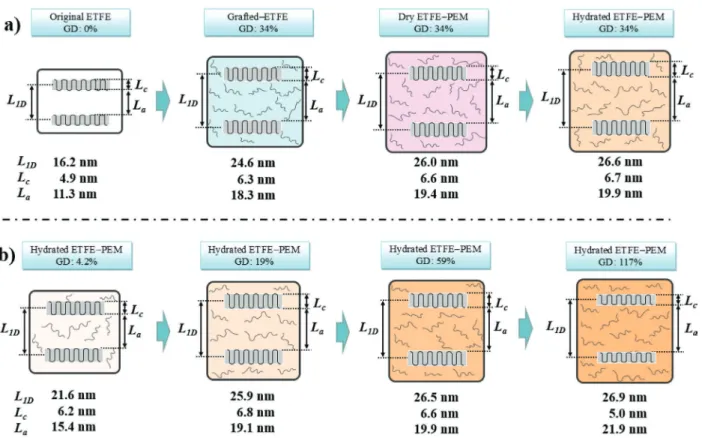
Figure 7a presents a probable schematic illustration for
explaining the change of the characteristic sizes of the lamellar period (L1D), amorphous lamellar thickness (La), and crystalline
lamellar thickness (Lc) of the stacked lamellae in the pristine
ETFE and grafted-ETFE at a GD of 34% and the corresponding ETFE-PEM at an IEC of 2.0 mmol g−1 under dry and humidified
conditions to show how the lamellar crystalline and amorphous layers expanded by the graft-polymerization, sulfonation, and hydration processes. The expansion of the lamellar amor-phous and crystalline layers of the original ETFE substrate Figure 6. a) Plots of the lamellar period (L1D), b) amorphous lamellar
thickness (La), and c) crystalline lamellar thickness (Lc) as a function of
(Lc= 4.9 nm, La = 11.3 nm) are originated not only from the
insertion of the PS grafts during the graft-polymerization (Lc=
6.3 nm, La= 18.3 nm) as in the cases of previous reposts[19–22,25]
but also from solvent induced recrystallization of ETFE amor-phous layers by sulfonation (Lc = 6.6 nm, La = 19.4 nm)
fol-lowed by a hydration process of the dry ETFE-PEMs (Lc =
6.7 nm, La= 19.9 nm).
Figure 7b shows a schematic illustration of the change in the characteristic lamellar sizes of the lamellar period (L1D),
amorphous lamellar thickness (La), and crystalline lamellar
thickness (Lc) in the hydrated PEMs having GDs of 4.2–117%
to show how the lamellar crystalline and amorphous layers expanded by the incorporation amounts (i.e., GD) of grafted PSSA. The thickness of the crystalline and amorphous layers (Lc and La) increases rapidly from 4.9 and 11.3 nm to 6.2
and 21.6 nm, respectively, at the very early stage of the graft polymerization (GD of 4.2%). The thickness of the amor-phous layers and overall lamellar crystals increases dramati-cally by 36% and 27%, respectively, in comparison with that of the pristine ETFE film. This is evident for the location of all the hydrophilic graft-polymers (ion-channels) in the stacked lamellae at the low GD ranges. At GDs higher than 4.2%, La
gradually increases from 15.4 to 21.9 nm in the whole GD range (up to 117%). The Lc also increases from 6.2 to 6.8 nm
in the GD range of 4.2–19%, while it decreases from 6.8 to 5.0 nm at higher GD than 19%.
On the basis of detailed analysis of changes in lamellar inner-structures of ETFE-PEMs (L1D, Lc, and La), induced by
the preparation (grafting and sulfonation) and hydration steps, using the SAXS profiles, the correlation between the electrolyte properties and the membrane morphology such as the lamellar structures can be elucidated in this study. At lower GDs than 19%, the membranes exhibit the high conductivity and low water uptake because the PSSA grafts effectively generate at the inside of lamellar stacks to have good connections of the ion channels and suppress the water absorption by the restricted environment between lamellar crystals in the stacks. In addi-tion, the solvent induced crystallization by preparation (grafting and sulfonation) and hydration steps increases the crystallinity, resulting in higher mechanical strength. At higher GD ranges than 19%, the PSSA grafts generate at outside of the lamellar stacks to have the large regions of highly condensed PSSA, leading to high conductivity with moderate water uptake. At higher GD ranges than 79%, the PSSA grafts mainly propa-gate at the outside of lamellar crystals (grains), which leads to less degradation of the lamellar structures only with gradual decreases of lamellar crystalline thickness. The retaining of the whole lamellar crystalline regions should be the crucial struc-tural factor for keeping mechanical strengths of the base sub-strate to some extent.
4. Conclusions
Using modified SAXS profiles corrected by Porod–Vonk and Debye–Bueche models for high- and low-q regions, the Figure 7. a) Schematic illustrations of the characteristic distances of the lamellar structure produced by the preparation procedures and at the immersed conditions in the pristine ETFE and grafted-ETFE with a GD of 34% and the dry and hydrated ETFE-PEM with an IEC of 2.0 mmol g−1.
lamellar periods (L1D), crystalline lamellar thickness (Lc), and
amorphous lamellar thickness (La) of the graft type
ETFE-PEMs can be evaluated from the 1D correlation function. The
L1D in all the grafted-ETFE films and ETFE-PEMs under dry
and hydrated conditions quickly increased at GDs less than 19% and then leveled off at higher GD ranges of 19–117% and approximately 14% lower values than those of LL, which
are directly evaluated from the peak maxima in the Lorentz-corrected SAXS profiles. For La and Lc values, all the grafted
films showed similar GD dependence to those of L1D, while
all the PEMs, no matter under dry or hydrated conditions, the solvent-induced recrystallization was observed at the early stage of grafting (GD < 10%) and successive sulfona-tion and hydrasulfona-tion steps. The further graft-polymerizasulfona-tion (GD > 10%) induced the decreases of Lc and the increases
of La, respectively. The re-increases of La and slightly large
drop of Lc at around GD of 79% should result from the
mor-phological change, which had been reported by the previous SAXS measurement.[25] The PEMs under dry and hydrated
states gave similar values in the La, Lc, and L1D at higher GD
ranges (>34%), leading to the conclusion that most of water molecules in the PEMs with higher GDs locate at the out-side of lamellar stacks. In contrast, for the PEMs with low GD regions (<19%), the all the hydrophilic graft-polymers (ion-channels) locate at strongly restricted lamellar stacks, which suppress the swelling of the membranes. Noted that the unique lamellar structures of the ETFE-PEMs character-ized by La and Lc is a big advantage for fuel cell applications
because a hardly deformed ETFE matrix, that is, lamellar crystallites, is necessary to guarantee the mechanical integrity and thermal stability.
Supporting Information
Supporting Information is available from the Wiley Online Library or from the author.
Acknowledgements
This research was funded by Vietnam National Foundation of Science and Technology Development (NAFOSTED) under grant number 103.04-2015.61. The authors thank Dr. Masota Ohnuma and Dr. Yojiro Oba for their help with the SAXS experiments. The authors would like to thank Enago for the English language review.
Conflict of Interest
The authors declare no conflict of interest.
Keywords
amorphous lamellar thickness, crystalline lamellar thickness, lamellar period, polymer electrolyte membranes, small angle X-ray scattering
Received: July 30, 2019 Revised: October 27, 2019 Published online:
[1] B. Smitha, S. Sridhar, A. A. Khan, J. Membr. Sci. 2005, 259, 10. [2] Y. Liu, J. L. Horan, G. J. Schlichting, B. R. Carire, M. W. Liberatore,
S. J. Hamrock, G. M. Haugen, M. A. Yandrasits, S. Seifert, A. M. Herring, Macromolecules 2012, 45, 7495.
[3] X. C. Chen, D. T. Wong, S. Yakovlev, K. M. Beers, K. H. Downing, N. P. Balsara, Nano Lett. 2014, 14, 4058.
[4] Q. Berrod, S. Lyonnard, A. Guillermo, J. Ollivier, B. Frick, A. Manseri, B. Améduri, G. Gébel, Macromolecules 2015, 48, 6166. [5] M. M. Nasef, Chem. Rev. 2014, 114, 12278.
[6] H. Iwase, S. Sawada, T. Yamaki, Y. Maekawa, S. Koizumi, Int. J.
Polym. Sci. 2011, 2011, 301807.
[7] H. Iwase, S. Sawada, T. Yamaki, Y. Maekawa, S. Koizumi, M. Ohnuma, Y. Maekawa, Macromolecules 2012, 45, 9121.
[8] S. Hasegawa, S. Takahashi, H. Iwase, S. Koizumi, N. Morishita, K. Sato, T. Narita, M. Ohnuma, Y. Maekawa, Polymer 2011, 52, 98.
[9] S. Hasegawa, S. Takahashi, H. Iwase, S. Koizumi, M. Ohnuma, Y. Maekawa, Polymer 2013, 54, 2895.
[10] M. Torkkeli, R. Serimaa, V. Eteläniemi, M. Toivola, K. Jokela, M. Paronen, F. Sundholm, J. Polym. Sci., Part B: Polym. Phys. 2000,
38, 1734.
[11] S. Hietala, S. Holmberg, J. Näsman, D. Ostrovskii, M. Paronen, R. Serimaa, F. Sundholm, L. Torell, M. Torkkeli, Angew. Makromol.
Chem. 1997, 253, 151.
[12] K. Jokela, R. Serimaa, M. Torkkeli, M. Elomaa, F. Sundholm, N. Walsby, T. Kallio, G. Sundholm, J. Appl. Crystallogr. 2000, 33, 723.
[13] S. Hietala, S. Holmberg, M. Karjalainen, J. Näsman, M. Paronen, R. Serimaa, F. Sundholm, S. Vahvaselkä, J. Mater. Chem. 1997, 7, 721.
[14] G. Gebel, E. Ottomani, J. J. Allegraud, N. Betz, A. L. Moël, Nucl.
Instrum. Methods Phys. Res., Sect. B 1995, 105, 145.
[15] K. Jokela, R. Serima, M. Torkkeli, F. Sundholm, T. Kallio, G. Sundholm, J. Polym. Sci., Part B: Polym. Phys. 2002, 40, 1539. [16] V. Sproll, G. Nagy, U. Gasser, J. P. Embs, M. Obiols-Rabasa,
T. J. Schmidt, L. Gubler, Macromolecules 2016, 49, 4253.
[17] S. Balog, K. Jetsrisupar, U. Gasser, G. G. Scherer, L. Gubler, Polymer 2014, 55, 3026.
[18] S. Balog, U. Gasser, K. Jetsrisupar, L. Gubler, Polymer 2013, 54, 4266.
[19] S. Balog, U. Gasser, K. Mortensen, L. Gubler, G. G. Scherer, H. B. Youcef, Macromol. Chem. Phys. 2010, 211, 635.
[20] J. M. Song, B. S. Ko, J. Y. Sohn, Y. C. Nho, J. Shin, Radiat. Phys.
Chem. 2014, 97, 374.
[21] J. M. Song, B. S. Ko, J. Y. Sohn, J. Shin, J. Nanosci. Nanotechnol. 2016, 16, 6313.
[22] S. Sawada, D. Yamaguchi, A. Putra, S. Koizumi, Y. MaekawaPolym.
J. 2013, 45, 797.
[23] T. T. Duy, S. Sawada, S. Hasegawa, Y. Katsumura, Y. Maekawa,
J. Membr. Sci. 2013, 447, 19.
[24] T. D. Tap, D. D. Khiem, L. L. Nguyen, N. Q. Hien, L. Q. Luan, P. B. Thang, S. Sawada, S. Hasegawa, Y. Maekawa, Radiat. Phys.
Chem. 2018, 151, 186.
[25] T. D. Tap, S. Sawada, S. Hasegawa, K. Yoshimura, Y. Oba, M. Ohnuma, Y. Katsumura, Y. Maekawa, Macromolecules 2014, 47, 2373.
[26] G. R. Strobl, M. Schneider, J. Polym. Sci., Polym. Phys. Ed. 1980, 18, 1343.
[27] C. S. Cruz, N. Stribeck, H. G. Zachmann, F. J. B. Calleja,
Macromole-cules 1991, 24, 5980.
[28] W. Ruland, Colloid Polym. Sci. 1977, 255, 417.
[29] N. Stribeck, W. Ruland, J. Appl. Crystallogr. 1978, 11, 535.
[30] P. Debye, H. R. Anderson, H. Brumberger, J. Appl. Phys. 1957, 28, 679.
[32] J. T. Koberstein, B. Morra, R. S. Stein, J. Appl. Crystallogr. 1980, 13, 34. [33] M. N. Khan, D. K. Bisoyi, J. Shukla, J. Appl. Polym. Sci. 2012, 125,
2356.
[34] S. Luo, D. T. Grubb, A. N. Netravali, Polymer 2002, 43, 4159. [35] U. Göschel, G. Urban, Polymer 1995, 36, 3633.
[36] L. Z. Liu, B. Chu, J. P. Penning, R. S. J. Manley, Macromolecules 1997, 30, 4398.
[37] C. G. Vonk, G. Kortleve, Kolloid Z. Z. Polym. 1967, 220, 19.
[38] G. R. Strobl, M. J. Schneider, I. G. Voigt-Martin, J. Polym. Sci. Polym.
Phys. Ed. 1980, 18, 1361.
[39] N. Stribeck, X-Ray Scattering of Soft Matter, 1st ed., Springer, Berlin 2007.
[40] J. Rathje, W. Ruland, Colloid Polym. Sci. 1976, 254, 358.
[41] T. D. Tap, L. L. Nguyen, S. Hasegawa, S. Sawada, L. Q. Luan, Y. Maekawa, unpublished.
[42] H. Cornélis, R. G. Kander, J. P. Martin, Polymer 1996, 37, 4573. [43] V. Vittoria, F. Riva, Macromolecules 1986, 19, 1975.
[44] Y. J. Park, Y. S. Kang, C. Park, Eur. Polym. J. 2005, 41, 1002. [45] H. Ouyang, W. H. Lee, W. Ouyang, S. T. Shiue, T. M. Wu,