Emerging Science Journal
Vol. 3, No. 4, August, 2019
Abstract
Water quality assessment is an increasingly important area in environmental study. Assessment of water quality can be a process include multiple factors which can causing influence on water quality. Researchers have developed many evaluation indices In order to display the results of water quality evaluation more intuitively. Water quality index has been the important fields in sustainable water quality management. This research based on the papers published of 20 years from web of science, analyzed the data by using CiteSpace 5.0. The result shows the direction, frontiers and hotspots of water quality index. Research from institutes, research keywords, word frequency, quoted literature and Subjects. The result shows in view of the world, India, China, US, Brazil and Iran are major countries. From the hotspots and frontiers of research, key words such like water quality management, drinking water quality are the main research hotspots and frontiers of social network in the contamination of water and water quality problem in China and India. this study provide a method for scientists to keep up with the situation of the study on water quality management., and puts forward suggestions for the further research on sustainable water quality index.
Keywords: Sustainable; Water Management; Big Data; CiteSpace; Developing Country. Article History:
Received: 18 April 2019
Accepted: 19 July 2019
1- Introduction
Water quality assessment is an increasingly important area in environmental study. To date, various methods have been developed and introduced to evaluate the water quality however, lack of method to provide the easy to understand the situation of water quality information has existed as a problem for many years. In recent years there have been many studies focused on the issue of the water quality protection. It is critical for the policy maker who is in charge of water policies to estimate potential water quality. For the high quality water quality management, water evaluation is an indispensable part of water policy [1]. However, evaluation of water quality is complicated because water quality pollution can be impacted caused by two main components, natural and human factors. WQI is used to evaluate water quality concerns across a plethora of watershed scales and environmental conditions [2]. As a core tool of water quality evaluation, WQI is significant for theory research and policy decision.
WQI evaluation is an effectively, widely used method [3]. A variety of methods are used to assess water quality. Each method has its advantages [4, 5]. WQI is a new way to evaluate water quality, first proposed by Horton as the new method to evaluate water quality from the Ohio River in America[4]. In this research, Horton considers general water quality factors, such as DO, pH, temperature, TDS and so on This method is a promising method to tackle water quality issue. With development of the research, water quality evaluation has been constantly improved. the new method by Brown took both basic and additional factors into evaluation to get more significant information of evaluation in special cases [5]. In recent years, many countries and international organization have proposed the new WQI like NSFWQI [6], CCMEWQI [7] and so on. Among the WQI models, in 2007, the United Nations approved CCMEWQI as an evaluating index of water quality globally [8]. Besides the traditional WQI approach, some new approaches have also been used in recent studies, such as artificial intelligence (AI) approach [9-10].
*CONTACT: [email protected]
DOI:http://dx.doi.org/10.28991/esj-2019-01187
© 2019 by the authors. Licensee ESJ, Italy. This is an open access article under the terms and conditions of the Creative Commons Attribution (CC-BY) license (https://creativecommons.org/licenses/by/4.0/).
aSophia University,Yotsuya Campus 7-1 Kioi-cho,Chiyoda-ku,Tokyo, 102-8554, Japan
Lei Zhang
a*A Water Quality Index Case Study
2- Research Data
Web of Science is an online academic database including journals concerning science and technology and social sciences. In this study, research data were collected from the WOS. Under the title of topic, we researched English articles with “water quality index” as theme-words, with 1997-2017 as time range of publication. Totally, 465 related literatures were found. This study combines CiteSpace II and Zotro. CiteSpace was applied as visualized network, and the studies among different countries research hotspots and research frontier were compared finally. Related literatures were found. This study combines CiteSpace II and Zotro. CiteSpace was applied as visualized network, and the studies among different countries research hotspots and research frontier were compared finally.
3- Research Tools
Many researchers study shows the information visualization are important research approach and means. There are many tools available to help analyze literature. In this research, commencing on the concept of Data Visualization, mainly discuss the data visualization technology and its application on the research of water quality assessment.
In this study, utilizing the CiteSpace as the main tool analysed papers of the last 20 years, and find the popular research topic and hot point of water quality protection. Citespace is a professional visualization tool that is developed in the context of data visualization. This research use CiteSpace to carry out the visualized network, and finally compared the studies between different countries, research hotspots and research frontier.
4- Results Analysis
4-1- Keywords
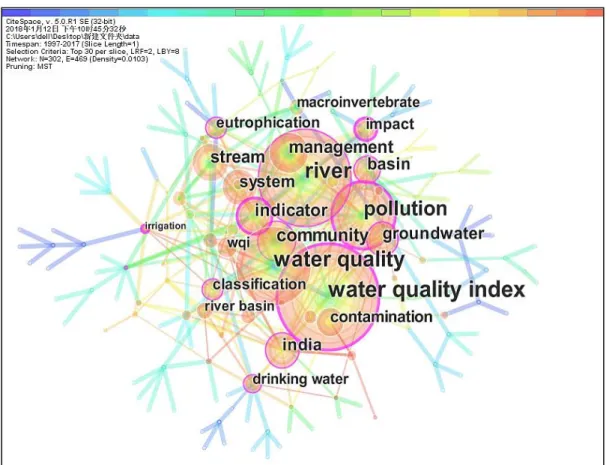
CiteSpace was used to analyze the co-occurrence network of 465 papers, and select Keyword to perform analysis on text topics. Keywords in literature are the core words extracted from articles that highly summarize the theme of an article (Figure 1). They are the core and essence of an article, as well as the high generalization and refinement of the theme. Keywords are often used to identify hotspots in a research field.
management has becoming increasingly influential. Using the water quality index method to evaluate the water quality are becoming more common in India
4-2- Time-Zone
On the basis of the co-occurrence diagram of key words, selects "Time zone" to form the key words Time zone diagram. It can be seen from the diagram that new keywords keep emerging and new hotspots and trends are formed along with the evolution of Time.
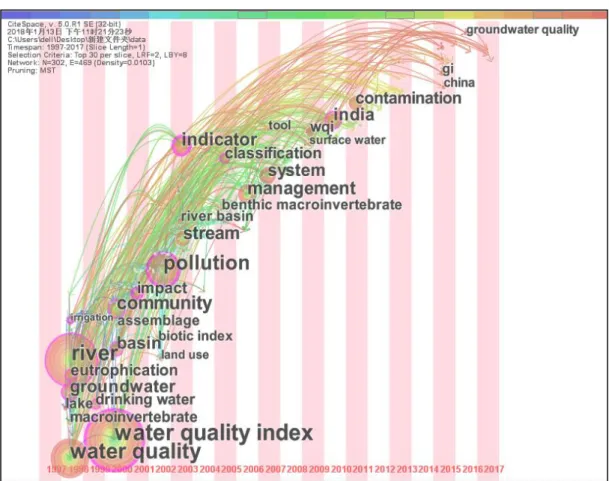
Figure 2 is a time-zone shows a keyword evolution of WQI research. Water quality index obviously has the highest frequency. In combination of other terms, including management, pollution, river, basin, and groundwater, we infer that the research on the water quality index the idea of water environment protect and eco-security control. At the same time, various words, such as groundwater and India, indicate that the WQI is playing more important role.in ground water quality management and water quality in developing countries. With development of water quality management theory and practice, project governance of water quality has gradually become a new hotspot in project management research.
Figure 2. Time-zone view of keyword evolution (1997-2017).
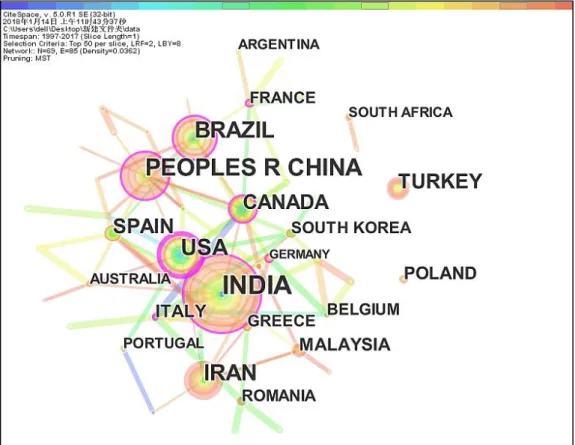
4-3- Countries Analysis
Figure 3. Research on water quality index in major countries. 4-4- Subject Analysis
4-5- Co-journal Analysis
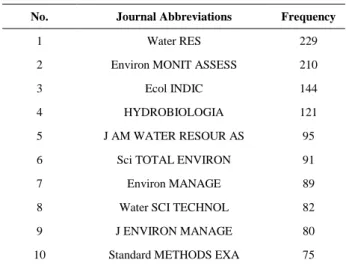
CiteSpace was applied to conduct visualized analysis of the data. Based on the co-journal analysis of literatures, the knowledge mapping network of co-journal is obtained, as shown in Figure 3. Each node is a kind of journal. The radius of a node is the frequency quoted. Chen and Li (2015) explained the citation ring in “CiteSpace: Detecting and visualizing emerging trends and transient patterns in scientific literature” [2]. The thickness of a ring is in proportion to the reference count in a given time slice. As shown in Table 1, Water RES, which has the largest ring, is the journal cited with the highest frequency (229), followed by Environ MONIT ASSESS (210) and Ecol Indic (144). Other Journals with high citation frequency include Hydrobiologia, J Am Water Resour As, Sci Total Environ, Environ Manage, Water Sci Technol, and many other kinds of international journals. (Table 1).
Table 1. Top 10 cited journals.
No. Journal Abbreviations Frequency
1 Water RES 229
2 Environ MONIT ASSESS 210
3 Ecol INDIC 144
4 HYDROBIOLOGIA 121
5 J AM WATER RESOUR AS 95
6 Sci TOTAL ENVIRON 91
7 Environ MANAGE 89
8 Water SCI TECHNOL 82
9 J ENVIRON MANAGE 80
10 Standard METHODS EXA 75
5- Conclusion
The research illustrates the time range of publication, countries, research directions, and citation analysis of the papers concerning WQI published from 1997 to 2017. In water pollution problems, groundwater and drinking water pollution has more and more receive attentions. , river basin management has becoming increasingly influential. Using the water quality index method to evaluate the water quality are becoming more common in India, without strong economic strength, advanced equipment, outstanding high-quality scientific research team, developing countries also has high regard to the development of water quality protect because water quality is very significant to sustainable social-economic development of the countries, like Iran and India. In terms of research direction, ENVIRONMENTAL SCIENCES & ECOLOGY is the most popular one.
It is undeniable that we have to admit that there are some shortcomings in this research. Although we tried to expand the retrieval by using topic mode, as a matter of fact, there were some publications which may not be included. When we chose to balance the accuracy and recall of retrieval, a small number of publications would not be taken into account. It is beneficial to upgrade retrieval. In addition, the diversity of results is not ensured because WOS was the only database applied, while other databases such CNKI and EI were not included.
Above all, the research illustrates the overall trends and hot spots concerning WQI to some extent. This research proposes a method that visualization is applicable to analyze research hotspots in such field.
With the help of IOT, big data, Artificial Intelligence and various new-generation technologies. Our understanding on water quality protection is completely overturned due to such new technologies. It can be predicted that the multivariate data visualization method will boost the research and design of WQI and which helps to the sustainable water quality management.
6- Acknowledgment
I would like to show my gratitude to my supervisor, Dr. Huang Guangwei, who has provided me with valuable guidance of this paper.
7- Conflict of Interest
8- References
[1] Brown, Robert M., Nina I. McClelland, Rolf A. Deininger, and Ronald G. Tozer. "A Water Quality Index- Do We Dare." (1970). [2] Chen, R., & Li, X., Application of the main factor analysis to water quality assessment of Dongjiang Lake. Journal of Hunan
University of Arts and Science (Science and Technology), Vol. 27 (No. 4, Dec. 2015), 64–68.
[3] Effendi, Hefni, Romanto, and Yusli Wardiatno. “Water Quality Status of Ciambulawung River, Banten Province, Based on Pollution Index and NSF-WQI.” Procedia Environmental Sciences 24 (2015): 228–237. doi:10.1016/j.proenv.2015.03.030. [4] Ekere, Nwachukwu R., Vitus E. Agbazue, Benedict U. Ngang, and Janefrances N. Ihedioha. “Hydrochemistry and Water Quality
Index of Groundwater Resources in Enugu North District, Enugu, Nigeria.” Environmental Monitoring and Assessment 191, no. 3 (February 9, 2019). doi:10.1007/s10661-019-7271-0.
[5] Hameed, Mohammed, Saadi Shartooh Sharqi, Zaher Mundher Yaseen, Haitham Abdulmohsin Afan, Aini Hussain, and Ahmed Elshafie. “Application of Artificial Intelligence (AI) Techniques in Water Quality Index Prediction: a Case Study in Tropical Region, Malaysia.” Neural Computing and Applications 28, no. S1 (June 8, 2016): 893–905. doi:10.1007/s00521-016-2404-7. [6] Horton, Robert K. "An index number system for rating water quality." Journal of Water Pollution Control Federation 37, no. 3
(1965): 300-306.
[7] Hurley, Tim, Rehan Sadiq, and Asit Mazumder. “Adaptation and Evaluation of the Canadian Council of Ministers of the Environment Water Quality Index (CCME WQI) for Use as an Effective Tool to Characterize Drinking Source Water Quality.” Water Research 46, no. 11 (July 2012): 3544–3552. doi:10.1016/j.watres.2012.03.061.
[8] Khan, Amir Ali, Annette Tobin, Renée Paterson, Haseen Khan, and Richard Warren. “Application of CCME Procedures for Deriving Site-Specific Water Quality Guidelines for the CCME Water Quality Index.” Water Quality Research Journal 40, no. 4 (November 2005): 448–456. doi:10.2166/wqrj.2005.047.
[9] Krenkel, Peter. Water quality management. Elsevier, 2012.
[10] Lumb, Ashok, T. C. Sharma, and Jean-François Bibeault. “A Review of Genesis and Evolution of Water Quality Index (WQI) and Some Future Directions.” Water Quality, Exposure and Health 3, no. 1 (March 25, 2011): 11–24. doi:10.1007/s12403-011-0040-0.
[11] Sakizadeh, Mohamad. “Artificial Intelligence for the Prediction of Water Quality Index in Groundwater Systems.” Modeling Earth Systems and Environment 2, no. 1 (December 22, 2015). doi:10.1007/s40808-015-0063-9.
[12] Zhang, L. "Water Quality Assessment and Pollution Characteristics Analysis for Lower Reaches in Liao River". Income Q. Zeng (eds), 2016 2nd International Conference on Environmental Pollution and Public Health, Vol. 8, (April, 2016): 131–138. [13] Zhang, Lei. “Different Methods for the Evaluation of Surface Water Quality: The Case of the Liao River, Liaoning Province,