International Journal of Research in Engineering & Applied Sciences Email:- [email protected], http://www.eur oasiapub.org
An open access scholarly, online, peer-reviewed, interdisciplinary, monthly, and fully refereed journals
22
Ultrasound Images
P. K. SARANYA1
Research Scholar
E. S. SAMUNDEESWARI2
Associate Professor
Department of Computer Science,
Vellalar College for Women, Erode-638012.Tamil Nadu, India
ABSTRACT
Designing a Computer Aided Diagnosis (CAD) system for Breast Ultrasound (BUS) B-mode image is a crucial task in medical diagnosis. Selecting and finding an optimal Feature Subset to classify the Benign and Malignant tumor more accurately is a high dominant process. This work emphasizes on analyzing and identifying the most discriminating features for diagnosing breast cancer using BUS images. In this work, 71 features (28 Morphological, 43 Textural) are extracted from 84 images (49 Benign, 35 Malignant cases) and considered for Feature Selection process. As a feature selector, Principal Feature Analysis (PFA) is applied to reduce the dimensionality of large feature vector by selecting 35 uncorrelated features. Finally GA, PSO, ACO and ABC optimization algorithms wrapped with Artificial Neural Network (ANN) as fitness evaluator are designed to mine the optimal feature subsets from the 35 selected features of PFA. Three feature subsets each containing 15, 10 and 5 features obtained from each optimization technique are assessed using the metrics like Sensitivity, Specificity, Accuracy, Matthews Correlation Coefficient (MCC) and Az under Receiver Operating Characteristics (ROC) curve. The results show that the PSO achieved a better classification accuracy of 94% f-measure, 0.8767 MCC value and Az as 0.9334 for all feature subsets than Bio and Swarm algorithms whereas the 12 common features selected from GA and Swarm algorithms yields 97.62% classification accuracy and suits well for designing a Breast Ultrasound CAD system.
KEYWORDS:
International Journal of Research in Engineering & Applied Sciences Email:- [email protected], http://www.euroasiapub.org
An open access scholarly, online, peer-reviewed, interdisciplinary, monthly, and fully refereed journals
23
1. Introduction
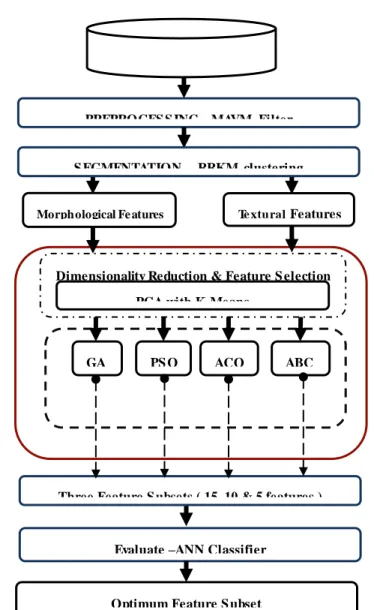
In recent years, Breast Cancer is found to be the most common cause of death for women worldwide. Detecting a tumor is done through physical examination, clinical, imaging, genomics, proteomics and biopsy. Most tumor detection methods are expensive, operator dependent and more subjective and require a well experienced physician to detect the lesion portion. Also painful injection methods like Fine Needle Aspiration (FNA) or Core Needle Biopsy is recommended by the physician to identify the malignancy. Hence to overcome these difficulties, researchers come forward to investigate and design an automated Computer Aided Diagnosis (CAD) system (Huang Y.-L. et al., 2008; Ke Nie et al., 2008; Hamid Behnam et al., 2010; Wen-Jie Wu et al., 2012). Breast Ultrasound (BUS) imaging (Ultrasonography) a painless, non ionizing, real time screening tool is identified for effective diagnosis of cyst and lesions in breast tissues. Designing a Computer Aided Diagnosis system for BUS includes preprocessing, segmentation, feature selection and classification phases. Each stage in CAD system depends on its previous stage and hence each stage is carefully designed. After extracting the Region of Interest (ROI/Tumor region) in segmentation phase, the most complicated task is to extract and select the more relevant features from high dimensional feature vector for classifying benign and malignant lesion. In this work, the feature vector is formed by extracting the Morphological (shape) and Textural features from the Region of Interest (Chulmin Yun et al., 2009). The shape features are extracted from the contour of tumor where as the textural features are extracted from various grey level distribution of lesion portion. The combination of these features result in the formation of high dimensional feature vector with relevant and irrelevant features, and hence the Feature Selection process is recommended. This process is carried out by using Principal Feature Analysis (PFA) to extract relevant features and then runs Evolutionary and Bio-Inspired algorithms on the selected features to construct a small subsets of significant features. These algorithms use Artificial Neural Network (ANN) as fitness evaluator. The statistical metrics like F-Measure, Matthews Correlation Coefficient (MCC) and Receiver Operating Curve (ROC) are used for assessing the classification accuracy and identifying the best Feature subset.
1.2 Methodology
International Journal of Research in Engineering & Applied Sciences Email:- [email protected], http://www.euroasiapub.org
An open access scholarly, online, peer-reviewed, interdisciplinary, monthly, and fully refereed journals
24
Figure 1. Feature Selection phases of CAD system for Breast Ultrasound image1.3 Preprocessing and Segmentation
Ultrasound images are inherited with speckle noise that has to be carefully suppressed without any edge degradation. Edge preservation helps to segment ROI and extract features accurately and hence preprocessing is considered as the first and foremost process. In this work, Modified AVM (MAVM) Filter, a spatial filter with 5x5 kernel size proposed by Saranya et al. (2015) is used for preprocessing. In MAVM filter, the kernel slides over the entire pixels of image. During the sliding process, sum of median of median and median of variance are calculated row-wise and
FEATURE SELECTION
Feature subset selection with
GA PS O ACO ABC
PREPROCES S ING - MAVM Filter
Morphological Fe atures Te xtural Features BUS Image Database
S EGMENTATION – RRKM clustering
Three Feature S ubsets ( 15, 10 & 5 features )
Evaluate –ANN Classifier
Optimum Feature S ubset
Dimensionality Reduction & Feature S election
International Journal of Research in Engineering & Applied Sciences Email:- [email protected], http://www.euroasiapub.org
An open access scholarly, online, peer-reviewed, interdisciplinary, monthly, and fully refereed journals
25
column-wise. The values are averaged with the central pixel value (Saranya et al., 2015). TheReKM is a variant of K-Means clustering concept combined with Regularization and Ant Colony Optimzation. The initial cluster centroids of K-Means is identified using Ant Colony Optimization’s pick and drop methodology and the Euclidean distance is modified with the
regularization parameter (λ as 0.007) for minimizing the distance within cluster and maximizing
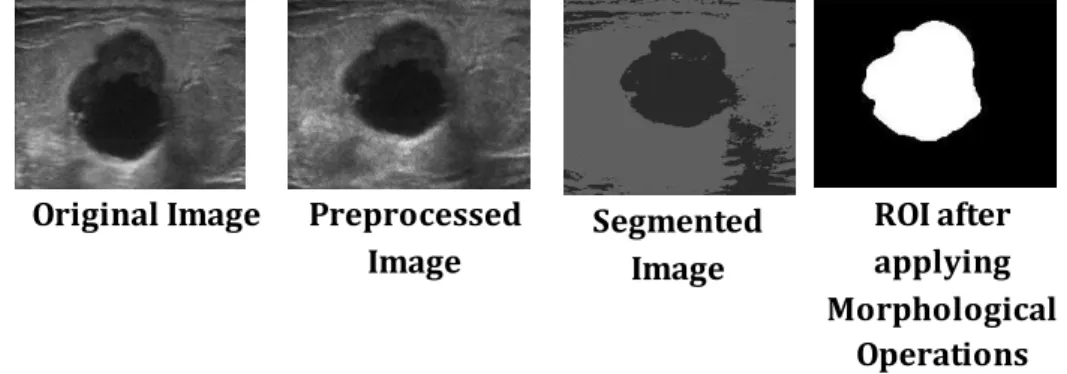
the distance between centroids (Samundeeswariet al., 2016). Figure 2 shows the preprocessed and segmented sample BUS image with Morphological Operations.
Original Image Preprocessed
Image Segmented Image
ROI after applying Morphological
Operations
Figure 2. BUS image- Preprocessed by MAVM filter and segmented by ReKM clustering with λ as 0.007
1.4 Feature Calculation
Features represent the characteristics of lesion that helps to differentiate the benign from malignant lesion. Generally Morphological, Textural, Model based and Descriptor features are extracted from Breast ultrasound image for identifying the type of lesion (Saranya et al., 2016). In this work, 28 morphological and 43 textural features are extracted and assessed to find discriminating features. The description and formula for these features are given as the Additional file 1.
1.4.1 Morphological Features
The morphological features are extracted from the shape and contour of the lesion in segmented BUS image (Saranya et al., 2016). It is learnt that most of benign lesion will be round in shape
and circumscribed margin than malignant lesion. Twenty eight features are extracted for this
International Journal of Research in Engineering & Applied Sciences Email:- [email protected], http://www.euroasiapub.org
An open access scholarly, online, peer-reviewed, interdisciplinary, monthly, and fully refereed journals
26
1.4.2 Textural FeaturesPictographically, the texture is termed as a repeating pattern of local variations in grey level intensity. Statistical methods are used to characterize the texture indirectly according to the gray level intensities of an image in particular area (Saranya et al., 2016). The 43 textural features considered for this work includes six Histogram, twenty two Gray Level Co-occurrence Matrix (GLCM), eleven Grey-Level Run-Length Matrix (GLRLM), Fractal Dimension and three Tamura features.
2
. Feature Selection Methods
Feature Selection is the important issues in medical diagnosis and bioinformatics where the optimum features are identified under certain criteria. It is the process of framing a subset with countable number of M features from the large N feature space, so that the optimum accuracy is reached (Jihoon Yang and Vasant Honavar 1998). Feature selection algorithms include Filter, Wrapper and Embedded approach. Filter approach ranks the features individually using any ranking function and highly ranked features are selected finally to form a best feature subset. Ranking function for Numerical features are Euclidian distance, T-test, signal-to-noise ratio (SNR), Principal Component Analysis (PCA) and the Fisher Discriminant Ratio (FDR), and for categorical features are information gain and entropy (Kohavi, R., and John, G.H., 1997). The work approaches the feature selection in two steps. In the first step Principal Feature Analysis (PFA) is used as a filter method. It reduces the dimensionality of high feature space by removing correlated features. In second step, the reduced feature set is subjected to feature selection using Evolutionary and Swarm algorithms with Artificial Neural Network as a fitness evaluator. To obtain a satisfactory number of features, 3 subsets containing 15, 10 and 5 features respectively are formed.
2.1 Principal Feature Analysis (PFA)
Principal Feature Analysis (PFA) is a standard statistical technique in image processing applications and is similar to Principal Component Analysis (PCA). PCA is a versatile, unsupervised tool used for data reduction without any loss of information by eliminating the least discriminative features from its large feature space. The three criteria that PCA holds are, (i) If there is P number of variables then there will be only P principal components (PCs) that are linear combination of the variables. (ii) The PC containing the maximum variance will be the first component with highly uncorrelated features and (iii) All the PCs are mutually orthogonal i.e. the features are uncorrelated and perpendicular to each other. Since it is difficult to infer what the components exactly mean, K-Means clustering is incorporated to PCA and termed as PFA to extract the required number of uncorrelated features with minimum mean square error (Yijuan Lu et al., 2007; Drineas, P et al., 2004). PFA chooses the highest dominant coefficients in each PCs as variables (features). The following steps describe the methodology of the PFA for feature selection.
Assume X as a zero mean n-dimensional random feature vector
International Journal of Research in Engineering & Applied Sciences Email:- [email protected], http://www.euroasiapub.org
An open access scholarly, online, peer-reviewed, interdisciplinary, monthly, and fully refereed journals
27
Step 2.
Construct a matrix A whose columns are orthogonal eigenvectors of matrix such thatA AT
where
n 2 1
-
, 1 2 ... n are Eigen values and each row
represents the projection of ith feature in matrix X. The highly correlated features will be
placed in the larger Eigen value row vector.
Step 3.
Compute the coefficient of principal components (PCs) where the column vector of PCsare arranged with respect to Eigen values from higher to lower one i.e. the first few PCs contain the highly uncorrelated features with maximum variance in feature space.
Step 4.
Choose q number of PCs (columns) that have Eigen values greater than 1.Step 5.
A New matrix Aq with size n x q is obtained.Step 6.
Fix k as the number of clusters i.e. no of features required.Step 7.
Cluster the vectors |V1|,|V2| ,...|Vn| of Aq using K-Means clustering algorithm with Euclidean distance measure.Step 8.
For each cluster, find the vector Vi which is nearest to the centroid of the cluster. Choosethe corresponding feature Xi as principal feature.
The features chosen at each clusters are grouped together to form a set of uncorrelated features that is optimal in terms of high spread in lower dimension and insensitive to noise. The resultant subset is evaluated using ANN classifier to find the accuracy of reduced feature set.
2.2 Feature Subset Selection Using Optimization Algorithms
Feature subset selection is the process of framing an optimal subset of highly discriminating features from M number of features with the aim of attaining highest classifier accuracy (Min Long and Fei Peng 2013). The conventional feature subset selection comprises of subset generation, subset evaluation, stopping criterion and result validation process. Subset generation process generates the candidate subset (feature subset) in each iteration i.e. locally best features, and subset evaluation process evaluates the candidate subset based on any searching strategy and compares with previously generated candidate set to update the globally best feature subset. The stopping criterion is reached with the completion of specified number of iterations and the resultant subset is validated with test data or real data (Hany M. Harb and Abeer S. Desuky 2014). This work adapts Optimization techniques such as Genetic algorithm, Particle Swarm Optimization, Ant Colony Optimization and Artificial Bee colony algorithms to find the optimum solution among the feasible solution space that reduces the complexity and computational time, and increases the accuracy of the model.
2.2.1 Genetic Algorithm (GA)
International Journal of Research in Engineering & Applied Sciences Email:- [email protected], http://www.euroasiapub.org
An open access scholarly, online, peer-reviewed, interdisciplinary, monthly, and fully refereed journals
28
candidates to a given problem is maintained within the search space. A fitness value is assignedto each candidate representing its ability to ‘compete’. Three biological processes like Selection, Crossover and Mutation are used to find the best candidate among individuals in a specified search space (Chulmin Yun et al., 2011). Two parents (candidates) with best fitness value are selected to yield a better offspring (candidate for the next population). In GA, each candidate is a binary coded, fixed length vector representing the selection of features. The candidates are evaluated using fitness function like Fitness Proportionate Selection (Roulette Wheel Selection), Tournament Selection, and Truncation Selection. Two chromosomes (parents) are crossed over using single point, double point or uniform pattern method to yield new offspring. The genes in the offspring can also be altered (say, 0 becomes 1, 1 becomes 0- toggle the selection of features) using Mutation process to introduce diversity into the population and expanding opportunity to search in unexplored search space to yield better off springs (Wen-Jie Wu et al., 2012 ; G.Ravi Kumaret al., 2014). This is repeated until the expected condition (for example number of populations or improvement of the best solution) is satisfied.
The following steps describe the proposed work that combines GA with ANN classifier for feature selection.
Initialize
Generate random population of n chromosomes, maximum number of iterations and fix the
crossover percentage as 0.7 and mutation rate as 0.1. Evaluate fitness f(x) using Eq.(9) for each candidate x. Do
1. Select two best candidates using Roulette Wheel Selection method.
2. With crossover probability, perform crossover using single crossover point and produce
offspring.
3. With mutation probability, apply mutation to yield new offspring.
4. Evaluate the fitness value for offspring using Eq. (10).
5. Sort the candidates and offsprings based on their fitness value and select the best n
chromosomes as new population. Until (maximum iterations completed) //do
GA is found to be one of the best evolutionary algorithms that yield possible solution for the problem effectively. From the resultant subset, the required number of features are selected and used for classification.
2.2.2 Particle Swarm Optimization (PSO)
International Journal of Research in Engineering & Applied Sciences Email:- [email protected], http://www.euroasiapub.org
An open access scholarly, online, peer-reviewed, interdisciplinary, monthly, and fully refereed journals
29
solution achieved by it at any point of time is called as personal best, pbestand the best value
that is achieved so far by any other particle in its neighborhood is called as global best, gbest.
In this algorithm, each particle (bird) represents a possible solution to the classification problem
in the feature space. The particle p is represented in d dimension as xp =( xp1 , xp2 , … xpd). The
previous best position (pbest ) found by the pth particle is given as ( Pp1 , Pp2 , … Ppd ) and the
velocity of pth particle is represented as vp =( vp1 , vp2 , … vpd ). The global best value (gbest) among
all the particles is represented as ( Pg1 , Pg2 , … Pgd ) (C.R. Hema et al., 2008). The process behind
PSO is described in the following steps.
Initialize
Number of particles (n)
Personal and global learning coefficients (C1 & C2 respectively) in the range 0-4
Maximum number of iterations
, the inertia factor to control the impact of current velocity to the next iteration’s velocity
Assign random variables within the feature space to the position of all the particles. Calculate the fitness of each particle, pbest using Eq. (9).
Evaluate the global best particle among the entire local best particle and store it as gbest.
Do
For each particle ‘xp’ p = 1,2,…n
Find the fitness F(xp) using Eq. (9)
If F(xp) is better than F(pbest)
Then update pbest = xp
If F(pbest) is better than F(gbest) Then update gbest = pbest End For
For each particle ‘xp’
Update new velocity vector vp by
𝒗𝒑𝒅𝒏𝒆𝒘= ∗ 𝒗 𝒑𝒅 𝒐𝒍𝒅+ 𝑪
𝟏∗ 𝒓𝒂𝒏𝒅 (𝒑𝒃𝒆𝒔𝒕𝒑− 𝒙𝒑𝒅𝒐𝒍𝒅) + 𝑪𝟐∗ 𝒓𝒂𝒏𝒅 (𝒈𝒃𝒆𝒔𝒕𝒑− 𝒙𝒑𝒅𝒐𝒍𝒅) (2)
Update new position of ‘xp’ by
𝒙𝒑𝒅𝒏𝒆𝒘= 𝒙 𝒑𝒅 𝒐𝒍𝒅+ 𝒗
𝒑𝒅
𝒏𝒆𝒘 (3)
End For
While (stopping criteria or number of iterations not met)
International Journal of Research in Engineering & Applied Sciences Email:- [email protected], http://www.euroasiapub.org
An open access scholarly, online, peer-reviewed, interdisciplinary, monthly, and fully refereed journals
30
2.2.3 Ant Colony Optimization (ACO)
ACO, a meta-heuristic algorithm proposed by Marco Dorigo in 1992 has been successfully applied to NP-hard combinatorial optimization problems (M. Dorigo and G. Di Caro 1999). This population based search algorithm is inspired by the behavior of ants. The ants search for food randomly and find the shortest route to reach it. During random search, the ants lay pheromone a chemical substance (stigmergy) as a path trail from nest to food source and if the route is short, the ants lay more pheromone to reinforce the trail. Pheromone has the characteristics of evaporation and so the stronger pheromone trail will be then followed by other ants. The Ant Colony optimization technique comprises of Tour Construction and Pheromone Updation. Tour construction is the process of constructing the tour path by each ant and the pheromone updation is done to identify the shortest path. The proposed work mimics the ant behavior to find the optimum feature subset. At initial stage ant start its solution construction with partial solution and extent by adding feasible solution component determined by the probability rule. The algorithm for finding the best feature subset by ACO is described below (Aghdam MH et al., 2009).
Initialization phase
Number of ants (n), maximum number of iterations, pheromone matrix as unit matrix, pheromone exponential weight (α), heuristic exponential weight (β) and evaporation rate (ρ). Number of nodes to visit by each ant (d).
Do
Generate ‘n’ Ants
For Each Ant ‘m’ (m=1,2,…n)
Randomly choose starting position (feature) as i Repeat
Construct next position (feature) from place i to j using the transition probability
rule where i=1,2,…|d|
𝑷𝒊𝒋𝒎 = {
𝝉𝒊𝒋 𝜶 ∗ 𝜼 𝒊𝒋 𝜷
∑ 𝝉𝒊𝒋 𝜶 ∗ 𝜼 𝒊𝒋 𝜷
𝑪𝒊𝒋𝝐(𝑺𝒑) 𝑖𝑓 𝑗 ∈ 𝐽𝑖 𝑚
0 𝑜𝑡ℎ𝑒𝑟𝑤𝑖𝑠𝑒
(4)
where τij is the pheromone on edge (i,j) and ηij is the heuristic value of choosing
feature j when at feature i. α and β are the constant value that determines the
pheromone and heuristic value. 𝐽𝑖𝑚 is the set of neighbor features of i not visited
so far
Choose the position with higher probability
Add the position to the tour constructed by the ant
Assign j to i
International Journal of Research in Engineering & Applied Sciences Email:- [email protected], http://www.euroasiapub.org
An open access scholarly, online, peer-reviewed, interdisciplinary, monthly, and fully refereed journals
31
Gather all tour (feature subsets) formed by ‘n’ antsCalculate the fitness of the current solution of each ant using Eq. (9) Update the best solution
For Each Ant ‘m’ (m=1,2,…n) // Update pheromone
Calculate the density of pheromone laid on edge(i, j) by 𝝉𝒊𝒋= 𝝆 ∗ 𝝉𝒊𝒋+ ∑𝒏 𝚫𝝉𝒊𝒋 𝒎
𝒎=𝟏
(5)
where 𝜌 is (0,1) an evaporation constant, 𝚫𝝉𝒊𝒋 𝒎 = 𝑸/𝑳𝒎 if the mth ant uses the
edge(i,j), else 0 where Q is the any constant and L is the length of tour of mth ant.
End For
While (maximum number of iterations not met)
The features visited in best tour path by the ant are considered to form a feature subset for classifying benign and malignant tumor.
2.2.4 Artificial Bee Colony (ABC)
ABC is a swarm based meta-heuristic algorithm inspired by the intelligent foraging behavior of
honey bees proposed by Karaboga in 2005 (Karaboga and B Akay 2012). In ABC, artificial bees
consists of three groups of bees: Initially employed bees are associated with specific food sources (solutions), onlooker bees watches the dance of employed bees (fitness function) within the hive to choose a food source, and abandoned employed bees becomes scout bees and start
searching for new food sources randomly (Mauricio Schiezaro and Helio Pedrini 2013). Both
onlookers and scouts are called unemployed bees. If the solution is beyond the maximum limit then it will be exhausted. The methodology of ABC with ANN classifier is described in the following steps.
Initialization phase
Maximum number of iterations.
Initialize the number of population (bees) as n and the corresponding food source xm in d
dimension vectorare calculated by
xmi = l+ rand(0,1) × (u−l) (6)
where m= 1,2,..,n , i = {1,2,..d} are randomly selected indexes, u and l are upper and lower
limits of the feature space.
Calculate the fitness F(xm ) for each employed bee using Eq.9.
REPEAT
Employed Bees Phase
{
International Journal of Research in Engineering & Applied Sciences Email:- [email protected], http://www.euroasiapub.org
An open access scholarly, online, peer-reviewed, interdisciplinary, monthly, and fully refereed journals
32
υmi = xmi +ϕmi × (xmi−xki) (7)
where 𝑘 ∈ {1, 2, . . . , n} and i ∈ {1, 2, . . . , d}, xki is a randomly selected food source and ϕmi
is a random number
Calculate fitness of food sources found by Employed bees F(υm) using Eq.9 and if F(υm) is
better than fitness of F(xm ), Update local best position= υm.
}
Calculate the probability values pm for the food source ‘m’by
𝒑𝒎 =∑𝑭(𝒎)
𝑭(𝒌) 𝒏
𝒌=𝟏
Onlooker Bees Phase {
Select the food source (wm) based on higher probability of 𝒑𝒎
The neighborhood food source vm is calculated by
υmi = wmi +ϕmi × (wmi −wki)
Calculate fitness of both the food sources.
If fitness of F(wm) is better than F( vm ) then update local best position= wm else Move wm
to abandon position ci
}
Scout Bees Phase {
Ifci >= max_limit then abandon food source else Memorize the best solution achieved so far }
UNTIL (Maximum iterations reached)
The global best features selected from local best solutions are used for classifying tumors into Benign and Malignant.
2.3 Artificial Neural Network (ANN)
ANN, a machine learning algorithm is proposed by McCulloch, Warren and Walter Pitts in 1943. It is inspired by the biological neural networks (i.e. central nervous system of human brain) which can estimate a function using large number of inputs and swap over the information between interconnected neurons (McCulloch et al., 1943). ANN is a pragmatic, supervised model that trains the inputs (features of instances) using any learning algorithm to find the hidden
patterns (classes). It is designed with one Input and Output layer and one or more number of
International Journal of Research in Engineering & Applied Sciences Email:- [email protected], http://www.euroasiapub.org
An open access scholarly, online, peer-reviewed, interdisciplinary, monthly, and fully refereed journals
33
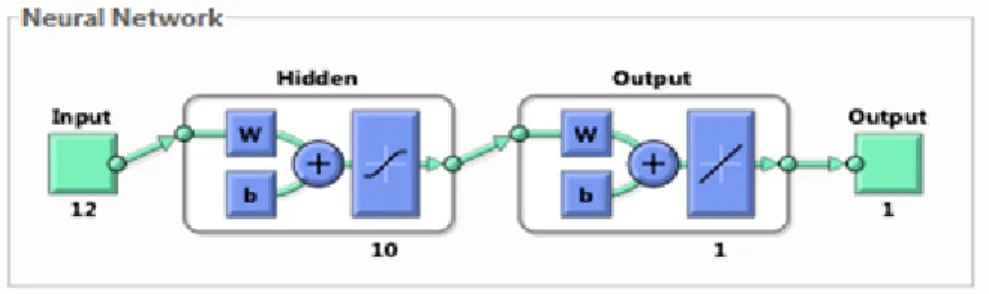
Figure 3 Neural Network modelIn this work, 75% of the dataset is used for training the model and the remaining 25% is treated as testing data to assess the accuracy of the designed model. The Levenberg-Marquardt (TRAINLM) back-propagation algorithm is used to train the training data (Guoqiang Peter Zhang 2014). It uses gradient descent method to update the weights so as to minimize the squared error between the network output values and the target output values. The weights of the nodes of hidden and output layers are also adjusted to reduce the mean square error using the sigmoid
or squashing function where the weighted sum of inputs S is calculated as in Eq.3. The inputs are
squashed in order to balance the outcome values between 0 and 1. Hyperbolic Tangent Sigmoid transfer function is used in this model.
S h
e
S
sigmoid
z
1
1
)
(
(8)
In this work, ANN is used as a fitness evaluator for all the above mentioned algorithms. The resultant confusion matrix is used to measure the classification accuracy of the selected feature subset. The overall accuracy obtained by the feature subset is calculated by
𝑶𝑨 = 𝟏𝟎𝟎 × ∑𝒅𝒊=𝟏𝑪𝒊𝒊
∑𝒎𝒊=𝟏∑𝒏𝒋=𝟏𝑪𝒊𝒋 (9)
where mxn is the size the confusion matrix C and d is the number of diagonal elements. The sum
of the diagonal elements of Cmxn specifies the number of samples that are correctly classified.
3. Results and Discussion
International Journal of Research in Engineering & Applied Sciences Email:- [email protected], http://www.euroasiapub.org
An open access scholarly, online, peer-reviewed, interdisciplinary, monthly, and fully refereed journals
34
TPR= TP / Conditional positive
TNR= TN / Conditional Negative
Accuracy= TP + TN / (TP + FP + TN + FN)
used to assess the feature subsets formed by evolutionary and swarm algorithms include Sensitivity, Specificity, Accuracy, ROC and Mathew Correlation Coefficient (MCC). All these assessments are calculated from the resultant Confusion Matrix of ANN classifier. Confusion matrix shows the number of instances that are correctly and incorrectly classified as True positive (TP), True negative (TN), False negative (FN) and False positive (FP). Then the Sensitivity or the True Positive Rate (TPR), Specificity or the True Negative Rate (TNR) and Accuracy (F-measure) are calculated by
(10)
Mathew Correlation Coefficient (MCC) introduced by Brain W. Mathews in 1975, is one of the most used machine learning performance measure for identifying the quality of binary classification problem (Cheng HD et al., 2010). It is calculated by
𝑴𝑪𝑪 = 𝑻𝑷∗ 𝑻𝑵−𝑭𝑷∗ 𝑭𝑵
√(𝑻𝑷+𝑭𝑷)(𝑻𝑷+𝑭𝑵)(𝑻𝑵+𝑭𝑷)(𝑻𝑵+𝑭𝑵) (11)
The Receiver Operating Characteristic (ROC or Az - area under curve) is a metric used to measure
the quality of binary classifiers using graphical plot. It is formed by plotting the TPR (Sensitivity) against FPR (1-TNR) for various threshold values across the interval [0,1]. The graph is plotted using cumulative distribution function where the area is under -∞ to +∞.
3.1 Assessing Feature Selection and Feature Subset Selection
With the aim of reducing the dimensionality and extracting relevant feature from correlated feature space, PFA is considered. In this experiment, PFA is applied for Morphological and Textural features independently, but there is no significant difference in classification accuracy and hence the combined feature vector is considered to select 50% of the features. Out of 28 Morphological and 43 Textural features, 18 Morphological and 17 Textural features got selected and indexed. To identify the effect of dimensionality reduction and feature selection, the original dataset and features selected by PFA are assessed using ANN classifier. Table 1 describes the percentage of classification accuracy of original dataset and feature selected by PFA. It is found from Table 1 that the effect of feature selection by PFA achieved higher classification accuracy with 92.3% than the original dataset. Nearly 20% of accuracy is increased with reduction of dataset.
Table 1 Accuracy comparison of Features Selection process by PFA
Methods Accuracy in %
Original Dataset 69.3
Reduced Feature set formed by PFA 92.3
International Journal of Research in Engineering & Applied Sciences Email:- [email protected], http://www.euroasiapub.org
An open access scholarly, online, peer-reviewed, interdisciplinary, monthly, and fully refereed journals
35
Sum entropy, Information measure of correlation, Inverse difference normalized, Kurtosis,Energy, Low Gray-Level Run Emphasis (LGRE), High Gray-Level Run Emphasis (HGRE), Long Run High Gray-Level Emphasis (LRHGE), Fractal Dimension, Tamura-coarseness and Tamura-Fdirection.
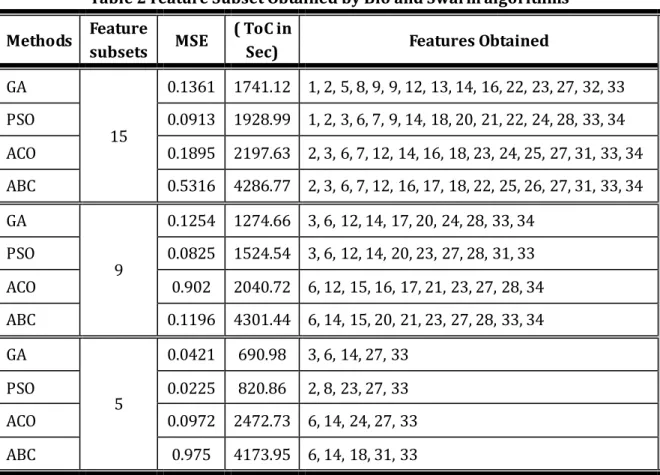
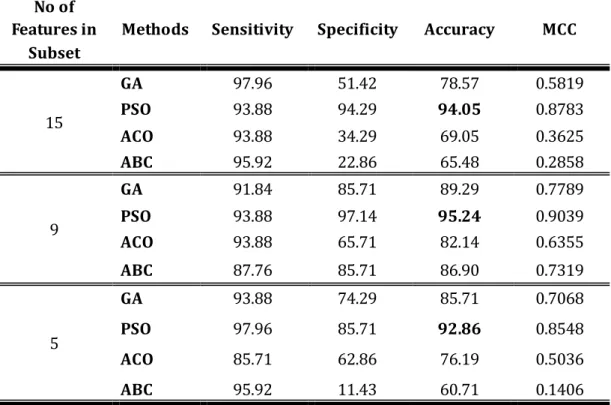
Though the classification accuracy achieved so far is better, this research work aims to extend the analyses further to find the minimal number of relevant and optimal features (Feature subset) that can improve classification accuracy and minimize time of computation. For this further analysis, the feature set formed by PFA is considered. The four optimization techniques are then applied individually to form three subsets containing 15, 9 and 5 features respectively. All the techniques are wrapped with ANN as fitness evaluator and the classification accuracy of the resultant feature subsets are assessed using ANN classifier. Table 2 depicts the features selected by the algorithms and Table 3 shows the corresponding classification accuracy of feature subsets.
Table 2 Feature Subset Obtained by Bio and Swarm algorithms
Methods Feature
subsets MSE
( ToC in
Sec) Features Obtained
GA
15
0.1361 1741.12 1, 2, 5, 8, 9, 9, 12, 13, 14, 16, 22, 23, 27, 32, 33
PSO 0.0913 1928.99 1, 2, 3, 6, 7, 9, 14, 18, 20, 21, 22, 24, 28, 33, 34
ACO 0.1895 2197.63 2, 3, 6, 7, 12, 14, 16, 18, 23, 24, 25, 27, 31, 33, 34
ABC 0.5316 4286.77 2, 3, 6, 7, 12, 16, 17, 18, 22, 25, 26, 27, 31, 33, 34
GA
9
0.1254 1274.66 3, 6, 12, 14, 17, 20, 24, 28, 33, 34
PSO 0.0825 1524.54 3, 6, 12, 14, 20, 23, 27, 28, 31, 33
ACO 0.902 2040.72 6, 12, 15, 16, 17, 21, 23, 27, 28, 34
ABC 0.1196 4301.44 6, 14, 15, 20, 21, 23, 27, 28, 33, 34
GA
5
0.0421 690.98 3, 6, 14, 27, 33
PSO 0.0225 820.86 2, 8, 23, 27, 33
ACO 0.0972 2472.73 6, 14, 24, 27, 33
ABC 0.975 4173.95 6, 14, 18, 31, 33
International Journal of Research in Engineering & Applied Sciences Email:- [email protected], http://www.euroasiapub.org
An open access scholarly, online, peer-reviewed, interdisciplinary, monthly, and fully refereed journals
36
optimization techniques form the subsets with maximum Morphological and minimum TexturalFeatures.
Table 3 Comparison of Qualitative Measures of GA, PSO, ACO and ABC Algorithms No of
Features in Subset
Methods Sensitivity Specificity Accuracy MCC
15
GA 97.96 51.42 78.57 0.5819
PSO 93.88 94.29 94.05 0.8783
ACO 93.88 34.29 69.05 0.3625
ABC 95.92 22.86 65.48 0.2858
9
GA 91.84 85.71 89.29 0.7789
PSO 93.88 97.14 95.24 0.9039
ACO 93.88 65.71 82.14 0.6355
ABC 87.76 85.71 86.90 0.7319
5
GA 93.88 74.29 85.71 0.7068
PSO 97.96 85.71 92.86 0.8548
ACO 85.71 62.86 76.19 0.5036
ABC 95.92 11.43 60.71 0.1406
Table 3 shows that the PSO yields an average of 94% Sensitivity value for correctly classifying the positive instances of Benign and Malignant Lesions, 92% Specificity for correctly classifying the negative instances of Benign and Malignant Lesions. Also PSO yields an overall accuracy of 94% for all the three feature subsets (15, 9 and 5) where as the GA, ACO and ABC yields 5% to 9% less accuracy than PSO. Among the optimizations, PSO proves itself to be the better feature selector in forming an optimum subset.
Figure 4 Comparison of MCC values among GA, PSO, ACO and ABC with ANN Classifier The Mathew Correlation Coefficient (MCC), a well known classification accuracy predictor depicted in Table 3 gives an additional assessment to prove the effectiveness of optimization techniques qualitatively. Table 3 and Figure 4 clearly proves that PSO yields a higher MCC value of 0.8783, 0.9039 and 0.8548 than GA, ACO and ABC for 15, 9 and 5 Feature subsets. It is also
0 0.5 1
GA PSO ACO ABC GA PSO ACO ABC GA PSO ACO ABC
15 10 5
MCC Values
International Journal of Research in Engineering & Applied Sciences Email:- [email protected], http://www.euroasiapub.org
An open access scholarly, online, peer-reviewed, interdisciplinary, monthly, and fully refereed journals
37
found that the MCC values for ACO and ABC are very less for all the three subsets and yield lessclassification accuracy.
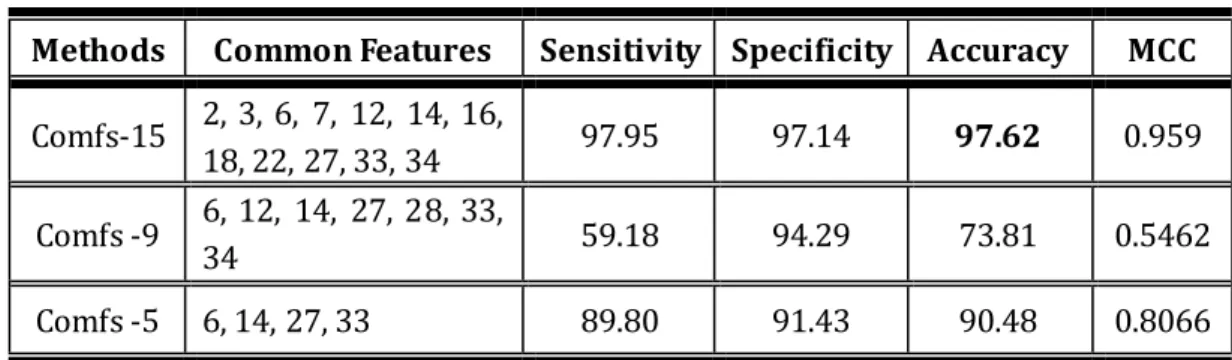
The work is further extended to identify whether the common features found in all the optimization techniques will yield any improvement in classification accuracy. The common features (Comfs) found in more than two optimization techniques are grouped individually for the three subsets. The resultant Comfs-15, Comfs-9 and Comfs-5 are analyzed using ANN classifier. Table 4 describes the common feature subsets (Comfs-15,9,5) and the corresponding accuracy metrics.
Table 4 Statistical Measures of Common Features
Methods Common Features Sensitivity Specificity Accuracy MCC
Comfs-15 2, 3, 6, 7, 12, 14, 16,
18, 22, 27, 33, 34 97.95 97.14 97.62 0.959
Comfs -9 6, 12, 14, 27, 28, 33,
34 59.18 94.29 73.81 0.5462
Comfs -5 6, 14, 27, 33 89.80 91.43 90.48 0.8066
International Journal of Research in Engineering & Applied Sciences Email:- [email protected], http://www.euroasiapub.org
An open access scholarly, online, peer-reviewed, interdisciplinary, monthly, and fully refereed journals
38
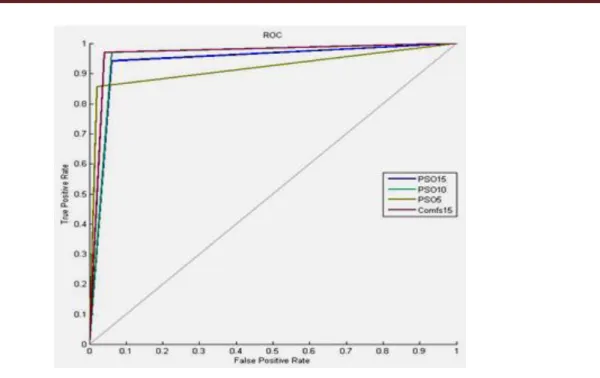
Figure 5 Comparison of Area under CurveFigure 5 pictorially describes the accuracy variation among the 15, 9 and 5 PSO Feature Subsets
with Comfs-15. It is found from Figure 6 that Comfs-15 achieved the area under curve -Az as
0.9653 which provides a better accuracy than the individual Bio and Swarm Optimization algorithms. It is observed that the proposed work acquired higher classification accuracy with minimum number of optimal feature subset formed from the combination of GA, PSO, ACO and ABC algorithms and outperforms with 97% accuracy rate in classifying Benign and Malignant tumor in Breast Ultrasound Images. Selecting and finding an optimum feature set using various Bio and Natural inspired algorithm is a challenging task in Feature selection Phase in CAD system. This work found the improvement of classification accuracy of dimensionality reduction from 71 feature vector to a subset of 12 relevant, significant features using the combination of Bio and Swarm algorithms. This optimal feature subset yields a good ROC and suits well for classifying breast tumors in BUS CAD system.
4. Conclusion
International Journal of Research in Engineering & Applied Sciences Email:- [email protected], http://www.euroasiapub.org
An open access scholarly, online, peer-reviewed, interdisciplinary, monthly, and fully refereed journals
39
Ultrasound CAD system.References
1. Aghdam MH, Tanha J, Naghsh-Nilchi AR, Basiri ME (2009) , ‘Combination of Ant Colony
Optimization and Bayesian Classification for Feature Selection in a Bioinformatics Dataset’, Journal of Computer Science and System Biology, 2: 186-199.
2. Chulmin Yun, Byonghwa Oh, Jihoon Yang And Jongho Nang (2011), ‘Feature Subset
Selection Based on Bio-Inspired Algorithms’, Journal Of Information Science And Engineering ,27, 1667-1686.
3. Cheng HD, Shan J, Ju W, Guo Y, Zhang L (209), ‘Automated breast cancer detection and
classification using ultrasound images: A survey’, Pattern Recognition, 43(1):299–317
4. Chang R.F., Wu W.J., Moon W.K., Chen D.R., (2005), ‘Automatic Ultrasound Segmentation
And Morphology Based Diagnosis Of Solid Breast Tumors’, Breast Cancer Res Treat,89: 179–185.
5. Drineas, P.; A. Frieze; R. Kannan; S. Vempala; V. Vinay (2004), ‘ Clustering large graphs via
the singular value decomposition’, Machine learning 56: 9–33.
6. M. Dorigo and G. Di Caro (1999), ‘The Ant Colony Optimization Meta-Heuristic’, New Ideas
in Optimization. McGraw-Hill.
7. Guoqiang Peter Zhang (2014), ‘Classification of Breast Cancer Data with Harmony Search
and Back Propagation Based Artificial Neural Network’, IEEE 22nd Signal Processing and Communications Applications Conference.
8. Hany M. Harb and Abeer S. Desuky (2014), ‘Feature Selection on Classification of Medical
Datasets based on Particle Swarm Optimization’, International Journal of Computer Applications (0975 – 8887), Volume 94 – No.5.
9. Hamid Behnam , Fahimeh Sadat Zakeri , Nasrin Ahmadinejad (209), ‘Breast Mass
Classification On Sonographic Images On The Basis Of Shape Analysis’, Journal of Medical Ultrasonics, 37:181–186.
10. C.R. Hema, M.P. Paulraj, S. Yaacob, A.H. Adom and R. Nagarajan ( 2008), ‘Particle Swarm
Optimization Neural Network based Classification of Mental Tasks’, Biomed 2008, Proceedings 21, Springer Heidelberg, pp. 883–888.
11. Huang Y.-L., Chen D.-R., Jiang Y.-R., Kuo S.-J., x Wu S.-J. and Moon W. K. (2008),
‘Computer-Aided Diagnosis Using Morphological Features For Classifying Breast Lesions On Ultrasound’, Ultrasound in Obstetrics & Gynecology, Vol. 32, No 4, pages 565–572.
12. Jihoon Yang and Vasant Honavar (1998), ‘Feature subset selection using Genetic
Algorithm’, IEEE Intelligent Systems.
13. D Karaboga, B Akay (2012), ‘A modified artificial bee colony algorithm for real-parameter
optimization’, Information Science. 192, 120–142
14. D Karaboga (2005), ‘An idea based on honey bee swarm for numerical optimization’,
Computer Engineering Department, Engineering Faculty, Erciyes University,Turkey, (2005)
15. Ke Nie, Jeon-Hor Chen, Hon J. Yu, Yong Chu, Orhan Nalcioglu, and Min-Ying Su (2008),
International Journal of Research in Engineering & Applied Sciences Email:- [email protected], http://www.euroasiapub.org
An open access scholarly, online, peer-reviewed, interdisciplinary, monthly, and fully refereed journals
40
16. Kohavi, R., and John, G.H., (1997), ‘Wrappers for feature subset selection’, Artificial
Intelligence, 97, 273-324.
17. J. Kennedy and R. Eberhart (1995), ‘Particle Swarm Optimization’, Proceeding of the IEEE
International conference on neural networks, pp. 1942-1948.
18. Mauricio Schiezaro and Helio Pedrini (2013), ‘Data feature selection based on Artificial Bee
Colony algorithm’, EURASIP Journal on Image and Video Processing, 2013:47
19. McCulloch, Warren, Walter Pitts (1943), ‘A logical Calculus of Ideas immanent in Nervous
Activity’, Bulletin of Mathematical Biophysics 5(4), 115-133.
20. M. Nazir, A. Majid-Mirza, S. Ali-Khan (2014), ‘PSO-GA Based Optimized Feature Selection
Using Facial and Clothing Information for Gender Classification’, Journal of Applied Research and Technology, Vol.12.
21. G.Ravi Kumar, Dr.G.A.Ramachandra, K.Nagamani (2014), ‘An Efficient Feature Selection
System to Integrating SVM with Genetic Algorithm for Large Medical Datasets’, International Journal of Advanced Research in Computer Science and Software
Engineering,Volume 4, Issue 2.
22. Samundeeswari E.S., Saranya P.K., Manavalan R., (2016), ‘Segmentation of Breast
Ultrasound Image Using Regularized K-Means (ReKM) Clustering’, 2016 International Conference on Wireless Communications, Signal Processing and Networking (WiSPNET),
IEEE Xplore Digital Library, DOI:10.1109/WiSPNET.2016.7566362 , Sep 2016
23. Saranya P. K., Samundeeswari, E. S.,(2016), ‘A Study on Morphological and Textural
Features for Classifying Breast Lesion in Ultrasound Images’, International Journal of Innovative Research in Science, Engineering and Technology, Vol. 5, Issue 3
24. Saranya P K, Samundeeswari ES, Manavalan R (2015), ‘Noise Reduction in Breast
Ultrasound Images Using Modified AVM Filter’, International Journal of Informative and
Futuristic Research (IJIFR), 3(4)
25. Segyeong Joo, Yoon Seok Yang, Woo Kyung Moon, and Hee chan Kim (2004) ,
‘Computer-Aided Diagnosis of solid Breast Nodules: Use of an Arificial Network Based on Multiple Sonographic Features’, IEEE transaction on medical imaging, 23 (9).
26. Ultrasoundcases [http://ultrasoundcases.info/category.aspx?cat=67] (Accessed May
2014).
27. Wen-Jie Wu, Shih-Wei Lin, Woo Kyung Moon (2012), ‘Combining Support Vector Machine
With Genetic Algorithm To Classify Ultrasound Breast Tumor Images’, Computerized Medical Imaging and Graphics, 36, 627– 633.
28. Yasmeen Mourice George, Hala Helmy Zayed, Mohamed Ismail Roushdy, and Bassant
Mohamed Elbagoury (2014), ‘Remote Computer-Aided Breast Cancer Detection and Diagnosis System Based on Cytological Images’, IEEE Systems Journal, vol. 8, no. 3.
29. Yijuan Lu, Ira Cohen, Xiang Sean Zhou, Qi Tian (2007), ‘Feature Selection Using Principal