2015; 3(2-2): 6-12
Published online January 27, 2015 (http://www.sciencepublishinggroup.com/j/ajche) doi: 10.11648/j.ajche.s.2015030202.12
ISSN: 2330-8605 (Print); ISSN: 2330-8613 (Online)
Study of relationship between flotation rate and bubble
surface area flux using bubble-particle attachment
efficiency
Behzad Shahbazi
Mining Engineering Department, Science and Research Branch, Islamic Azad University, Tehran, Iran
Email address:
To cite this article:
Behzad Shahbazi. Study of Relationship between Flotation Rate and Bubble Surface Area Flux using Bubble-Particle Attachment Efficiency.
American Journal of Chemical Engineering. Special Issue: Flotation Technology. Vol. 3, No. 2-2, 2015, pp. 6-12. doi: 10.11648/j.ajche.s.2015030202.12
Abstract:
Understanding the attachment micro process is a fundamental step toward predicting the rate constant of flotation kinetics. In this research, the effect of bubble-particle attachment efficiency on k-Sb relationship was investigated under Yoon,Stokes and Potential conditions. Maximum Stokes attachment efficiency obtained was 55.9% with particle size of -37 µm, Sbof
34.2 1/s and flotation rate of 1.65 1/min. Stokes attachment efficiency was less than Yoon efficiency and it seems to be a suitable equation for predicting attachment efficiency. Furthermore, three different models were obtained for estimating attachment efficiency usingk-Sb relationship.
Keywords:
Flotation, Kinetics, Bubble, Attachment1. Introduction
The bubble–particle collision micro process, attachment and detachment strongly depend on the chemistry and physical chemistry of the surface of solid particle and bubble. At present these two micro processes are the least quantified, because there are many complex phenomena involved which are not well understood yet [1].
Froth flotation is widely used for separating different minerals from each other. However, its influence is limited to a relatively narrow particle size range of 10–100µm [2, 3].
Although the effect of particle size on flotation performance has been widely studied to date [2, 4-6], and many important physico-chemical factors related to particle size have been identified, the net effect of these factors are very difficult to predict. For example, in bubble-particle interaction, particle size is known to play a critical role in the probability of particles colliding with bubbles, attachment of particles to bubbles after collision, as well as remaining attached in the pulp [7, 8].
Fine particles typically show slow recovery rates, owing to decreased particle-bubble collisions, and are prone to entrainment. Moreover, very small particles tend to have large specific areas, which can lead to excessive adsorption of reagents, and other effects associated with chemically
active particles. These factors can have a considerable impact on grades and recoveries, depending on the dominant effects in operation [9, 10]. Efficiency of the bubble–particle stability depends on the particle size, particle hydrophobicity and external detaching forces. Even in the flotation of fine particles, the bubble–particle detachment can significantly influence the kinetics of flotation taking place in mechanical cells by intensive turbulent agitation [11]. For these fine particles, the bubble-particle detachment is often neglected. So far the effect of hydrodynamic parameters on flotation response of coarse and fine particles has been widely investigated [12-18].
The surface area flux work has been published in a series of papers [19-24] and Gorain et al (1997) investigated the effect of gas dispersion properties on the flotation rate constant in plant and pilot scale mechanical cells over a range of operating conditions for four impeller types. They found that the rate constant was not readily related to the bubble size, gas holdup or superficial gas rate individually, but it was related to bubble surface area flux (
b
S ). For example, for
shallow froths the relationship was linear [23]. These authors found [23, 24] that Sb(1/s) was strongly related with
k
b
S P
k= × (1)
Where P summarized the operational and chemical factors. This k-Sb relationship appears to be independent of both the
type and size of mechanical cell and, consequently, has important implications with regard to the optimization, scale-up and design of mechanical flotation cells.
In this research, the effect of bubble surface area flux on bubble-particle attachment efficiency was investigated and bubble-particle attachment efficiency was calculated under Yoon, Stokes and Potential conditions. Furthermore, three models were obtained for estimating bubble-particle attachment efficiency with k-Sb relationship in different
conditions. According to author's knowledge, these models are the first equations for predicting bubble-particle attachment efficiency with k-Sb relationship.
2. Materials and Methods
Flotation tests were carried out in a mechanical laboratory
flotation cell. Impeller diameter was 0.07 meter for a cell with square section of 0.13 and height of 0.12 meter. Impeller rotating speed was 900, 1000, 1100 and 1200 rpm and air flow rate was 60, 120, 180 and 240 l/hr. Quartz particles (specific gravity=2.65 3
cm
g ) of four size classes contain -37, -53+-37, -75+53 and -106+75 µm were used for flotation experiments (all size fractions were combined together before flotation). The frother was MIBC (methyl iso-butyl carbinol) with concentration of 22.4 ppm and CCC200 (critical coalescence concentration). The flotation experiments were carried out by dodecylamine collector (50 g/ton) at the natural pH of 8.5 using local tap water. When Sbvalues were set, all the size fractions floated together under
those exact conditions (Table 1).
The air flow rate and impeller speed were set and float product collected at time intervals 1, 2, 3 and 5 minutes. The recovery R determined as a function of time t and flotation rate constant was calculated. The batch wise flotation of mineral particles may be described by a first order rate equation where the rate of removal of particles is given by:
Table 1. Flotation tests conditions
240 180
120 60
Gas aflow Rate (l/hr) 1200 1100 1000 900 1200 1100 1000 900 1200 1100 1000 900 1200 1100 1000 900 Impeller Speed (rpm) 623 680 746 823 624 681 747 824 625 683 749 826 628 686 752 829 b
d (µm)
8.92 7.27 5.79 4.48 8.17 6.65 5.29 4.08 7.30 5.93 4.71 3.62 5.87 4.75 3.75 2.86 g ε (%) 0.4 0.4 0.4 0.4 0.3 0.3 0.3 0.3 0.2 0.2 0.2 0.2 0.1 0.1 0.1 0.1 g J (cm/s) 34.2 32.27 30.28 28.23 27.43 25.89 24.31 22.69 20.19 19.08 17.94 16.77 12.16 11.53 10.88 10.21 b
S (1/s), Eq. (14)
0.21 0.25 0.30 0.37 0.21 0.25 0.30 0.37 0.21 0.25 0.30 0.37 0.21 0.25 0.31 0.37 b
V (m/s)
130 169 223 299 130 170 224 301 131 171 226 303 133 174 229 307 b Re 5.98 4.18 2.95 2.15 5.98 4.18 2.95 2.15 5.98 4.18 2.95 2.15 5.98 4.18 2.95 2.15
ε
(W/kg), Energy dissipationkC dt dC
−
= (2)
Where C is the particle concentration in mass per unit volume and k is a ‘rate constant’. The flotation rate constant was calculated assuming the first order rate equation for a batch cell, R=R∞(1−exp(−kt)), and plotting ln(1−R R∞) versus t.
The bubble size distribution was measured in a device similar to the McGill bubble viewer. It consisted of a sampling tube attached to a viewing chamber with a window inclined 15o from vertical. The closed assembly was filled with water of a similar nature to that in the flotation cell (to limit changes in bubble environment during sampling) and the tube was immersed in the desired location below the froth. Bubbles rose into the viewing chamber and were imaged by a digital camera as they slid up the inclined window, which was illuminated from behind. In this research, at first, frother was added to the water of the cell and then the viewing chamber was filled with water of the cell to prevent bubble coalescence [25].
The Washburn method was used to measure contact angle on powder. Contact angle of quartz particles was measured
using LAUDA tensiometer (TE3) after flotation tests. The LAUDA tensiometer simplifies the characterization of wetting behavior of the whole surface. The contact angle was measured by means of the precise adjustment of the immersion/ receding rate and micrometer-accurate measurement of the immersion dept. Contact angle of the quartz samples after flotation was obtained 89.7o using this method.
3. Theory
The flotation rate constant is proportional to the collection efficiency [26], this equation can be seen as the embryonic form of the below equation:
a c col E E
E = (3)
where Ec is ‘the ratio of the number of the particles
encountering a bubble per unit time to the number of the particles approaching the bubble at a great distance in a flow tube with a cross-sectional area equal to the projected area of the bubble’ [27]. Eais the attachment efficiency. When the
) E 1 ( E E
Ecol= c a − d (4)
Where Ed is the particle-bubble detachment efficiency [28].
The availability of stream function also makes it possible to predict Ea. For predicting attachment probability under Yoon
conditions, can use bellow equation [29]:
(
)
(
)
+ + − = 1 d d d 15 vt Re 8 45 exp arctan 2 sin E p b b i 72 . 0 b 2a (5)
Where: dp is the diameter of particle, db is the diameter of
bubble,ti is induction time, V is bubble raise velocity. There
is another generalized equation for calculation Ea according
to [1]: + = b p i 2 a d d UAt 2 h sec
E (6)
Where: dp is the diameter of particle, db is the diameter of
bubble, ti is induction time, U is particle settling velocity and
A is a dimensionless parameter under Stokes flow (A1) or
Potential flow (A2) according below equations:
3 1 1 1 4 1 1 4 3 1 − − + − + − + = b p b p d d d d U V
A (7)
3 2 1 2 1 1 − + + + = b p d d U V
A (8)
Sincedb, V, U and ti are four necessary parameters for
calculating attachment efficiency, they were obtained using following equations. The mean bubble diameter adopted was the Sauter diameter, calculated by below equation [30]:
∑
∑
= 2 i i 3 i i 32 b d n d n d ord (9)
Where n is the number of bubbles, and d is the bubble diameter. If the surface of a drop or bubble is immobile for any reason, the floating velocity is the same as that of a solid sphere and the bubble raise velocity can be described by Stokes' equation [31]:
g 18 d V 2 b ν
= (10)
Where
ν
is the kinematic viscosity. Also, Particle settling velocity can be described by below equation [32]:(
)
ρ ρ − ρ = 3g p dp
U (11)
Where g,
ρ
p andρ
are gravitational acceleration, particledensity and fluid density respectively. The induction time is a function of the particle size and contact angle which can be determined by experiment and correlated in the form of [33]:
B p
i Ad
t = (12)
Where parameters A and B are independent of particle size.It was found that parameter B is constant with a value of
0.6, and parameter A is inversely proportional to the particle contact angle θ. Based on these findings, the following equation was used [34]:
6 . 0 75 p i d t θ
= (13)
Where: tiis given in second, θ in degrees and dpin meter.
The probability of adhesion can now be calculated for given values of bubble size, particle size and contact angle.
4. Results and Discussions
4.1. Bubble Diameter
Bubble diameter was measured. According to Table 1, bubble diameter was 623 to 829 micron. Maximum bubble diameter obtained was 829 micron when impeller speed, air flow rate and bubble surface area flux were 900 rpm, 60 l/hr and 10.21 1/s, respectively. Minimum bubble diameter obtained was 623 micron with impeller speed of 1200 rpm, air flow rate of 240 l/hr and bubble surface area flux of 34.2 1/s. Flotation rate increased with decreasing bubble diameter due to increasing bubble-particle collision efficiency.
4.2. Bubble Surface Area Flux
CalculatingSbin flotation cells is difficult and expensive
due to difficulty in measuring bubble diameter. In this research, an empirical model was obtained for estimating Sb
in different operating conditions (under conditions of Table 1 with impeller diameter of 0.07 and 0.09 meter and pulp density up to 20%). Impeller peripheral speed (Ns) instead of
impeller speed (N) was used to determine the contemporary influence of impeller speed and impeller diameter in models. Also, superficial gas velocity (Jg) instead of air flow rate per
unit cell cross-sectional area (Q/A) was used for modeling.Pd
is pulp density.
005 . 0 d 805 . 0 g 699 . 0 s
b 25N J P
S = R2=0.92 (14) 4.3. k-Sb Relationship
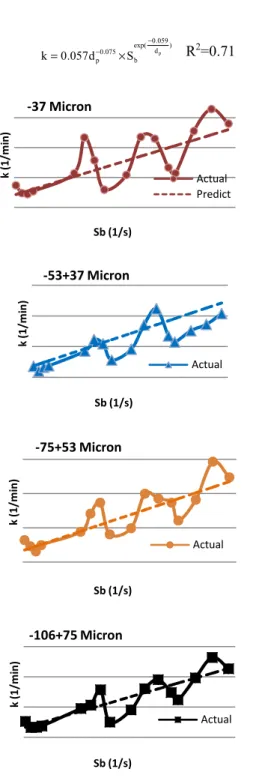
According to Fig. 1, flotation rate increased with increasing bubble surface area flux and decreasing particle size. When particle size, impeller speed and bubble surface area flux were -37 µm, 1100 rpm and 32.27 1/s, maximum flotation rate was obtained 1.89 1/min. coarser quartz particles showed a pronounced lower flotation rate than finer ones. It seems that bigger particles demand much more turbulence to become suspended and collide with air bubbles than smaller ones.
A deviation is observed from linear k-Sbrelationship in Fig.
1. This could be due to the inapplicability of the hypothesis by Gorain et al. (1997) of linear k-Sbrelationship. So, a
α
× =P Sb
k relationship was assumed for flotation response of
quartz particles and a model was fitted to actual values for obtaining influence of particle size on k-Sbrelationship. Eq.
) d
059 . 0 exp( b 075 . 0 p
p
S d 057 . 0 k
−
− ×
= R2=0.71 (15)
Fig. 1. k-Sbrelationship for different particle sizes
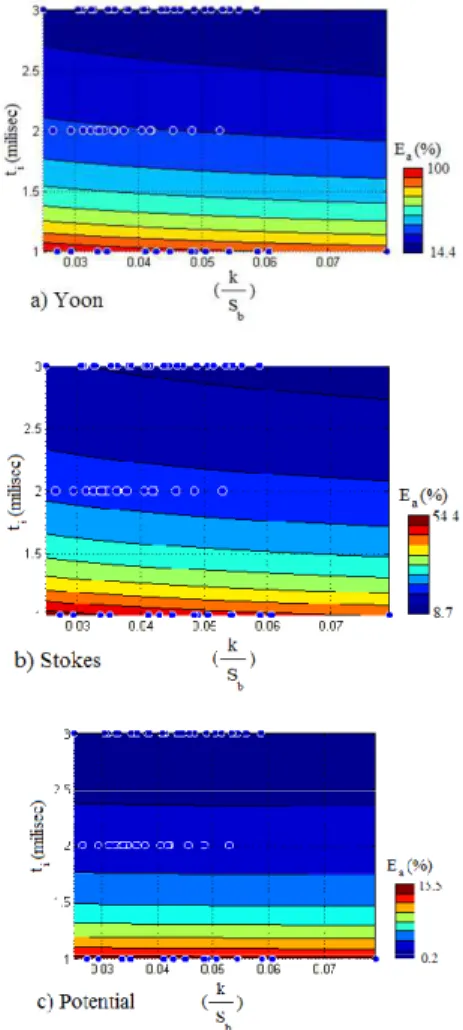
4.4. Calculating Attachment Efficiency
According to Fig. 2a, Yoon attachment efficiency was calculated for different particle sizes using Eq. (5). In this research, with decreasing particle size, attachment efficiency increased to maximum magnitude of 94.8%. With increasing Sb, flotation rate increased but
attachment efficiency decreased. So, increasing flotation rate can be attributed to increasing collision efficiency.
According to Fig. 2b, Stokes attachment efficiency was calculated for different particle sizes using Eqs. (6,7). Minimum attachment efficiency obtained was 1.9% with particle size of -106+75 µm, Sb of 10.21 1/sec and
flotation rate of 0.41 1/min and maximum attachment
efficiency obtained was 55.9% with particle size of -37 µm, Sb of 34.2 1/s and flotation rate of 1.65 1/min. Stokes
attachment efficiency was less than Yoon efficiency.
Fig. 2. Attachment efficiency under Yoon, Stokes and Potential flow conditions (particle density of 2.65 g/cm3 and contact angle of 89.70)
According to Fig. 2c, Potential attachment efficiency was calculated for different particle sizes using Eqs. (6,8). Maximum attachment efficiency obtained was 15.5% with particle size of -37 µm, Sb of 34.2 1/s and flotation rate of
1.65 1/min. Attachment efficiency calculated by Potential flow conditions was very lower than both Yoon and Stokes attachment efficiencies. So, Potential efficiency was not a suitable equation for predicting attachment efficiency under conditions of this research (laboratory mechanical flotation cells). Stokes attachment efficiency was between Yoon and Potential attachment efficiency.
4.5. Primary Predicting of Bubble- Particle Attachment Efficiency Using k-Sb Relationship
Three different models were obtained for estimating attachment efficiency using k-Sbrelationship. All of four
particle size classes (-37, -53+37, -75+53 and -106+75 µm)
k
(
1
/m
in
)
Sb (1/s) -37 Micron
Actual
Predict
k
(
1
/m
in
)
Sb (1/s) -53+37 Micron
Actual
k
(
1
/m
in
)
Sb (1/s) -75+53 Micron
Actual
k
(
1
/m
in
)
Sb (1/s) -106+75 Micron
were used for this purpose. Different forms of multiple regression models (exponential, linear, polynomial and power) were examined by comparing their statistical significance using coefficient of multiple determinations (R2)and following models were obtained for
s / 1 2 . 34 S 21 .
10 < b< and 0.32<k<1.891/min . So, following equations explain influence of Yoon (Ea−Y), Stokes (Ea−S) and Potential (Ea−P) attachment efficiency onk-Sbrelationship
for different particle size fractions. N is data numbers of the each model. The effect of k-Sbrelationship on attachment
efficiency has been illustrated in Fig. 3.
Fig. 3. Predicting bubble-particle attachment using k-Sb relationship (particle density of 2.65 3
cm /
g and particle size of <106 micro meters)
Fig. 4. Compares bubble-particle attachment calculated using different equations. According to Figs. (4a, 4b), for particle size of -37 and -53+37 µm, below equations can be useful for estimating Yoon, Stokes and Potential attachment efficiency and equivalent plots are compatible together.
According to Figs. (4c, 4d), for particle size of -75+53 and -106+75 µm, following equations are not suitable for predicting attachment efficiency because the equivalent plots are not compatible together. It can be attributed to high efficiency of bubble-particle collision and detachment. Bubble-particle collision and detachment efficiency of coarse particles are effective on the flotation rate too. So, below
equations can be used only for small particles (<53µm).
137 . 0
b 632 . 1 i 4 Y
a )
S k ( t 10 76 . 7
E− = × − − − (16)
145 . 0
b 488 . 1 i 4 S
a )
S k ( t 10 59 . 10
E− = × − − − (17)
026 . 0
b 336 . 2 i 4 P
a )
S k ( t 10 013 . 0
E− = × − − − (18)
5. Conclusions
In this research, the effect ofk-Sbrelationship on
bubble-particle attachment efficiency was investigated under Yoon, Stokes and Potential conditions and following conclusions were illustrated:
Attachment efficiency calculated under Yoon conditions was more than Stokes and Potential efficiency. Maximum Stokes attachment efficiency obtained was 55.9% with particle size of -37 µm, Sb of 34.2 1/s and flotation rate of
1.65 1/min. Maximum Potential attachment efficiency obtained was 15.5% with particle size of -37 µm, Sb of 34.2
1/s and flotation rate of 1.65 1/min. Attachment efficiency calculated by Potential flow conditions was very lower than both Yoon and Stokes attachment efficiency. Also, three different models were obtained for estimating attachment efficiency using k-Sb relationship.
Nomenclature
Impeller speed
N
Unit cell cross sectional area
A
Impeller peripheral speed
s
N
Concentration
C
Pulp density
d
P Critical
coalescence concentration
CCC
Air flow rate Q
Bubble diameter b
d
Bubble Reynolds number
b
Re
Particle size
p
d
Recovery
R
Attachment efficiency
a
E
Infinite recovery
∞
R
Acceleration due to gravity
g
Bubble surface area flux
b
S
Superficial gas velocity
g
J
Induction time
i
t
Flotation rateconstant k
Kinematic viscosity
ν
Collision efficiency
c
E
Energy dissipation
ε
Collection efficiency col
E
Contact angle
θ
Detachment efficiency
d
E
References
[1] A.V. Nguyen, J. Ralston, H.J. Schulze, On modeling of bubble–particle attachment probability in flotation, Miner Eng, 53 (1998) 225-249.
[2] W.J. Trahar, The selective flotation of galena from sphalerite with special reference to the effects of particle size, Int J Miner Process, 3 (1976) 151-166.
[3] B.A. Wills, Mineral Processing Technology, 4th edn.Pergamon, New York, (1998).
[4] A.M. Gaudin, J.O. Groh, H.B. Henderson, Effect of particle size on flotation, American Institute of Mining and
Metallurgical Engineering, Tech Publ, 414 (1931) 3-23. [5] R.M. Anthony, D.F. Kelsall, W.J. Trahar, The effect of particle
size on the activation and flotation of sphalerite, Proceedings of the Australian Institute of Mining and Metallurgy, 254 (1975) 47-58.
[6] W.J. Trahar, A rational interpretation of the role of particle size in flotation, Int J Miner Process, 8 (1981) 289-327.
[7] H.R. Spedden, W.S. Hannan, Attachment of Mineral Particles to Air Bubbles in Flotation, Min Tech, 12 (1984) 2354. [8] P.F. Whelan, D.S. Brown, Particle-Bubble Attachment in Froth
Flotation, Transactions of the Institute of Mining and Metallurgy, 65 (1956) 181-192.
[9] T.M. Morris, Measurement of Equilibrium Forces between an Air Bubble and an Attached Solid in Water, Trans. AIME 187 (1950) 91-95.
[10] H.J. Schulze, New Theoretical and experimental investigations on stability of bubble-particle aggregates in flotation: A theory on the upper particle size of floatability, Int J Miner Process, 4 (1977) 241-259.
[11] D.A. Deglon, F. Sawyerr, C.T. O’Connor, A model to relate the flotation rate constant and the bubble surface area flux in mechanical flotation cells, Miner Eng, 12 (1999) 599-608. [12] Shahbazi, B., Rezai, B. and Koleini, S.M. Javad, Noaparast M.
(2013) Iran. J. Chem. Chem. Eng., 32: 109-118.
[13] Shahbazi, B., Rezai, B. and Koleini, S.M. Javad, Noaparast M. (2014) Geosciences ScientificQuarterlyJournal, in press. [14] Shahbazi, B., Rezai, B. (2014) Journal of Dispersion Science
and Technology, in press.
[15] S. Chehreh Chelgani, B. Shahbazi, B. Rezai, Estimation of froth flotation recovery and collision probability based on operational parameters using an artificial neural network, Int J Min Met Mater, 17 (2010) 526-534.
[16] B. Shahbazi, B. Rezai, S.M. Javad Koleini, Bubble–particle collision and attachment probability on fine particles flotation, ChemEng Process, 49 (2010) 622–627.
[17] B. Shahbazi, B. Rezai, S.M. Javad Koleini, The effect of hydrodynamic parameters on probability of bubble-particle collision and attachment, Miner Eng, 22 (2009) 57–63. [18] B. Shahbazi, B. Rezai, S.M. Javad Koleini, Effect of
Dimensionless Hydrodynamic Parameters on Coarse Particles Flotation, Asian J Chem, 3 (2008) 2180-2188.
[19] B.K. Gorain, J.P. Franzidis, E.V. Manlapig, Studies on impeller type, impeller speed andair flow rate in an industrial scale flotation cell. Part 1: Effect on bubble size distribution,Miner Eng, 8 (1995a) 615-635.
[20] B.K. Gorain, J.P. Franzidis, E.V. Manlapig, Studies on impeller type, impeller speed andair flow rate in an industrial scale flotation cell. Part 2: Effect on gas holdup, Miner Eng, 8 (1995b) 1557-1570.
[22] B.K. Gorain, J.P. Franzidis, E.V. Manlapig, The effect of gas dispersion properties on thekinetics of flotation, Column 96, Proceedings of the 35th Annual Conference of Metallurgists,CIM, Montreal, Canada, (1996b) 299-313. [23] B.K. Gorain, J.P. Franzidis, E.V. Manlapig, Studies on
impeller type, impeller speed and airflow rate in an industrial scale flotation cell. Part 4: Effect of bubble surface area flux on flotationkinetics, Miner Eng, 10 (1997) 367-379.
[24] B.K. Gorain, N. Munn, J.P. Franzidis, E.V. Manlapig, Studies on impeller type,impeller speed and air flow rate in an industrial scale flotation cell. Part 5: Validation of k-Sbrelationship and effect of froth depth, Miner Eng, 11 (1998) 615-626.
[25] E.H. Girgin, S. Do, C.O. Gomez, J.A. Finch, Bubble size as a function of impeller 339 speed in a self-aeration laboratory flotation cell, Miner Eng, 19 (2006) 201–203.
[26] G.J. Jameson, S. Nam, M.M. Young, Physical factors affecting recovery rates in flotation, Min SciEng, 9 (1977) 103-118. [27] H.J. Schulze, Hydrodynamics of bubble-mineral particle
collisions, Min Process Extractive Metall, 5 (1989) 43-76.
[28] Z. Dai, D. Fornasiero, J. Ralston, Particle-bubble collision models-a review, Adv Colloid Interfac, 85 (2000) 231-256. [29] R.H. Yoon, The role of hydrodynamic and surface forces in
bubble-particle interaction,Int J Miner Process, 58 (2000) 129-143.
[30] R.T. Rodrigues, J. Rubio, new basis for measuring the size distribution of bubbles, Miner Eng, 16 (2003) 757-765. [31] S.S. Dukhin, R. Miller, G. Loglio, Physico-chemical
hydrodynamics of rising bubble, Drops and Bubbles in Interfacial Research D. Mobius and R. Miller (Editors), Elsevier Science B.V. All rights reserved, 1998.
[32] H.J. Schulze, Physico-Chemical Elementary Processes in Flotation-An Analysis from the Point of View of Colloid Science Including Processes Engineering Considerations, Dev. Int J Miner Process 4 (Fuerstenau, D.W., Advisory Ed.), Elsevier, Amsterdam, 1984.
[33] P.T.L. Koh, M.P. Schwarz, CFD modelling of bubble-particle attachments in flotation cells, Miner Eng, 19 (2006) 619-626. [34] Z. Dai, D. Fornasiero, J. Ralston, Particle-bubble attachment