VOLUME 17 ISSUE 1 (2019), Page 319 – 327
MEASURING TECHNICAL EFFICIENCY OF MALAYSIAN REAL ESTATE INVESTMENT TRUSTS: A DATA ENVELOPMENT
ANALYSIS APPROACH
Nor Nazihah Chuweni1 & Chris Eves2
1Faculty of Architecture, Planning and Surveying
UNIVERSITI TEKNOLOGI MARA (PERAK), MALAYSIA
2QUEENSLAND UNIVERSITY OF TECHNOLOGY, AUSTRALIA
Abstract
The research examines the technical efficiency (TE) and economies of scale for the Malaysian Real Estate Investment Trust (M-REITs) from 2010 to 2014, using a parametric approach of Data Envelopment Analysis (DEA). The non-parametric approach of Variable Return to Scale DEA (VRS-DEA model) was used to estimate the efficiency scores for M-REITs. The negative inefficient value for the technical inefficiencies is identified as a result of both poor input utilisation (managerial inefficiency) and failure of M-REITs to operate at optimum scale (scale inefficiency). The mean technical efficiency (TE) measures ranged from as low as 41.70% in 2011 to as high as 84.30% in 2014. Despite having the Sharia requirement, Islamic REITs in Malaysia provide an effective investment opportunity evidenced by the higher scores for all efficiency measures, as compared to conventional REITs for the period under study. Pure technical inefficiency has a greater deviation in the efficient frontier than scale inefficiency, suggesting that M-REITs inputs are not fully minimised to produce more outputs. With regard to scale inefficiency, M-REITs are operating at economies of scale, indicating the importance of expansion or growth to improve on efficiency performance. This will then allow M-REIT managers to formulate better strategic investment decisions.
INTRODUCTION
Real estate investment trust (REIT) managers need to evaluate the performance of their REITs in order to survive and stay competitive in the global market. Therefore, many real estate researchers have tried to measure the performance of these REITs using a variety of measurement methods. Previous studies in real estate performance measurement focus on conventional methods such as the mean-variance portfolio theory of Markowitz (Markowitz, 1952, 1959, 1991), Sharpe ratio (Sharpe, 1966), Treynor ratio (Treynor, 1965) and Jensen’s alpha ratio (Jensen, 1968) with limited studies focused on methods for modern performance measurements such as efficiency and productivity.
The REIT efficiency measurement has become the main concern in the investment portfolios of developed countries. However, limited studies have been conducted to measure the REIT efficiency of emerging markets such as Malaysia. This paper, therefore, intends to address this gap by measuring Malaysian REITs (M-REITs) efficiency, post Global Financial Crisis (GFC) using the non-parametric approach of Data Envelopment Analysis (DEA). The efficiency measurement benchmarks an REIT performance against its peers, which allows the REIT manager to identify the sources of inefficiency and the best practice operation to be adopted. For instance, if scale is found to be the source of inefficiency, scale efficiency scores measured by DEA will provide information for the REIT managers as to whether an REIT is operating at increasing return to scale (IRS) or decreasing return to scale (DRS). REIT managers will then use this information to formulate a strategy to ensure that REITs operate at the optimum size or the most productive scale size. The results of the efficiency scores can also be used by REIT investors to benchmark and identify potential investment prior to investment portfolio construction.
LITERATURE REVIEW
Efficiency could be defined as “using a specific quantity of resources to get the largest possible output at the lowest possible price” (Lindeman, 2002, p.85). Therefore, efficiency needs to be addressed to avoid the wastage of resources or factors of production, in order to achieve the optimum production. The efficiency scores determine the efficiency of the REITs, as the greater the efficiency scores, the more efficient the REITs are. These efficient REIT can produce more output, given the same level of inputs.
REITs as general and administrative expense and management fee. Similarly, Sham, Sing, and Tsai (2009) used the semi-log quadratic models where the Asian REITs show significant economies of scale in all expenses, except property management fees. REIT managers, therefore, need to emphasise these operational expenses for greater efficiency. Topuz (2002) used both the parametric approach of Stochastic Frontier Analysis and the non-parametric approach of Data Envelopment Analysis (DEA) to measure the allocative and technical efficiency of US REIT. They found that the US REIT industry on average has low efficiency scores. Similar results are produced using the non-parametric approach of DEA where most US REITs are found technically inefficient, due to scale inefficiencies and poor REIT input utilisation (Anderson & Springer, 2003; Anderson, Fok, Springer, & Webb, 2002; Topuz, Darrat &Shelor, 2005).
The non-parametric approach of DEA is considered as a viable technique and is comparable with the conventional performance measurement, due to the fact that there is a highly correlated relationship between the DEA efficiency score with traditional REITs’ performance measures, such as in the Sharpe, Treynor, and Jensen index (Brockman, Mcleod, & Anderson, 2006). The results highlight the importance of being efficient, because efficiency will lead to an improvement in the profitability of a firm.
However, there are limited studies using the non-parametric approach of DEA to measure the efficiency performance for M-REITs. Chuweni and Eves (2016) measured technical, allocative and scale efficiency for Malaysian REITs for the period of 2013 to 2014. Their findings show low scores of cost efficiencies with negative inefficient value identified in the allocative inefficiencies, implying the input mix is not correctly utilised. Another study using the different efficiency formula of the ratio of property income to assets by Leong and Abdul Aziz (2015), reveals that Islamic REITs underperform the conventional REITs in terms of the efficiency ratio of assets generating property income.
The Malaysian REIT investors have questioned whether these Sharia requirements affect the performance of Islamic REIT as compared to the conventional REITs. Therefore, this study proposes a new approach to measuring the REIT performance, which incorporates the specific requirement of Islamic REITs into the measurement model. The remainder of the paper is structured as follows. The next section looks into data and research methodology. This is followed by section 3 with the results and discussion. Finally, section 4 concludes the article.
METHODOLOGY
data due to the entrance and exit factor of M-REITs in Bursa Malaysia, yielding 76 observations. Since the number of M-REITs differs from 2010-2014, the construction of separate frontiers are more appropriate to determine the efficient REIT for different years (Isik & Hassan, 2002). For instance, Al-Hadharah Boustead REIT is only included in the study for the years 2010 to 2012 as the REIT was delisted in February 2014. The stapled KLCC REIT, which was listed under the REIT section starting in May 2013, is only included in the study for 2013 to 2014. The number of M-REITs used in the study increased from 13 REITs in 2010 to 15 in 2011 and 16 REITs for 2012-2014.
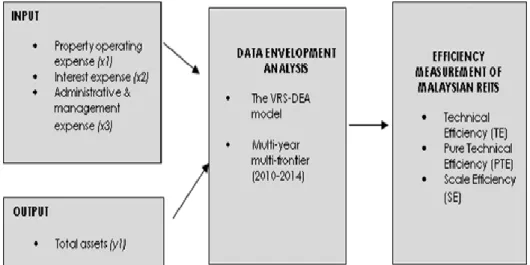
Data and empirical design
As illustrated in Figure 1, this study employed three input and one output variable. The three input vector variables used were x1: property operating expense (POE), x2: interest expense, x3: administrative & management expense, while the output variable was y1: total asset (Anderson & Springer, 2003; Lewis, Springer, & Anderson, 2003; Topuz, 2002; Topuz et al., 2005). The M-REIT efficiency scores were estimated in the form of technical, pure technical and scale efficiency. The efficiency scores, which are measured using the VRS-DEA model, range from 0 to 1, with 1 being the most efficient. We could also see an increase in standard deviation for the period of 2010 to 2014 due to the increase in the value for the input and output variables. The significant difference between the minimum and maximum value for input variables is likely due to the size of the REIT measured by the output.
RESULTS AND DISCUSSIONS
Before proceeding with the DEA result, as a general rule of thumb, the sample size must be at least three times the sum of the number of inputs and outputs (Avkiran, 2004; Coelli, Prasada Rao, O’Donnell, & Battese, 2005; Sufian, Kamarudin, & Mohd Noor, 2014). The selection of a sample size of 16 was more than three times the sum of input/output number (3[3 inputs + 1 output]). Therefore, the selection was considered valid and allows DEA to measure the efficiency scores in terms of technical, pure technical and scale efficiency scores of M-REITs for the period 2010-2014.
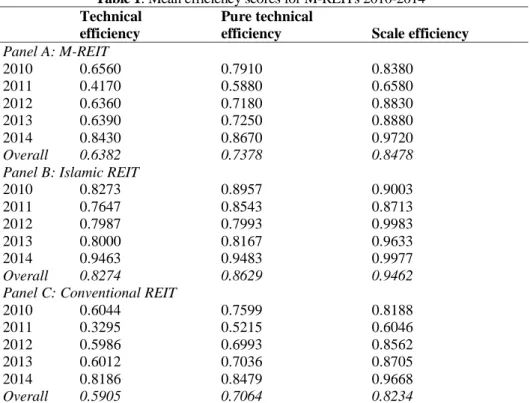
The DEA estimation revealed that the inefficiency sources are due to pure technical and scale inefficiencies. Table 1 presents mean scores of the various efficiency scores for M-REITs (Panel A), Islamic REITs (Panel B) and conventional REITs (Panel C). The various efficiency scores are M-REITs’ technical efficiency (TE), and its mutually exhaustive pure technical efficiency (PTE) and scale efficiency (SE) for the years 2010 to 2014. Results presented in Table 1 suggest that M-REITs’ mean technical efficiency scores were on a declining trend during 2010 and 2011, and increased between 2012 to 2014.
Table 1: Mean efficiency scores for M-REITs 2010-2014
Technical efficiency
Pure technical
efficiency Scale efficiency
Panel A: M-REIT
2010 0.6560 0.7910 0.8380
2011 0.4170 0.5880 0.6580
2012 0.6360 0.7180 0.8830
2013 0.6390 0.7250 0.8880
2014 0.8430 0.8670 0.9720
Overall 0.6382 0.7378 0.8478 Panel B: Islamic REIT
2010 0.8273 0.8957 0.9003
2011 0.7647 0.8543 0.8713
2012 0.7987 0.7993 0.9983
2013 0.8000 0.8167 0.9633
2014 0.9463 0.9483 0.9977
Overall 0.8274 0.8629 0.9462 Panel C: Conventional REIT
2010 0.6044 0.7599 0.8188
2011 0.3295 0.5215 0.6046
2012 0.5986 0.6993 0.8562
2013 0.6012 0.7036 0.8705
2014 0.8186 0.8479 0.9668
The mean TE measures range from a low of 41.70% in 2011 to 84.30% in 2014. In other words, on average, the input (REIT expenses) could be reduced by another 58.30% in 2011 and 15.70% in 2014 to produce the same level of outputs. The declining trends of REIT efficiency could be caused by the increase in operational expenses over time, leading to REIT operating inefficiency. A study by Anderson et al. (2002) showed a similar declining trend for USA REITs for the year 1992 to 1993 before the efficiency scores increased afterwards. Another key event that could contribute to higher efficiency scores for 2012 through 2014 was the listing of the stapled KLCC REIT under the REIT section. The listing of KLCC REIT leads to a substantial increase in REIT investment value, measured by the total asset, which is a proxy for REIT output. Therefore, the REIT managers should be more cautious in implementing mergers and acquisitions with other REITs to obtain efficiency gains.
The TE, PTE and SE scores indicate the degree of M-REIT technical inefficiency and are bounded between a minimum of 0 and a maximum of 1. The decomposition of technical efficiency into pure technical efficiency and scale efficiency allows the sources of inefficiencies to be identified. In this study, the pure technical inefficiency, due to poor input utilisation, contributed a greater deviation in the REIT efficient frontier than scale inefficiency. In other words, pure technical inefficiency has dominated scale inefficiency when SE scores are higher than PTE scores for all years. The mean PTE scores ranged from 58.80% in 2011 to 86.70% in 2014 while mean SE scores varied from 65.80% in 2011 to 97.20% in 2014. The result shows the efficiency gains could be achieved with better utilisation of REIT input than the economies of scales for 2010-2014.
Our results from Table 1 (Panel B) suggest that Islamic REITs exhibited mean overall efficiency scores of 0.8274 for technical efficiency, 23.69% higher than the conventional REITs. The average scores of technical efficiency for 2010-2014 of Islamic REITs suggest the mean input waste of 17.26%. In other words, Islamic REITs could have produced the same amount of outputs by only using 82.74% of the amount of input they currently used. Similar to the industry, our result suggests that the Islamic REITs’ inefficiency is mainly caused by pure technical inefficiency, rather than scale inefficiency.
Scale economies for M-REITs
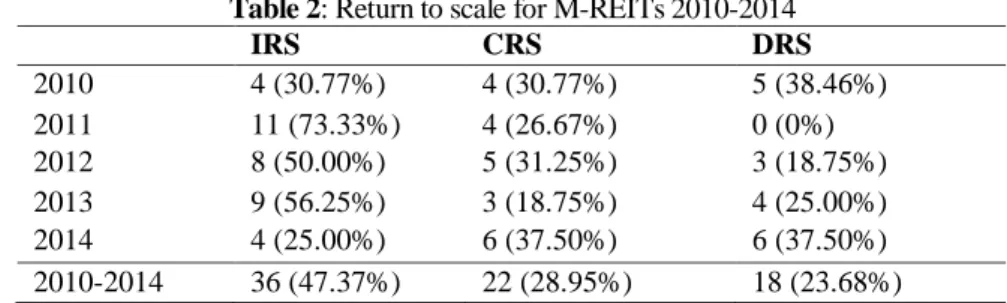
gains by increasing their scale of operations. In other words, these REITs could obtain benefits if they implemented growth and expansion strategies to become efficient. Similarly, as illustrated in Table 2, no M-REITs operated at DRS in 2011, with most operating at CRS and IRS. This was likely due to the recovering Malaysian economies, post financial crisis.
In essence, the sources of technical inefficiencies for M-REITs are due to the failure of M-REITs to operate at constant return to scale and managerial inefficiency in controlling costs. The Islamic REITs, on the other hand, exhibited a slightly higher mean for all efficiency scores for all years as compared to the conventional REITs, implying Sharia requirements of Islamic REITs do not hinder their investment potential.
Table 2: Return to scale for M-REITs 2010-2014
IRS CRS DRS
2010 4 (30.77%) 4 (30.77%) 5 (38.46%)
2011 11 (73.33%) 4 (26.67%) 0 (0%)
2012 8 (50.00%) 5 (31.25%) 3 (18.75%)
2013 9 (56.25%) 3 (18.75%) 4 (25.00%)
2014 4 (25.00%) 6 (37.50%) 6 (37.50%)
2010-2014 36 (47.37%) 22 (28.95%) 18 (23.68%)
Note: The percentage of total may not add up to 100% due to rounding; increasing return to scale (IRS), constant return to scale (CRS), and decreasing return to scale (DRS)
Source: Authors’ calculation and secondary data analysis (2018).
CONCLUSION
In measuring the TE, PTE, and SE for M-REITs 2010-2014 using the non-parametric approach of DEA, the inefficiencies are most likely caused by both poor utilisation of inputs (managerial inefficiency) and failure to operate at constant return to scale (scale inefficiency). Since managerial inefficiency has more deviations than the scale inefficiency in the M-REITs’ efficient frontier, efficiency gains could, therefore, be achieved with better utilisation of M-REIT input rather by than taking advantage of the economies of scale. In other words, M-REITs can improve efficiency through minimisation of resources such as interest expense, property operating expense, and administrative expenses. In terms of scale inefficiency, most REITs are operating at economies of scale suggesting they can improve efficiency through expansion and growth. The findings will enable the REIT managers to address these sources of inefficiencies and make necessary improvements.
of the input and output variables used in the efficiency measurement model, we pave the way for future research in the area of efficiency and productivity for the similar specific market of Sharia compliant investment or ethical investment. Our results suggest that regardless of the Sharia requirements, Islamic REITs in Malaysia provide an effective investment opportunity for the investors who seek higher profit by diversifying into Islamic REITs. This is evidenced by the higher scores for technical, pure technical and scale efficiency than conventional REITs for all years, implying the effective investment potential of Islamic REITs.
Investigating changes in productivity using the Malmquist Total Factor Productivity Index could identify the result of technical change or technological progress/regress for M-REIT 2010-2014. Further analysis in determining other key drivers of REIT characteristics, using the parametric approach, will enhance the robustness of the existing efficiency measurement model.
REFERENCES
Anderson, R. I., Fok, R., Springer, T.M., & Webb, J. (2002). Technical efficiency and economies of scale: A non-parametric analysis of REIT operating efficiency.
European Journal of Operational Research, 139(3), 598–612.
Anderson, R. I., & Springer, T. M. (2003). REIT selection and portfolio construction: Using operating efficiency as an indicator of performance. Journal of Real Estate Portfolio Management, 9(1), 17–28.
Avkiran, N. K. (2004). Decomposing technical efficiency and window analysis. Studies
in Economics and Finance, 22(1), 61–91.
Bers, M., & Springer, T.M. (1997). Economies-of-Scale for Real Estate Investment Trusts. Journal of Real Estate Research, 14(3), 275–291.
Bers, M., & Springer, T. M. (1998). Sources of scale economies for REITs. Real Estate Finance, 14(4), 47–56.
Brockman, C. M., Mcleod, R. W., & Anderson, R. I. (2006). A relative efficiency approach to modern performance measurement using data envelopment analysis.
Journal of Financial Education, 32, 23–44. Retrieved from http://www.jstor.org/stable/41948831
Chuweni, N. N., & Eves, C. (2016). Technical, allocative and scale efficiency of Malaysian REITs: The preliminary findings. In 22nd Pacific Rim Real Estate Society Conference. Sunshine Coast, Australia.
Coelli, T. J., Prasada Rao, D. S., O’Donnell, C. J., & Battese, G. E. (2005). An introduction to efficiency and productivity analysis (2nd ed). United States of America: Springer.
Farrell, M.(1957). The Measurement of Productive Efficiency. Journal of the Royal Statistical Society, 120(3), 253–290.
Isik, I., & Hassan, M. K. (2002). Technical, scale and allocative efficiencies of Turkish banking industry. Journal of Banking and Finance, 26(4), 719–766.
Jensen, M. C. (1968). The performance of mutual funds in the period 1945 - 1964. The
Journal of Finance, 23(2), 389–416.
Kuala Lumpur, Malaysia
Lewis, D., Springer, T. M., & Anderson, R. I. (2003). The Cost Efficiency of Real Estate
Investment Trusts: An Analysis with a Bayesian Frontier Model. Journal of Real
Estate Finance and Economics, 26(1), 65–80.
Lindeman, J. B. (2002). Microeconomics (2nd edn.). New York: Brron’s Educational
Series, Inc.
Markowitz, H. M. (1952). Portfolio selection. The Journal of Finance, 7(1), 77–91. Markowitz, H. M. (1959). Portfolio Selection: Efficient Diversification of Investments.
New York: Wiley.
Markowitz, H. M. (1991). Foundations of Portfolio Theory. Journal of Finance, 46(2), 469–477.
Sham, H. T., Sing, T. F., & Tsai, I.-C. (2009). Are there efficiency gains for larger Asian REITs? Journal of Financial Management of Property and Construction. 14(3), 231-247
Sharpe, W. F. (1966). Mutual fund performance. The Journal of Business, 39(1), 119– 138.
Sufian, F., Kamarudin, F., & Mohd Noor, N. H. H. (2014). Revenue efficiency and return to scale in Islamic Banks: Empirical evidence from Malaysia. Journal of Economic Cooperation and Development, 35(1), 47–80.
Topuz, J. C. (2002). Efficiency and Performance of Real Estate Investment Trusts: An Empirical Examination. College of Administration and Business. Ann Arbor: Lousiana Tech University,.
Topuz, J. C., Darrat, A. F., & Shelor, R. M. (2005). Technical, Allocative and Scale Efficiencies of REITs: An Empirical Inquiry. Journal of Business Finance & Accounting, 32(9 & 10), 1961–1994.
Treynor, J. (1965). How to rate management of investment funds. Harvard Business Review, 43(1), 63–75.