Predictive Analytics on Big Data - an Overview
Gayathri Nagarajan and Dhinesh Babu L.D
School of Information Technology and Engineering, Vellore Institute Of Technology, Vellore, India [email protected]
E-mail: [email protected]
Overview paper
Keywords:predictive analytics, big data, machine learning
Received:November 5, 2018
Big data generated in different domains and industries are voluminous and the velocity at which they are generated is pretty high. While research works carried out continuously to handle big data is at one end, processing it to develop the business insights is a hot topic to work on the other end. Though there are lot of technologies and tools developed to handle big data and extract insights from them, there are lot of challenges and open issues that are yet to be addressed. This paper presents an overview on predictive analytics with big data. The overview throws light on the core predictive models, challenges of these models on big data, research gaps in several domain sectors and using different techniques. This paper categorizes the major technical challenges of predictive analytics on big data under six headings. The paper concludes with the identification of open issues and future directions to work on for researchers in this field.
Povzetek: Pregledni ˇclanek opisuje prediktivno analitiko na velikih podatkih.
1
Introduction
Research focus on predictive analytics for big data has gained significance because of its scope in various do-mains and industries. It has stepped into every field includ-ing health care, telecommunication, education, marketinclud-ing, business, etc. Predictive analytics is a common diction that often means predicting the outcome of a particular event. The main idea behind prediction is to take certain input data, apply statistical techniques and predict the outcome of an event. The terminology ‘predictive analytics’ is syn-onymous with other terminologies like ‘machine learning’, ‘data mining’, ‘business intelligence’ and recently the other terminology which is in common use today ‘data science’. Though they seem to be synonymous there is a narrow line that distinguishes their context of use.
The technique of business understanding, data under-standing, data integration, data preparation, building a model to extract hidden insights, evaluating the model and finally deploying the model is called ‘Data mining’. The model may be predictive or may not be. [1]. In some cases it may be descriptive whereas ‘predictive analytics’ in most cases mean to predict the value of certain output vari-able from input varivari-ables. ‘Machine learning’ is basically a technique whereas ‘predictive analytics’ is an application of machine learning. ‘Machine learning’ is used to discover hidden patterns in data by using some of their techniques like classification, association or clustering in training the machine. ‘Machine learning’ is one disciplinary of ‘data mining’ which is multidisciplinary that includes other
dis-ciplines like statistics, BI tools, etc. ‘Data science’ can be considered as an application of statistical methods to busi-ness problems. Predictive analytics is more narrowly fo-cused than data science. Data science uses data program-ming whereas predictive analytics uses modeling. Predic-tive analytics in most of the cases is probabilistic in nature whereas data science involves exploration of data. Data scientists require both domain knowledge and the knowl-edge in technology. Business intelligence provides stan-dard business reports, ad hoc reports on past data based on OLAP and looks at the static part of the data. Predic-tive analytics requires statistical analysis, forecasting, and causal analysis, text mining and related techniques to meet the need of forward looking business [1].
mo-tivation behind this work is the fact that many papers in this field are more focused on a particular domain or tech-nique but there is a lack of papers that presents a broader overview of predictive analytics in big data to help the bud-ding researchers identify research problems. Hence we fo-cussed on a comprehensive overview on predictive analyt-ics.
This paper is organized into 7 sections. Core predictive models with their strengths, weaknesses along with few so-lutions are discussed in Section 2, the challenges of core predictive models on big data is discussed in Section 3, scope of predictive analytics on big data generated across different domain sectors along with few research gaps is discussed in Section 4 and the comprehensive challenges for predictive analytics on big data and the techniques used to overcome them is discussed in Section 5, the future di-rections for research are summarized in Section 6 and Sec-tion 7 winds up with conclusion.
2
Core predictive models
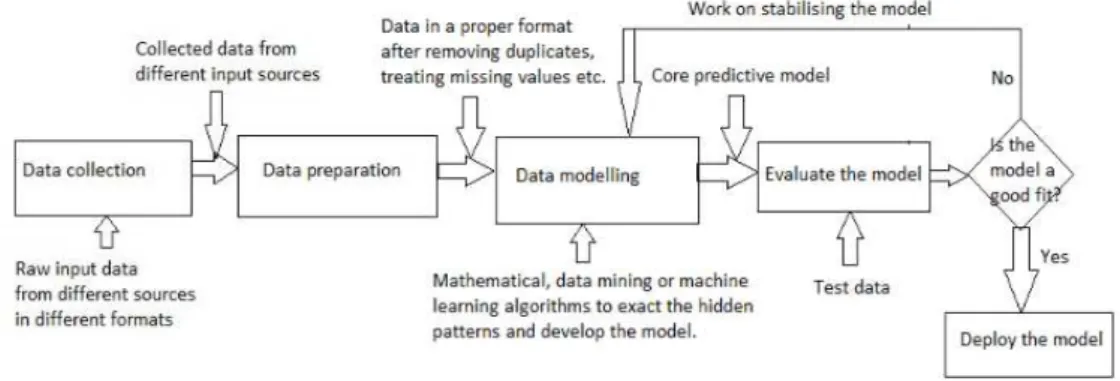
The major processes of predictive analytics include de-scriptive analysis on data that constitutes around 50% of the work, data preparation(like detecting outliers) that stitutes around 40% of the work, data modeling that con-stitutes around 4% of the work and evaluating the model that constitutes around 6% of the work [98]. Only a frac-tion of raw data is considered for building the model which is assessed and tested [7]. The phases involved in building predictive models is shown in figure 1. Initially predictive analytics was carried out using many mathematical statis-tical approaches. Later data mining, machine learning be-gan its era in predictive analytics since they proved to be effective. This section discusses few core predictive mod-els to make the reader understand the concept of predic-tive analytics. Different models are used for different types of predictive tasks such as estimating an unknown value, classification(supervised learning to predict the class label of the instance), clustering(unsupervised learning to group similar patterns together) etc. The section is branched into three subsections - the predictive models based on math-ematical(statistical) approaches, the models based on data mining approaches and the models based on machine learn-ing approaches respectively. Yet, there is a very narrow line of separation among the subsections and they overlap in certain predictive tasks. Figure 2 shows the classification of core predictive models.
2.1
Predictive models based on mathematics
Mathematical techniques especially statistics is used for predictive tasks. Despite, data mining algorithms and ma-chine learning algorithms also use math as their base for predictive tasks. Major core predictive models based on mathematics include Extrapolation, Regression, Bayesian statistics that are described in detail.
2.1.1 Extrapolation
Extrapolation is a method of extending the value of a vari-able beyond the original observation range. For example, the details of the road condition are known to a driver un-til a certain point and he is expected to predict the road condition beyond that point. A tangent line is drawn by re-lating the input variable to the output variable. The line is extended further to predict the output for different values of input. The line determines whether the extrapolation is linear, quadratic or cubic etc.
Strength and weakness :
Extrapolation suits well for such tasks where the target variable is in close relationship with the predictor variables. The results of extrapolation are also accurate in certain ex-periments where the relationships among the variables are simple [101].
The major problem with extrapolation is the interpreta-tion of results. There are many studies where the study pop-ulation differs widely from the target poppop-ulation.[100] is an example of such problem where the extrapolation of the ex-perimental results on sheep cannot be justified for other tar-get population. In such studies, the claims of the study re-sults cannot be applied or justified to the target population [99]. Few solutions proposed to solve the interpretation problem of extrapolation is simple induction, randomized trails and expertise, Mechanistic reason etc. Population modeling is also proposed to solve the extrapolation prob-lem [102]. But these solutions can help only to a certain extent. Secondly, it is hard to model the past with extrapo-lation. Sometimes several extrapolation methods are com-bined to model. Moreover, extrapolation cannot be used to model the tasks with non linear patterns [103].
2.1.2 Regression
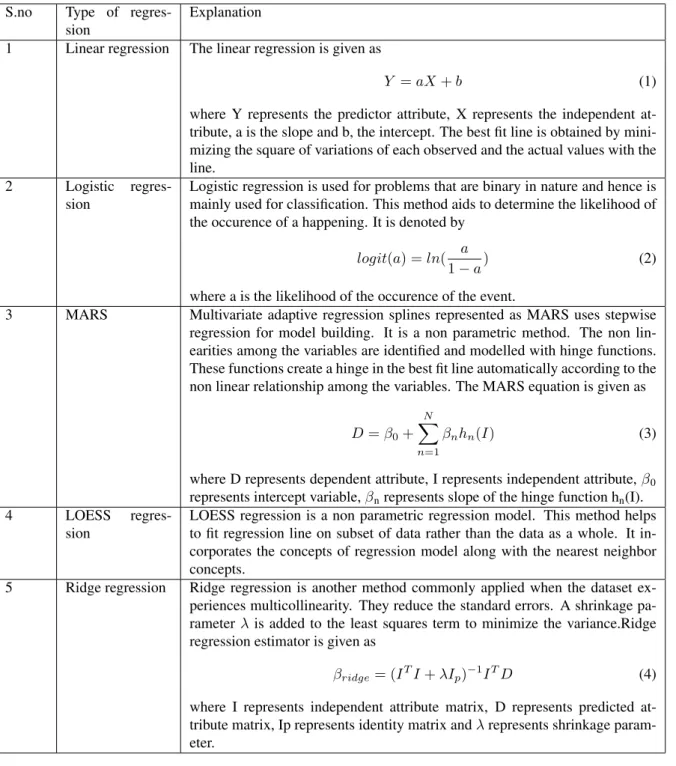
Regression models are used for supervised learning prob-lems in predictive analytics. It works by establishing a mathematical relation of the input variables with the output variable. There are different types of regression models like linear regression model, multi variate regression model, lo-gistic regression model, time series regression model, sur-vival analysis, etc. depending on the nature of the relation-ship discovered among the variables. Though the term is synonymous with extrapolation, there is a difference. Re-gression explains the variations in the dependent attribute with respect to the variations in the predictor attributes. Also, regression doesn‘t use the value of the input variables outside the range to establish the relationship with the de-pendent variable as in the case of extrapolation. There are different variants of regression depending on the nature of the variables as shown in table 1.
Strength and weakness:
Figure 1: Phases involved in building a core predictive model
Figure 2: Classification of core predictive models
non parametric and non linear methodology has to be used, MARS regression can be considered as it does not assume any functional relationship between the dependent and in-dependent variables [114],[117]. The biggest strength of MARS is that it is simple to understand and easy to in-terpret. Despite, it does not require any data preparation [116]. Moreover it is suitable for problems with higher input dimensions due to its ’divide and conquer’ strategy of working principle [117]. To model complex processes, in which no theoretical models exist, LOESS regression is preferred as it does not require a function to fit a model to all data in the sample [121]. The major strength of LOESS regression is its flexibility. The flexibility is controlled by a smoothing parameter [119]. It is usually set between 0.25 and 0.5 [120]. For predictive tasks, where the number of predictors is more, regularization methods such as ridge re-gression is preferred as it avoids overfitting [122]. It also handles multicollinearity effectively [126].
The major weakness of linear regression is that it consid-ers the mean of dependent variable and hence is sensitive to outliers. It is also more suited only to applications in which the predictor variables are independent [104]. For example, [105] states the reasons for moving to machine learning predictive models from simple regression models for predictive tasks in medicine. Though the regression models are simple and robust, they are limited to a small
inter-S.no Type of regres-sion
Explanation
1 Linear regression The linear regression is given as
Y =aX+b (1)
where Y represents the predictor attribute, X represents the independent at-tribute, a is the slope and b, the intercept. The best fit line is obtained by mini-mizing the square of variations of each observed and the actual values with the line.
2 Logistic regres-sion
Logistic regression is used for problems that are binary in nature and hence is mainly used for classification. This method aids to determine the likelihood of the occurence of a happening. It is denoted by
logit(a) =ln( a
1−a) (2)
where a is the likelihood of the occurence of the event.
3 MARS Multivariate adaptive regression splines represented as MARS uses stepwise regression for model building. It is a non parametric method. The non lin-earities among the variables are identified and modelled with hinge functions. These functions create a hinge in the best fit line automatically according to the non linear relationship among the variables. The MARS equation is given as
D=β0+
N X
n=1
βnhn(I) (3)
where D represents dependent attribute, I represents independent attribute,β0 represents intercept variable,βnrepresents slope of the hinge function hn(I).
4 LOESS
regres-sion
LOESS regression is a non parametric regression model. This method helps to fit regression line on subset of data rather than the data as a whole. It in-corporates the concepts of regression model along with the nearest neighbor concepts.
5 Ridge regression Ridge regression is another method commonly applied when the dataset ex-periences multicollinearity. They reduce the standard errors. A shrinkage pa-rameterλis added to the least squares term to minimize the variance.Ridge regression estimator is given as
βridge= (ITI+λIp)−1ITD (4)
where I represents independent attribute matrix, D represents predicted at-tribute matrix, Ip represents identity matrix andλrepresents shrinkage param-eter.
Table 1: Different types of regression
pretability problem of ridge regression as it sets the coeffi-cients of unimportant parameters to zero [127].
2.1.3 Bayesian statistics
Bayesian statistics predicts the likelihood of events occur-ring in the future. It works in the same way like normal probability but uses the input from experimentation and re-search to adjust the beliefs. For example, the probability of a six occurring in a die thrown six times is 1/6. But Bayesian statistics starts with the initial value of 16.6% and then adjusts the belief based on the experimentation.
If the die is showing 6 more than the expected number of times during experimentation, the value of this belief is in-creased accordingly. Hence the likelihood of 6 turning in a die thrown 6 times will increase or decrease depending on the outcomes in the experimentation.
Strength and weakness:
in stock market analysis [130].
The major weakness of bayesian approaches lies in de-termining the prior distributions. Bayesian approaches are also computationally expensive [130]. Use of frequencies instead of probabilities can help in improving bayesian rea-soning [131].
2.2
Predictive models based on data mining
The process of extracting hidden patterns from the given in-put is called data mining. It is basically mining knowledge from the data. Three major approaches for data mining in-clude Classification, Clustering and Association. Machine learning algorithms are widely used to execute the task.
2.2.1 Classification
The method of determining the class to which a particular data given as input belongs to is called classification. It is a supervised machine learning technique with labelled in-put data. Classification can be used in predictive analytics. There are lots of algorithms under classification technique but few basic algorithms are described in detail in this sub-section.
1. Naive Bayes: Naive Bayes is a statistical modeling ap-proach with two assumptions —all the attributes are equally important, all the attributes are statistically in-dependent. It is a probabilistic approach which works on the following Bayes theorem.
P[M/N] = P[N/M]P[M]
P[N] (5)
Strength and weakness:
The main strength of naive bayes is its simplicity. In-spite of the fact that its accuracy is less, it is found to perform better due to its simplicity in tasks such as document classification where merely classification is important. Naive bayes is computationally efficient since the contribution of each variable is equal and independent [134]. Moreeover only few parameters need to be calculated in naive bayes due to its condi-tional independence assumption. Hence it suits well for tasks where the training data is less [135]. The major weakness of naive bayes approach is its conditional independence assumption that often does not hold for real world applications [132]. This weak-ness is overcome to a certain extent by weighting at-tributes. Naive bayes with attribute weighting is found to perform better than random forest and logistic re-gression in [136],[137]. Accuracy and speed of classi-fication is also less when compared with other classifi-cation approaches. Effective negation and feature se-lection techniques such as mutual information in com-bination with naive bayes is found to improve the ac-curacy and speed to a certain extent[133]. An another
problem with naive bayes is that though they are good classifiers, they are not good estimators as discussed earlier. Hence it does not perform well in the tasks where probability value is important [138] and certain improvements to naive bayes is proposed to improve the probability estimation [139]. Moreover when the test data differs widely from the training data naive bayes fails to perform well unless smoothing tech-niques such as laplace estimation is used [138].
2. Decision trees: Decision tree is constructing a tree based structure for classification. Each node involves testing a particular attribute and the leaves are as-signed classification labels based on the values at each node. Decision trees use divide and conquer approach and the attributes can also be selected with heuristic knowledge for the nodes of decision trees though few measurements like entropy and information gain are used in selecting the attributes. Decision trees can be converted to rules also. Many variations of decision trees have evolved and one of them is random forest which is commonly used bagging method in recent re-search problems. The leaf nodes of the decision trees are called decision nodes. Entropy is the amount of randomness in the data. Information gain is the in-formation obtained that helps for accurate prediction. Entropy is given by
E(X) =−
n X
i=1
(PilogPi) (6)
where Pi is the probability of occurence of value i when there are n different values.
Information gain is a purity measure given by
IG(X, a) =E(X)−E(X|A) (7)
The value represents the information gained by split-ting the tree with that particular attribute. The attribute with less entropy or more information gain at every stage is considered the best split and the process is repeated until the tree converges. There are many de-cision tree algorithms but few variants are shown in table 2.
Strength and weakness:
S.no Type of decision tree Description
1 ID3 Iterative dichotomiser is the basic non incremental algorithm used for construction of decision tree. It uses information gain measure to select the best split at each node. But the major disadvantage of ID3 is that it may overfit the training data and may not result in optimal solution. 2 C4.5 C4.5 is an improved version of ID3 algorithm. It solves the overfitting
problem of ID3 by pruning the tree. C4.5 handles both continuous and discrete attributes and is capable of handling missing values too. 3 C5.0 C5.0 is an improved version of C4.5 in terms of performance and
mem-ory efficiency. It supports boosting technique to improve accuracy. C5.0 constructs smaller decision trees by removing unhelpful attributes with-out compromising on accuracy.
4 Decision stumps It is a single level decision tree and finds its use along with machine learning techniques like bagging and boosting as weak learners. 5 CHAID Chi square automatic interaction detector is used to find the
relation-ship between categorical dependent variable and categorical indepen-dent variables. It uses chi square test of independence to test the inde-pendency between two categorical variables. CHAID can be extended for continuous variables too.
Table 2: Different types of decision trees
The major problem with decision trees is overfitting or underfitting [144]. Techniques such as pruning [146],[147] or feature selection methods are required to avoid overfitting problem and also to reduce the computational complexity of the model [147]. Deci-sion trees does not suit well for imbalanced datasets though ensemble techniques can help [145]. Moover, though random forest yields more accurate re-sults, they are black box classifiers as the split rules are unknown [141].
3. KNN: Another classification technique that is of wide use is KNN yet with its own challenges. This tech-nique works on the idea that the input data to be clas-sified depends on the class of its neighbors. The value of ‘K’ determines the effectiveness of the algorithm. ‘K’ represents the number of neighbors to be consid-ered. The input data is assigned to the class to which most of its neighbors belong to. A distance metric from the input data to the ‘K ’ neighbors is calculated. Euclidean distance is usually deployed to calculate the distance. Other distance metrics like mahanalobis and manhattan distance measures can also be used instead of euclidean. The accuracy of the algorithm lies in the choice of K. Lower value of K might result in over-fitting and higher value for K might result in a more generalized model difficult to predict.
Strength and weakness:
The biggest advantage of KNN is its simplicity [150]. It does not require any prior knowledge about the dis-tribution of data [149]. This non parametric nature of KNN makes it effective for real world problems [151]. The major issue with KNN is the choice of parameter k and distance metric [150],[152],[153] and few works
are proposed to determine the value of k [157],[158] etc. Computational complexity is another issue with KNN. Techniques such as clustering are used along with KNN [148] to reduce the computational com-plexity. KNN is also affected by irrelevant features [150] and is sensitive to outliers [152],[153]. The outlier problem can be avoided to a certain extent by choosing a reasonable value for k rather than a small k [154]. Few methods or improvements such as lo-cal mean based KNN [155] and distance weight KNN [156] are proposed to overcome the negative effect of outliers in KNN.
4. Support vector machines: This classification tech-nique yields better accuracy in classification prob-lems. SVM works on the basis of hyperplane. The idea behind this technique is to find the best hyper-plane that can classify the two classes more accurately. This technique is best suited for both linear and non-linear separation problems. Non-non-linear problems can be handled using kernel functions that does data trans-formations to find the best hyperplane classifying the data more accurately. This algorithm works under the concept of margin. The distance between the hyper-plane and the closest object in each class is calculated. The hyperplane with maximum margin with the class objects is the best classifier since it can predict the class more accurately. Each input data is assigned a point in n-dimensional space.
Strength and weakness:
is also known for its generalization capability and the generalization error is less in SVM [163] [164]. This advantage of SVM helps it to model complex prob-lems even when the training data is less [166]. More-over, there is no need for feature extraction process in SVM as the kernel function can be directly applied on the data [164]. SVM also avoids overfitting [165], [166].
The major weakness of SVM lies in its parameter set-tings. Proper setting of kernel parameters determine the accuracy of SVM. Certain optimization techniques such as PSO [159] and GA [160] are used to optimize the parameters of SVM. Methods such as double lin-ear and grid slin-earch are also used to determine the pa-rameter values of SVM [162].
2.2.2 Clustering
The technique of identifying similar patterns in the input data and grouping the input data with similar patterns to-gether is called clustering. Clustering helps in predictive analytics. An example of clustering algorithm includes segmenting customers based on their buying behavior pat-tern thereby helping to predict the insights in the business and improve the sales accordingly. Clustering the scan im-ages in health care helps to predict whether the person is af-fected by a specific disease or not. Though there are many clustering algorithms, the three basic algorithms include k-means, hierarchical and density clustering and a summary of the same is provided in the following subsection. A re-view of clustering with its scope, motivation, techniques and applications are explained in [2].
1. K-means clustering: K-means clustering chooses K random centroids and measures the distance of each input data point with the centroids. The most com-monly used distance measurement metric is Euclidean distance. The input data points within the specific dis-tance from the centroid are grouped together as a clus-ter and hence arrived at few clusclus-ters. The average of the distance of all the points from the centroid inside a cluster is calculated and the centroid is recalculated accordingly. The input data points belonging to the cluster changes again. This process continues until the centroids are fixed. Another variation of partition clustering is K-mediods where the centroid itself is an input data point. K-median and K-mode algorithms are also partition based clustering algorithms that uses median and mode instead of mean. There are sev-eral metrics to measure the performance of clustering. One among them is the distance metric. Single link-age is the nearest neighbor clustering where the mini-mum distance between the data points of two different clusters is calculated. Complete linkage is the farthest clustering where the maximum distance between the data points of two different clusters is calculated. Av-erage linkage is also used in some scenarios.
Strength and weakness:
The major strength of k means clustering is it‘s sim-plicity and speed [168]. It can also work on datasets containing a variety of probability distribution [175]. The major drawback with k means clustering is it‘s sensitivity to the initialization of cluster centers [167]. Hence determining the initial cluster centers is a ma-jor challenge though many methods based on statis-tics, information theory and goodness of fit are pro-posed [168]. Determining the number of centers is also a challenge and is addressed in few works [173]. An another drawback with k means clustering is it‘s computational complexity. As the distance of each data point has to be calculated with each cluster cen-ter for every icen-teration, the computational time is high. Solutions such as data structure that stores informa-tion at each iterainforma-tion to avoid repeated computainforma-tions [169] and Graphical processing units (GPUs) that par-allelize the algorithm are proposed to reduce the com-putational complexity of k means clustering [172]. Moreover k means clustering is also sensitive to out-liers and can end up in local optima. Few alternatives include fuzzy c means clustering and other soft clus-tering techniques that are proved to work well with noisy data [170]. k means clustering is also combined with optimization techniques such as PSO and ACO to avoid local optima and to arrive at better cluster par-titions [171]. Few works are carried out to identify the better cluster partitions with minimum intracluster distances and maximum intercluster distances. Opti-mization function is derived that minimizes the intr-acluster distances and maximizes the intercluster dis-tances. This function is optimized using optimization algorithms such as GA, PSO, WOA, ACO etc in few clustering works. Few other works include [269] that uses a set of objective functions and updates the al-gorithm accordingly to improve the intracluster com-pactness and intercluster separation, [270] that uses bisected clustering algorithm to measure the intraclus-ter and inintraclus-terclusintraclus-ter similarity metrics etc. [174] pro-poses a method to overcome the drawback of noisy features in k means clustering.
on heterogeneity. More heterogeneous data points breaks down into another cluster. In AGNES clus-tering technique, each input point is considered as a single cluster and homogeneous points are clustered together as a single cluster at each iteration.
Strength and weakness:
The major strength of hierarchical clustering includes it‘s scalability and capacity to work with datasets of arbitrary shapes [177]. It also determines the hier-archical relationships well. Moreover the number of clusters need not be specified in advance [178]. The major drawback with hierarchical clustering is its computational complexity [176],[177],[178] and few other methods are proposed to improve the efficiency of the same [176]. Parallel techniques are also used to improve the computational efficiency of hierarchical clustering [179].
3. Density based clustering: Density based clustering works by defining a cluster as the maximal set of density connected points. Three types of points are chosen core, border and outlier. Core is the part of the cluster that contains dense neighborhood. Bor-der doesn‘t have many points but can be reached by the cluster. Outlier can‘t be reached by the cluster. Density based clustering picks up a random point and checks if it is the core point. If not, the point is marked as an outlier. Else, all the directly reachable nodes from the specific point are assigned to the cluster. It keeps finding the neighbors until it is unable to. There are certain kinds of problems where density based clustering provide accurate results than k-means clus-tering. Outlier detection is accurate in density based clustering.
Strength and weakness:
The major strength of density based clustering is that it can discover clusters of arbitrary shapes [184],[177]. It is also robust to outliers [184]. There are several density based algorithms such as DBSCAN, OPTICS, Mean-Shift etc [177].
The major drawback with density based clustering is the setting of parameters. Parameters such as neigh-bourhood size, radius etc. have to be set in density based clustering [182], [177]. Few algorithms are pro-posed to determine the parameters in density based clustering [183]. Moreover the density of the starting objects affect the behavior of the algorithm. The al-gorithm also finds its difficulty in identifying the adja-cent clusters of different densities [182] ,[177]. Tech-niques such as space stratification is proposed to solve this problem [182]. An another drawback with den-sity based clustering is its efficiency. Parallelization of the algorithm reduces the computational complexity to a certain extent. Techniques such as GPUs [180], mapreduce [181] are used to improve the scalability and efficiency of the algorithm.
2.2.3 Association
The method of identifying the relationship amid the items and deriving the rules based on the relationship is called as-sociation. Though association mining is not of much use in prediction, there are few scenarios where association rule is used. The rule has antecedent and consequent. Associa-tion rule mining is used mainly in business and marketing [185]. There are different algorithms used in association rule mining. Few include Apriori, Predictive Apriori, Ter-tius etc [186]. Optimization techniques such as PSO are also used with association rule mining to improve its effi-ciency [187]. [188] presents a survey on association rule mining algorithms.
2.3
Predictive models based on machine
learning
Machine learning approaches are used for predictive tasks. It is the process of training the machine with a training in-put set, building a model and the evaluating it with the test data. The machine learns continuously from the errors until the model gets stabilized. Supervised learning works with labeled input data whereas unsupervised learning works with unlabeled input data. Machine learning uses soft com-puting techniques like neural networks for training.
2.3.1 Neural networks
Neural network is a commonly used soft computing tech-nique for predictive analytics. Neural networks are used to classify complex patterns that are difficult to classify us-ing SVMs or other techniques. There are different types of neural networks that can be trained using supervised, unsupervised and reinforcement learning. There are also different learning algorithms for training neural networks.
Strength and weakness:
The major strength of Artificial Neural Networks(ANN) lies in it‘s ability to work with large amounts of data and yield good results. They have good generalization and learning ability and are universal approximators [191]. ANN has good fault tolerant, self learning, adaptation and organization ability [192]. An another advantage with ANN is that they are good for high dimensional datasets as each variable do not have major impact on the class vari-able but as a group they are good at classification. More-over a complex ANN relives user from determining the interactional and functional forms in prior and is able to smooth any polynomial function [193]. There are different types of neural networks such as as feedforward network, radial basis function network(RBFN), auto encoder, Boltz-mann machine, extreme learning machines, deep belief net-work, deep convolutional network etc [189] each with its own strengths and weaknesses. For example, RBFN are easy to design, have good generalization ability and are tol-erant to noise. These networks find their use in designing flexible structures and systems [190].
The major weakness with ANN is that they can‘t be ap-plied blindly to all kinds of data. Hence they are used by combining with other models as hybrid prediction models in most of the prediction problems. For example, in time series problems, both linear and non linear relationships ex-ist and ANN is combined with ARIMA modelling in such problems [190]. An another disadvantage lies in the fact that there are no proper rules to determine the number of hidden nodes in neural networks. Moreover they can also easily end up in local optima and are tend to overfit [193]. Optimization algorithms such as GA [194], Gravitational search algorithm with PSO [196] are used to avoid the lo-cal optima problem in ANN. Algorithms such as Fruitfly algorithm also find their use in determining the parameters for ANN [195]. Overfitting problems is addressed by tech-niques such as dropout mechanisms [197], bayesian regu-larization [198] etc.
2.3.2 Deep learning
Deep learning is the most commonly used technique in use today for classification, clustering, prediction and other purposes. While learning in machine learning proceeds in a broader way, deep learning works in a narrow way. It works by breaking down the complex patterns into simple smaller patterns. Learning happens in parallel in the smaller pat-terns and finally the sub solutions are combined together to generate the final solution. This improves the accuracy of the network. Deep nets also help in avoiding the van-ishing gradient problem. Most of the deep learning prob-lems use Rectified Linear units function(ReLUs) instead of sigmoidal and tanh activation functions that causes vanish-ing gradient problem. The use of ReLUs help overcome the vanishing gradient problem by avoiding zero value for the derivative and maintaining a constant value instead [271]. Moreover the use of deep learning networks such
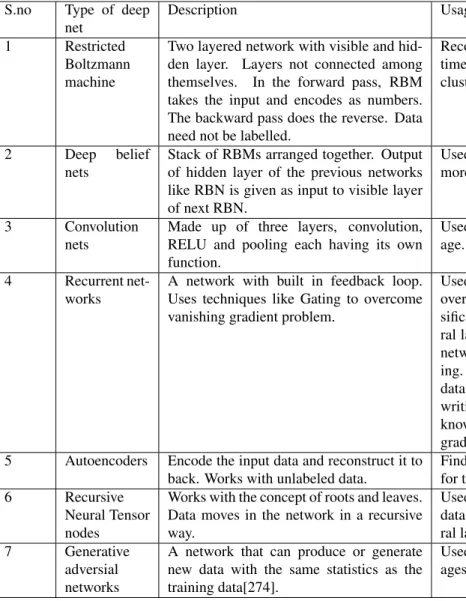
as Long Short Term Memory Networks(LSTM) avoid van-ishing gradient problem by maintaining a constant value for the recursive derivative using cell states [272]. Deep nets use GPUs that help them get trained faster. When the input pattern is quite complex, normal neural networks might not be effective because the number of layers required might grow exponentially. Deep nets work effectively in solving such complex pattern by breaking them down into simpler patterns and reconstructing the complex solution from the simpler solutions. GPUs are known to be a better alter-native to CPUs for big data analytics owing to it‘s lower energy consumption and parallel processing. Hence GPUs are found to be scalable in deep learning as the training and learning of the deep nets are made faster with paral-lel processing of many computational operations such as matrix multiplications [273]. There are different kinds of deep nets used for different purposes [5]. Table 3 shows the different types of deep nets and their usage.
Strength and weakness:
An overview of deep learning in neural networks has been discussed in [199]. The major strength of deep learn-ing is it‘s ability to model non linear relationships well. Deep learning also suits well for massive data and has better representation ability than normal networks [200]. Moreover deep learning does automatic feature extraction and selection [201].
The major weakness of deep learning is that it is a black box technique. There is no theoretical understanding be-hind the model. Certain techniques such as information plane visualization are proposed to understand DNN by us-ing the mutual information exchanged between layers in DNN [202]. Moreover deep learning works well only with massive data and their architectures are more specialized to a particular domain. They also consume high power [203].
2.3.3 Fuzzy rule based prediction
clus-S.no Type of deep net
Description Usage
1 Restricted
Boltzmann machine
Two layered network with visible and hid-den layer. Layers not connected among themselves. In the forward pass, RBM takes the input and encodes as numbers. The backward pass does the reverse. Data need not be labelled.
Recognize inherent patterns. Works well with real time data like photos, videos, voice etc. Used for clustering.
2 Deep belief
nets
Stack of RBMs arranged together. Output of hidden layer of the previous networks like RBN is given as input to visible layer of next RBN.
Used for recognizing complex patterns. Used more commonly in facial recognition.
3 Convolution
nets
Made up of three layers, convolution, RELU and pooling each having its own function.
Used to identify the internal patterns within an im-age.
4 Recurrent net-works
A network with built in feedback loop. Uses techniques like Gating to overcome vanishing gradient problem.
Used when the patterns in the input data changes over time. For image captioning, document clas-sification, classify videos frame by frame, natu-ral language processing etc. LSTM is a recurrent network architecture that is used for deep learn-ing. The application of LSTM includes time series data predictions, classification, processing, hand writing recognition, speech recognition etc. It is known for reducing the exploding and vanishing gradient problems.
5 Autoencoders Encode the input data and reconstruct it to back. Works with unlabeled data.
Finds its use in dimensionality reduction. Used for text analytics.
6 Recursive
Neural Tensor nodes
Works with the concept of roots and leaves. Data moves in the network in a recursive way.
Used to discover hierarchical structure of a set of data. Used in sentimental analysis. Used in natu-ral language processing.
7 Generative
adversial networks
A network that can produce or generate new data with the same statistics as the training data[274].
Used in fashion designing, improving satellite im-ages, etc.
Table 3: Different types of deepnets and their usage
ters [170], [270].
Strength and weakness:
The major strength of fuzzy systems is it‘s interpretabil-ity. The fuzzy models are easy to interpret if designed care-fully [205] especially with the use of linguistic labels [206]. Fuzzy rules also help to model the real world processes easily [207]. Fuzzy systems are known well for handling uncertainty [208].
The major weakness of fuzzy systems include it‘s poor generalization capability as it is rule based. Fuzzy systems are not robust as any change should be incorporated into the rule base. To overcome this disadvantage, fuzzy sys-tems are often combined with ANN and hybrid syssys-tems are developed for prediction [208]. An another disadvan-tage of using fuzzy systems is that the knowledge about the problem should be known in advance. The use of hy-brid systems can help overcome this disadvantage as the knowledge is extracted from neural networks in such sys-tems [209]. Approaches such as genetic programming is also used to generate rules for fuzzy systems [210].
2.3.4 Ensemble algorithms
S.no Ensemble Description
1 Bagging Bagging or bootstrap aggregation is the method of decreasing the variance without any change in the bias. It is mainly used for regression and classification techniques. Each model is built separately and the net output is derived by bringing together the results from the individual models by joining, aggregation and other methods. 2 Boosting Boosting is a parallel ensemble method to reduce bias without any changes in
vari-ance. Boosting converts weak learning algorithms to strong learning algorithms using certain methods like weighed average. There are many variations of boosting algo-rithms like adaboost, gradient boosting etc. The misclassified instances are assigned more weight in the successive iterations.
3 Stacking Stacking is the technique in which the output of the previous level classifier is used as training data for the next classifier to approximate the target function. It minimizes variance and methods like logistic regression is used to combine the individual models.
Table 4: Ensemble techniques
where a single model is likely to overfit whereas boosting is good for problems where a model yields poor perfor-mance. Moreover bagging can be done in parallel as each model is independent whereas every model in boosting de-pends on the previous model [214]. There are different kinds of boosting techniques, the major include adaboost and gradient boost. Adaboosting improves performance by assigning high weight to the wrongly classified data points whereas gradient boosting improves performance by using gradients in the loss function [216]. Indeed, gradient boost-ing converges in a limit whereas adaboost is computation-ally efficient than gradient boosting [217].
3
Challenges of core predictive
models on big data
‘Big data’ represents data sets that are in petabytes, zettabytes and Exabyte. The sources of big data include satellites that generate enormous information every second from space, mobile communications generating volumi-nous data, social media like Facebook, Twitter with blogs, posts etc. Traditional relational databases, data warehouses and many visualization tools and analytical tools are de-veloped for structured data. Because of the heterogeneous nature of big data and enormous amount of data generated including real time data, there is a need to enrich traditional analytical methods to support the analytical functionalities for big data. Alternatively, new tools and techniques are developed to work on big data in combination with the tra-ditional analytical techniques. Big data development in-cludes the development in all the areas of handling big data including data storage, pre-processing, data visualization, data analytics, online transaction processing, online analyt-ical processing, online real time processing, use of business intelligence tools for predicting insights from big data etc [3]. The main characteristics of big data include volume, velocity, variety, veracity and value.[4]. A single machine cannot store big data because of its volume. The basic con-cept behind big data storage is to have many nodes
(com-puters) and store the chunks of big data in them. The nodes are arranged in racks and communicate with each other and the centralized node that controls them. Clouds are also used for big data storage but it has its own challenge of privacy and security. Getting into the depth of storage technology is outside the purview of this article and hence we are leaving the discussion about big data storage at this stage. As our paper mainly aims to discuss the overview of predictive analytics with big data, this section addresses the challenges encountered by the core predictive models discussed in previous section on big data.
Extrapolation
Extrapolation will be precise only when the knowledge about the underlying covariate information [220] and the actual system is clear [219],[221] which is difficult to de-termine in big datasets. With big data such as spatial data, existing extrapolation approaches fail due to it‘s time and space constraints. Hence new technological innovative ap-proaches are required to model such big datasets and under-stand them [219]. Extrapolation with kernel methods like gaussian are proved to be good due to their flexibility in choosing the kernel function. Yet, when it comes to devel-opment of gaussian models for multidimensional big data, it suffers from computational constraints. Techniques such as recovering out of class kernels are used to overcome the computational constraint to a certain extent [218]. An an-other problem with the machine learning models including deep learning is that they merely fit the data and may per-form well for training dataset and even testing dataset but fails in extrapolation [221],[222]. This happens as they do not have proper structural explanations for the correlations they identify [222]. [220],[221] recommends the construc-tion of hybrid systems comprising the science based model or physical models along with the predictive models to im-prove the accuracy of extrapolation. But the problem in developing hybrid systems lies in the fact that it requires domain knowledge.
Regression
com-pletely. But big datasets can not be loaded into memory completely. Few parallel techniques and solutions are pro-posed for regression yet they end up in local optima or in accessing the data again and again for updates. The other problem in using parallel techniques is the compu-tational resources incurred [223]. The area in the improve-ment of computational resources is still lacking when com-pared with the amount of big data generated [224]. Regres-sion approaches such as kringing is computationally com-plex especially with big data. Sampling techniques such as leveraging [224] and subdata selection[226] are proposed to reduce the computational complexity. But as discussed in the earlier sections, the inferences on the samples cannot be justified completely for the whole population as such. Regression is also performed locally by dividing the big dataset into few smaller datasets and then combining the submodels to construct the final model [225]. The chal-lenges with these solutions lies in the choice of appropriate method for division, aggregation etc.
Decision trees
Big data streams are more prone to noise and decision trees are more sensitive to noisy data [227]. The time taken to build the decision tree is computationally expensive with big data [228]. Preprocessing and sampling the big data in full batches before the construction of decision tree adds to the computational cost [227]. External storage is re-quired to construct decision tree for big data as the com-plete dataset cannot be loaded into memory. Hence tra-dition decision tree design does not suit for the big data. Solutions such as incrementally optimized decision tree al-gorithm [227] is proposed where decision tree is built in-crementally. Parallel techniques [229] are proposed in big data platforms such as spark where the decision tree algo-rithm is executed in parallel. Decision tree algoalgo-rithm is also converted into mapreduce procedures in [228] to reduce the computational time. The computational time of gradient boosted trees is decreased in [230] by eliminating few in-stances in calculation of information gain and bundling cer-tain features together. Yet, these solutions come at the cost of choosing the right technique to break the algorithm for parallel execution, bundling the features etc.
K Nearest Neighbor
The major problem of KNN with big data is it‘s com-putational time as the distance has to be calculated among each instances [231]. This in turn incurs memory require-ment for storage [232]. k means clustering is used to cluster the big dataset and KNN algorithm is used on each subset to reduce the computational time [231]. But this solution comes with the general limitations of k means clustering. Memory requirement is handled to a certain extent by big data platforms such as spark so that in time memory com-putation is used effectively [232]. Map reduce approaches [233] are also used to reduce the computational time. Par-allelization of KNN algorithm is also proposed [234]. Yet, all these big data platform solutions come with their own concerns on the nature of partitioning as the accuracy can not be compromised for efficiency [235].
Naive Bayes
Naive Bayes requires the probability to be calculated for all the attributes. With big datasets, the number of at-tributes is more and hence the time complexity to calculate the probability for all the attributes is high [236]. Another problem with naive bayes is the underflow and overfitting problems [237]. The underflow problem is usually han-dled by calculating the sum of log of probabilities rather than multiplying the probabilities whereas overfitting prob-lem is handled using techniques like laplace estimate, M-estimate etc. But with high dimensional big datasets like genomic datasets, these solutions are not efficient [237]. Naive bayes deals only with discrete data. Hence dis-cretization methods are used before applying naive bayes algorithm. In case of big data, existing traditional dis-cretization methods are not efficient and may lead to loss of information [238]. Parallel implementations are pro-posed for naive bayes algorithms yet they come at the cost of hardware requirements [236]. [237] proposes a solu-tion to solve the underflow and overfitting problems in big data. The method uses a robust function that works based on average of condition probabilities of all attributes and calculation of dependency of the attributes on the class at-tribute. Parallel versions of existing discretization methods are also proposed to address the challenge of big data [239]. Yet, more research is required in these open issues.
Support vector machines
SVM is known for it‘s accurate results yet the compu-tational complexity of SVM is quite high on big datasets [240],[241]. Inspite of this computational complexity, SVM uses certain optimization techniques like grid search method for parameter tuning. These optimization tech-niques are not suited for big datasets [244]. Though certain parameter optimization techniques such as stepwise opti-mization is proposed in [244] for big datasets, more re-search is needed in this area. Solutions such as implement-ing SVM on a quantum computer [240] to reduce it‘s time complexity is proposed. Again, they come at the cost of hardware. Parallel implementation of SVM using mapre-duce technique is proposed [241] yet they may end up in local support vectors that may be far away from the global support vectors. [242] proposes a distributed version of SVM where global support vectors are achieved by retain-ing the first and second order statistics of the big dataset. Though there are many parallel versions of SVM, only a very few parallel tools are available in open source for par-allel SVM. Moreover, these tools also require proper tuning [243].
K means clustering
property of k means [246]. Methods like subspace clus-tering and sampling are used to reduce the iteration depen-dency property of k means [246]. Yet, the choice of correct sampling method and partitioning technique in case of sub-space clustering adds to the big data challenges. Indeed, the size of the sample data is more than half the original data in most of the methods and hence the computational complexity still persists [248]. Optimization of initial clus-ters using techniques like choosing the data points in high density space [247] are proposed. Though they can avoid outliers, they still suffer from the same computational com-plexity owing to the distance calculation. Dimensionality reduction techniques are also proposed but they come with their own drawback that the cluster in projected space may not comply with the clusters in actual space [248]. Hybrid methods are proposed by combining projection techniques with sampling and few other techniques like visual assess-ment of cluster tendency. But the research on hybrid tech-niques are still in it‘s initial state [248].
Hierarchical clustering
Hierarchical clustering also suffers from the drawback of computational complexity and in fact it incurs more time than k means clustering when the size of the dataset is large [252]. Techniques such as building clusters using centroids [250] and usage of cluster seeding [252] are proposed to re-duce the computational complexity of hierarchical cluster-ing. Partitioning the sequence space into subspaces using partition tree is also proposed [251] and the clusters are re-fined in the subspaces. Fast methods to compute the closest pair is also proposed to reduce the computational cost. Yet, these methods are very specific to the particular problem. Moreover, the partitioning techniques and the cluster seed-ing techniques should be chosen wisely. Visual assessment of tendency are also used to return single linkage partitions on big datasets [249] yet the study of tendency curves have to be clear.
Density based clustering
Density based algorithms are better compared to parti-tioning algorithms on big data and data streams because it can handle datasets of arbitrary shapes. It is also not required to specify the number of clusters and it can han-dle noise effectively. But, with the high speed of evolving data streams and high dimensional big data, density based clustering is finding many challenges. Though few meth-ods are found to perform better, they still suffer from open challenges such as too many parameters to set, memory constraints, handling different kinds of data such as cate-gorical , continuous etc [254]. Big data platforms such as hadoop is used for parallelization in density based cluster-ing. Yet, there is a need to choose the shuffling mechanism, partitioning technique and work load balancing efficiently [253]. Moreover, density based clustering algorithms such as OPTICS cannot be parallelized as such and either im-provements or new algorithms have to be proposed to han-dle large datasets [255]. Few enhancements are carried out in OPTICS and other density based clustering algorithms to support parallelism. Yet, they are very specific to the
prob-lems they address. For example, [256] uses spatio temporal distance and temporal indexing for parallelization which is more specific to the spatio temporal data and [257] pro-poses a method that is specific to the electricity data.
Neural networks
The major challenge that neural network faces with big data is the time taken for training phase as large data sets require more training iterations or epochs [260],[261]. As a result, the computing power required becomes high [258] and in turn the energy consumption[260]. Though tech-niques like mapreduce on hadoop platforms are used [259], the mapreduce design has to be an optimized and efficient one. Hardware solutions such as GPU and memrister are proposed [258], yet they suffer from the major drawback, the cost factor. Optimization algorithms are proposed [259] to optimize the parameters of neural networks. Yet, there is a common perspective that using optimization algorithms increases the computational time due to it‘s convergence property though proper optimization decreases the training time of neural networks inspite of improving the accuracy. Very few researches are carried out in this area for big data with neural networks. The other problems with neural net-works on big data include the increase in number of param-eters, lack of proper theoretical guideline in the structure of neural networks, insufficient knowledge as only abstraction is extracted, inherent problem in learning etc[261].
Fuzzy systems
Fuzzy systems are of great use in big data due to it‘s ability to handle uncertainty. To cope up with the big data requirements, fuzzy systems are designed that distributes the computing operations using mapreduce technique [61]. But the major problem with mapreduce is the overhead taken to reload the job everytime during it‘s execution. Moreover when there are more number of maps, the imbal-ance problem has to be dealt with carefully. Spark which has in memory operations and resilent distributed databases is more efficient than mapreduce but unfortunately there are no big works that integrate fuzzy systems with spark [263]. Fuzzy systems are also found to be more scalable as they represent the data as information granules [262]. Yet, good granular techniques in combination with fuzzy classi-fication systems exclusively for big data is required [262]. The fuzzy techniques designed for big data should be tested for real world problems and more general fuzzy techniques need to be developed rather than the techniques designed to address specific problems [262].
Deep learning
deep learning is usually performed on very big data that in-volves millions of parameters and many CPUs is another problem. Hence deep learning requires the use of exces-sive computational resources. Moreover, deep learning also faces the challenge of determining the number of optimal parameters, learning good semantic data representations as they are known for representing only the abstract detail etc [265]. Lot of research works is required to address the in-terpretablity problem[266].
Ensemble algorithms
The major problem with ensemble algorithms for big data is it‘s computational time [268]. As ensemble tech-niques require the use of different classifiers, the computa-tional time they require is generally high and this increases when the data is big. Ensemble techniques are known for their diversity as they use different kinds of classifiers and aggregate the results. Though many ensemble tech-niques are developed for static data, there are no big re-search works carried out in studying the diversity of ensem-ble techniques on online streaming data. Since the differ-ent classifiers used on streaming data already differs in the data they use, a proper study of the advantages of ensemble techniques on streaming data is required. Proper pruning techniques is also an area to be explored [267]. There are few works where ensemble techniques for big data is par-allelized with mapreduce [268], yet they are not tried on platforms such as spark that are proved to be more efficient than mapreduce.
4
Predictive analytics on big data
across different domains
4.1
Healthcare
Big data is generated by lot of industries and health care is one among them. Huge amount of big data is gener-ated from wearable devices in patients, emergency care units, etc. Structured data such as electronic patient record, health record, unstructured and semi structured data such as scanned images, clinical notes, prescriptions, signals from emergency care units, health data from social media are few examples of big data generated from health care domain. Predictive analytics on health big data helps in predicting the spread of diseases [8], [9], predicting chances of read-mission in hospitals [10], predicting the diseases at an early stage, [11], [12],clinical decision support system to identify the right treatment for the affected patients, hospital man-agement etc [13]. A detailed overview about the use of pre-dictive analytics in health informatics is presented in [14]. The paper discusses about the applications of big data pre-dictive analytics in health informatics, techniques for the same, opportunities and challenges.
Research gaps
Apart from storage, processing and aggregating differ-ent types of data in health care, iddiffer-entifying the dependen-cies among different data types is still an open challenge
that requires optimal solution. Another challenge is with data compression methods. Though various methods are available for big data compression like FPGA, lossy image compression, they might not suit well for medical big data since medical images shouldn‘t lose any information [44]. An another area of improvement is in predicting the spread of diseases earlier. Though there are certain works carried out in this area, few important features were not taken into consideration for prediction. For example, though environ-mental attributes are used as input for predicting the spread of disease, certain inputs related to biological and socio-behavioral is excluded in the proposed approach in [8]. Proper dimensionality reduction techniques and feature se-lection are not considered in few works. Merely knowledge of domain experts are used for feature selection in health big data [10]. Clinical decision support systems is another challenge to work with. Though clinical decision support systems are developed, the success rate is very less. The decision support system should be developed considering both the patient’s and physician’s perspectives as patients’ acceptance is very important for these systems. It can be of greater importance for emergency care units. Few chal-lenges to work on include privacy issues, proper training for clinicians, quality of data etc. Such systems help in tak-ing precautionary actions like identifytak-ing low risk patients, work on hospital readmission rates etc [60]. Radiation on-cology is another area open to researchers. Building an integrative model for radiation oncology to be used as deci-sion support system will be of great help for clinicians [10]. More concentration on genomic analysis is required since the present applications of clinical prediction uses genomic data. Research on functional path analysis of genomic data has to be concentrated upon [44]. Research works on han-dling noise, complexity, heterogeneity, real time, privacy in clinical big data is the need of the hour [14].
4.2
Education
Education field is another domain generating lot of big data using sensors, mobile devices for applications like learning management system, online assignments, exams, marks, attendance etc. Social media is also widely used by stu-dents and instructors as forums [15]. Predictive analyt-ics in data generated from these devices and institutions help to predict the effectiveness of a course [15], learning method [16],[17], student’s performance [18], [20], institu-tion’s performance [21] etc. Such predictions also help to personalize instructions by customizing the learning expe-rience to each student’s skills and abilities. [19] discusses about big data opportunities and challenges in education field. [17] and [21] also discusses about the scope of pre-dictive analytics in educational big data.
Research gaps
challenge involved in this field is social and ethical chal-lenges. Since the student‘s and institution‘s individual data are used for prediction purposes, many students and insti-tutions might not want their data to be exposed [68]. In the recent days, many institutions allow students to bring their own devices for language learning. Hence massive amounts of data is generated and scalability is an important area to concentrate in future [19]. Another area to work on is in integrating data from different sources. Student data are available in multiple sources like social media, schools, district offices, universities etc. Few are structured and few unstructured. A more focus on this area can help predic-tion.
4.3
Supply chain management
Predictive analytics helps in supply chain management. Accenture is a company that has implemented big data so-lutions for prediction in supply chain management [22]. Prediction in supply chain management helps to improve customer relationships by regular interactions with them thereby helping in understanding their satisfaction level, product recommendations [22], predicting supplier rela-tionships [23], reduce the customer waiting times [24], im-prove the production based on demand [25], [26], manage the inventory effectively [27] and reduce risks in the pro-cess of supply chain [28].[29] discusses about the advan-tages of predictive big data analytics in this domain. Prod-uct development is another area where big data solutions can help the process.
Research gaps
Though there is more scope for prediction in supply chain management, very few industries have implemented it. Probably because of the hesitation to invest and the lack of skillset. Models which can reduce cost can be proposed for supply chain management processes. Hiring data scien-tists with domain knowledge helps the industries to move towards big data solutions for efficient supply chain man-agement [22]. Though some of the companies use analytics in supply chain management, most of them are ad-hoc and situation specific. Predictive analysis on other areas like improvement in demand driven operations, better customer supplier relationships, optimization of inventory etc can be more concentrated upon [22], [27]. Generalized models for prediction in supply chain industry can be more focussed on. Though [23] proposed a model based on deduction graph, it is not tested on variety of product designs. Pri-vacy of data is not considered. The approach also uses lot of mathematical techniques. Hence approaches using sim-ple techniques can be developed. More solutions for sup-ply chain management considering both strategy and oper-ations has to be focussed upon [26].
4.4
Product development and marketing
industry
[30] presents a white paper about the scope of predictive analytics for product development process. Marketing is a part of almost all the sectors and prediction in market-ing has gained more importance because of its direct im-pact in business and income. Predictions using big data so-lutions for marketing helps to acquire customers, develop customers and retain customers. Prediction in product velopment and marketing industry helps to validate the de-sign of the product, predict the demand and supply thereby increasing the sales and improving the customer experi-ence.
Research gaps
There is no single technology available to address all the big data requirements. Big data solutions have to be in-tegrated with other approaches and techniques to support predictive analytics. Researchers can concentrate to work on a single technology that can address all the require-ments [30]. Also, different processes have to use different techniques and approaches specifically designed for them. For example,semiconductor manufacturing process should consider the spatial, temporal and hierarchical properties in manufacturing process as the existing algorithms doesn‘t suit well for them. Specific solutions can be proposed for different product development industries [55]. More work on implementing the machine learning algorithms in differ-ent areas of marketing and integrating them together can be a scope of work for researchers [45].
4.5
Transportation
‘Smart city’ is a diction that is of common talk in today‘s world. A smart city uses the information collected from sensors operating over the cities to help in the administra-tion of the cities. Many research works are carried out in this area. Intelligent transportation systems is required for building smart city. Sensors generate lot of information that require big data solutions for processing and predic-tion. Predictive analytics using big data solutions for trans-portation has lot of applications like predicting the traffic and controlling it efficiently [31], [32], [33],predicting the travel demand and making effective use of the infrastruc-ture thereby reducing the waiting time of the passengers [34], [35], automatic control of traffic signals [36] and pre-dicting the transport mode of a person [37].
Research gaps
generated is temporal and spatial in nature for transporta-tion. Readings from sensors are also uncertain [34]. An-other area to concentrate is on using An-other deep learning approaches to predict traffic flow for better performance. The prediction layer used in [33] is just logistic regression. More powerful predictors can improve performance. Data fusion for social transportation data is still in a preliminary stage. GPS from taxi driver only give information about origin and destination but not on travel demand. Mobile data are used for travel demand but can‘t estimate travel time on roads. Hence a proper fusion approach has to be used to integrate data from several sources.Web based agent technology for transportation management and con-trol is a research direction [35]. Software robots to monitor the state of drivers, check the condition of cars, evaluate safety environment is a research in progress [35]. There is more scope in predicting the transport mode of a per-son. [37] used only sensor information for classification whereas future work can concentrate on integrating infor-mation from cloud too. Advanced techniques to remove noise and outliers can be worked upon.
4.6
Other domain areas
Agriculture can be benefited using predictive analytics. Now-a-days sensors and UAVs finds its use in agriculture. Sensors are used to find the effectiveness of certain type of seed and fertilizer in different places of the farmland. Big data solutions are used to store and analyze this informa-tion to improve the operainforma-tions in agriculture. Addiinforma-tional information like predicting the effect of certain diseases on crops helps to take precautionary measures. Farmers do predictive analytics in agricultural big data to lower costs and increase yields. The use of different fertilizers, pesti-cides is used to predict the environmental effects [38], [39]. Big data prediction finds its application in banking. Analy-sis in browsing data helps to acquire customers. Defaulters are predicted by mining Facebook data. Banks use sen-timent analysis to analyze the customer needs and prefer-ences and motivate them to buy more products thereby re-ducing the customer churn. Facebook interactions, tweets, customer bank visits, logs, website interactions are used as sources for sentiment analysis. A 360 degree view of tomer interactions is analyzed to prevent churning of cus-tomers. Certain features like account balance, time since last transaction all helps banks to frame rules and identify the customers who are about to churn. Big data prediction helps to identify hidden customer patterns. Large sample of outliers are analyzed to predict fraud detection in banks [40]. There are also few works carried out for prediction in library big data. Libraries work with online journals and resources which are again voluminous. Predictive analyt-ics is used in library big data for useful extractions related to learning analytics, research performance analytics etc. The user search behavior, log behavior are all analyzed to extract useful information. An other industry where pre-dictive analytics finds its importance is telecommunication
industry. Lot of applications today like Whatsapp uses dif-ferent kinds of data that include structured, unstructured and semi structured. Predictive analytics in telecommuni-cation industry focusses mainly on customer satisfaction [41]. Predictive analytics in big data helps business too. Big data analytics platforms of different providers help in personalization. The extent to which they support person-alization differs in different platforms. Many big data plat-forms like KNIME, IBM Watson analytics are all finding its use in personalization [42]. Prediction in big data is used extensively in robotics field also. Robots communi-cate with many other systems. Sharing of information be-tween robots and smart environments, comparing the in-formation the robot has with other systems improves the robot intelligence [43]. Movie industry uses big data solu-tions for predicting the success using social media. Enor-mous data gets accumulated in social media like Wikipedia, Facebook and Twitter. Self-aware machines are finding its way in industries with the help of big data and cloud com-puting techniques. These machines are capable of moni-toring their health condition on their own and take smart decisions on their maintenance.
5
Comprehensive challenges
Big data has its own challenges in terms of storage, pro-cessing, analytics etc. We restrict this paper to address the overall challenges involved in predictive analytics on big data and to throw light on few techniques used and state of the art work done in handling these challenges. The over-all chover-allenges are categorized under six headings shown in figure 3.
Figure 3: Comprehensive challenges of Predictive analyt-ics on big data - taxonomy
5.1
Real-time data
Handling real time data is one among the major challenges in predictive analytics on big data. Few predictions such as predicting the early outbreak of the disease to take care of public health [9], real time recommendation system for marketing requires real time data from social sites to be collected.