Climate Change Adaptation Preparedness in Developing Countries: A
Study of 21 Countries and Knowledge, Attitudes, and Practices Studies
in Akwa Ibom and Lagos States in Nigeria
Edema Ojomo
A thesis submitted to the faculty of the University of North Carolina at Chapel Hill in partial fulfillment of the requirements for the degree of Master’s of Science in the Department of Environmental Sciences and Engineering.
Chapel Hill 2011
Approved by:
Bartram, Jamie
Elliot, Mark
Sobsey, Mark
ii
ABSTRACT
EDEMA OJOMO: Climate Change Adaptation Preparedness in Developing Countries: A Study of 21 Countries and Knowledge, Attitudes, and Practices Studies in Akwa Ibom and Lagos
States in Nigeria
(Under the direction of Dr. Jamie Bartram)
Global climate change is projected to have disproportionate adverse impacts on water quality and availability in low-resource settings. Therefore, it is essential that developing countries assess their vulnerabilities and develop strategies to improve their resilience. This thesis presents two research studies on climate change adaptation preparedness in developing countries.
In the first study, the policies and programs of 21 developing countries were analyzed to determine adaptation preparedness. In study countries, preparedness varied widely. However, in general, even those countries that have prioritized preparedness for climate change need to implement several additional policies and practices to ensure adequate adaptation.
iii
ACKNOWLEDGMENTS
My research project would not have been possible without the support of many people. I wish to express my gratitude to my advisor, Dr. Jamie Bartram, who was extremely supportive of my ideas and offered invaluable assistance throughout the research. I am deeply grateful to Dr. Mark Elliot for his knowledge and advice at every stage of my
research. Also, I offer my deepest gratitude to Dr. Mark Sobsey and Dr. Jason West for their guidance and unique insight into the project.
A special thanks to: Joseph LoBuglio for his assistance and recommendations, the department of Environmental Sciences and Engineering, The Water Institute, and UNC Chapel Hill for providing the financial resources that made this project possible, Mrs.
Ewuoso for her support during my months in Nigeria, the students of the University of Lagos and University of Uyo and the officials at the Lagos Water Corporation, Akwa Ibom Water Company, and Lagos and Akwa Ibom Ministries of Education, Environment, and Rural Development for their willingness to be part of the project. I also thank my friends for their encouragement.
iv
TABLE OF CONTENTS
LIST OF TABLES…………. .………...………….vi
LIST OF FIGURES…..………...ix
LIST OF ABBREVIATIONS………x
Chapter I. Climate Change Preparedness in Developing Countries………..…………1
a. Introduction………....………...…...1
Anthropogenic Impacts on the World’s Climate………..……2
Effects of Climate Change on Freshwater Availability and Quality……….………4
Climate Change Impacts on Developing Countries……… …….……..5
Developing countries and their preparedness for climate change………..………6
Perceptions of developing countries regarding climate change………..………7
Research Objectives………..……..8
b. Literature Review………..……11
Climate Change………..11
Dealing with Climate Change ……….…..14
Vulnerability of developing countries with regards to climate change……….…...16
Vulnerability of water resources to climate change…… ………..17
Why Developing Countries need to Adapt to Climate Change……….19
Status of Preparedness with regards to climate
change adaptation in Developing Countries…….,……….22
c. Methods………25
Country Selection……….25
Country Assessment………25
Enabling Environment activities……….26
Hazard Identification………34
d. Results………..36
Regional and Country-level Climate Change Projections… ………..36
Individual Country Hazard Exposure………..40
Enabling Environment ………...42
e. Discussion……….49
Climate Change Projections and Hazards……….49
Enabling Environment ………52
Conclusion………...68
II. Climate Change Perceptions in Lagos and Akwa Ibom States………...69
a. Introduction………69
Climate Change and Nigeria……….70
Water Resources………71
Objectives……….72
b. Literature Review………..73
Background on Nigeria……….…...………….………..73
Background on Lagos and Akwa-Ibom States……….…………..74
Climate Change projections for Nigeria………..75
Hazards………77
vi
Water Stressors in Nigeria………78
Knowledge, Attitudes, and Practices (KAP) Studies……… ……79
Methods………..82
Knowledge, Attitudes, and Practices (KAP) survey………...82
Study Sites……….82
Study Population………...82
Questionnaire Development………...84
Questionnaire Distribution………..85
Results………88
Knowledge of Climate Change………..88
Attitudes regarding climate change………...92
Climate change adaptation practices……….93
Discussion………96
Knowledge of Climate Change……….96
Attitudes regarding climate change……….99
Climate change adaptation practices………..101
III. Conclusion………103
Appendix A………..……….109
Appendix B………..……….126
Appendix C………...………...……… 127
vii
LIST OF TABLES
Table 1: Possible impacts of climate change due to changes in weather
and climate events……….………....…...19
Table 2: IPCC regions and sub-regions as presented in the Fourth
Assessment Report………....…..….37 Table 3: Projected changes in the frequency and/or intensity of three
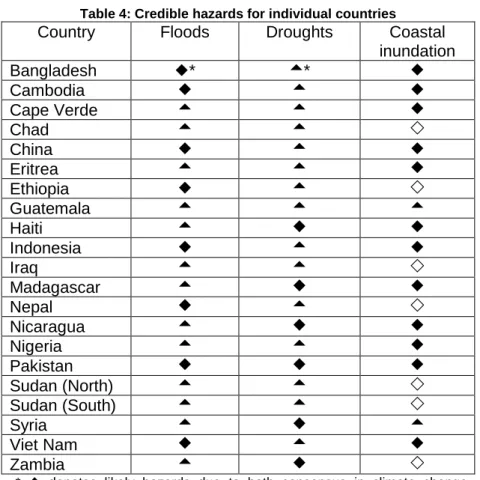
categories of extreme weather conditions from four different sources……….…... 38 Table 4: Credible hazards for individual countries……….………...……...42 Table 5: Enabling environment activities currently planned or implemented
in each country and the status of each activity………...……..43 Table 6: Number of flood and drought events in the list of top 10 events
(1900-2011) sorted by number of people affected……….……...……51 Table 7: General characterization of the climate change adaptation and
disaster risk reduction communities………...….58 Table 8: Seasonal change in frequency of extreme wet and dry events
in West Africa………....….76 Table 9: Cross National Public Perceptions on the Seriousness of
Global Warming………...……..80 Table 10: Response to "human activity is responsible for climate change."………...88 Table 11: Response to "natural climate variability is responsible for climate
change."………..…………...…...89 Table 12: Response to "to what extent are human activity and natural
climate variability responsible for climate change."………...………....….90 Table 13: Response to "which of the following will affect Nigeria as a
consequence of climate change"………...91 Table 14: Response to "What region of Nigeria is more vulnerable to
climate change."………...………...….92 Table 15: Response to "top three environmental issues in Nigeria.”………..……...…93 Table 16: Response to "what climate change adaptation practices are
carried out in Nigeria."……….………...…...94 Table 17: Percentage of Ministry and agency respondents who answered
viii
Table 18: Percentage of Ministry and agency respondents who
answered "In what schools are climate change awareness campaigns
carried out?"…….………..………..…………... …….95 Table 19: Percentage of University respondents who answered "Are
climate change awareness activities carried out at your university?"……..…….…95 Table 20: Percentage of University and Ministry respondents who
answered that awareness campaigns are being carried
ix
LIST OF FIGURES
Figure 1: CO2 emissions by countries in 1990………...………3
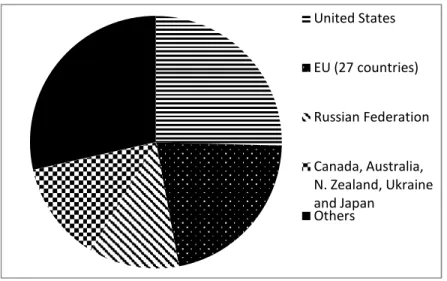
Figure 2: 1990 populations by country………...………..3
Figure 3: Relationship between key terms used in the paper………...………...6
Figure 4: Structure of research paper………10
Figure 5: Range of major uncertainties typically involved in impact assessments, showing the ‘cascade of uncertainty’ as these ranges are multiplied to encompass a comprehensive range of future possibilities….………..……..….…14
Figure 6: Number of countries planning and implementing the nine enabling environment activities………..………....44
Figure 7: Number of countries with varying levels of adequacy for the nine enabling environment activities………..…...……….45
Figure 8: Relationship between the presence of activity (both planned and implemented) in countries and the 2010 GDP………...………..46
Figure 9: Relationship between the presence of activity (both planned and implemented) in countries and the 2011 HDI value……….47
Figure 10: Relationship between the presence of activity (both planned and implemented) in countries and the HDI value……….………..….48
x
LIST OF ABBREVIATIONS
ACSM – Advocacy, Communication, and Social Mobilization ALM – Adaptation Learning Mechanism
BNRCC - Building Nigeria’s Response to Climate Change
CSIRO – Commonwealth Scientific and Industrial Research Organization DRI – Disaster Risk Index
DRR – Disaster Risk Reduction
EPRP – Emergency Preparedness and Response Planning FAO – Food and Agriculture Organization
GDP – Gross Domestic Product GEF – Global Environment Facility GHG – Greenhouse Gases
HDI – Human Development Index INC – Initial National Communication
IPCC – Intergovernmental Panel on Climate Change IRB – Institutional Review Board
KAP – Knowledge, Attitudes, and Practices LDC – Least Developed Countries
NAPA – National Adaptation Programme of Action
OAGCMs – Ocean- Atmospheric General Circulation Models UNDP – United Nations Development Programme
UNEP – United Nations Environment Programme
UNFCCC – United Nations Framework Convention on Climate Change UNICEF – United Nations Children’s Fund
I.
Climate Change Preparedness in Developing Countries
a. Introduction
According to the Intergovernmental Panel on Climate Change (IPCC), “climate change refers to any change in climate over time, whether due to natural variability or as a result of human activity” (IPCC 2007). However, most of the warming observed over the past fifty years is attributable to human activities. The IPCC Second Assessment Report (SAR) reports that “the balance of evidence suggests a discernible human influence on global climate (IPCC 2001).” One main anthropogenic cause of global climate change is the atmospheric build-up of carbon dioxide and other greenhouse gases (GHGs) emitted from vehicles and industrial processes. The significance of climate change lies in the dependence of several environmental factors, conditions, and resources (food production, water resources, human health, forests etc) on the climate.
2
The adverse impacts of climate change on water resources occur as a result of numerous climate change effects, including sea level rise (which will lead to salinization of freshwater resources), coastal and inland flooding (as a result of storms and cyclones in coastal areas and intense precipitation in inland areas which will lead to contamination of water resources), and drought (which will lead to drying up of available water resources). These climate change effects could result in reduced water quality and availability; however, some of the effects could increase water availability if the right practices are employed. The reduction in the amount of water resources caused by climate change impacts may bring about water stress or scarcity in areas that currently don’t experience water stress or scarcity by exacerbating current stresses on water resources.
An area experiences water stress when annual water supplies fall below 1,700 cubic meters per person, water scarcity when annual water supplies fall below 1,000 cubic meters per person, and absolute scarcity when annual water supplies fall below 500 cubic meters per person (UN 2011). Population growth and over-abstraction by sectors like the agricultural sector are some factors that contribute to water stress across the world, and according to the IPCC, climate change is expected to exacerbate current stresses on water resources. Experts believe that the undesirable impacts of climate change on freshwater systems outweigh the benefits (IPCC, 2007). The adverse impacts of climate change will be experienced earlier at lower latitudes, where most developing countries are located (Evans, 2009).
Anthropogenic Impacts on the World’s Climate
3
the chief responsibility for the production of GHGs lies with developed countries (as shown in Figures 1 and 2), developing countries bear the major burden posed by the risks of climate change due to a dearth of financial and institutional resources.
Figure 1: CO2 emissions by countries in 1990.
Source: Climate Analysis Indicators Tool by World Resources Institute
Note: Majority of the responsibility for CO2 emissions by EU countries falls on Germany, United Kingdom, Italy, France, and Poland. Approximately one-third of CO2 emissions for “Others” is produced by China and India but
both countries ranked 88th and 118th, respectively, for emissions per capita in 1990.
Figure 2: 1990 populations by country.
Source: Population Division of the Department of Economic and Social Affairs of the United Nations Secretariat, World Population Prospects: The 2006 Revision and World Urbanization Prospects: The 2007
Revision
United States
EU (27 countries)
Russian Federation
Canada, Australia, N. Zealand, Ukraine and Japan
Others
United States
EU (27 countries)
Russian Federation
4
Effects of Climate Change on Freshwater Availability and Quality
Temperature, precipitation, snowmelt, and sea level changes have both beneficial and adverse impacts on water availability and quality. Temperature is predicted to increase in most areas, but is mostly expected to increase more in inland areas and at higher latitudes, and an increase in rainfall variability is predicted for most regions (EPA 2011). The higher temperatures will increase loss of water through evaporation and thus reduce water availability. In arctic countries, increase in temperature will lead to reduced snow cover and increased water availability through melted snow. This melted snow could cause flooding in these countries and surrounding countries. However, the net impact on water supplies will also depend on changes in precipitation (including frequency, intensity, and timing of precipitation events). In areas where precipitation increase is projected, there may be no change or an increase in water availability. In other areas where precipitation decrease is projected, a decrease in water availability would occur, which could have adverse impacts on domestic, agricultural, and industrial use depending on amount available per capita. Increased temperature also leads to glacier melting which increases run-off. Increased annual run-off may favorably impact a variety of water users by increasing renewable water resources, but may simultaneously adversely impact communities by increasing flood risk (IPCC 2008).
5
Climate Change Impacts on Developing Countries
Developing countries are the most vulnerable to climate change impacts, due to the limited access to information, technology, institutions, financial, and educated human resources. Over the next decades, billions of people, particularly those in developing regions, will face water shortages, food insecurities, and greater health risks as a result of climate change. By 2020, up to 250 million people in Africa could be exposed to greater risk of water stress and over the course of the 21st century, millions of people in the catchment areas of the Himalayas and Andes face increased risk of floods from glacial melts, followed by drought as glaciers disappear (UNFCCC 2007). As of 2008, 884 million people lacked access to drinking water from improved sources, most of whom live in developing countries. Climate change is anticipated to adversely affect the ability of developing countries to improve their access to safe drinking water due to the unfavorable impacts climate change has started to have and will continue to have on water quality and availability in some parts of the world (WHO/UNICEF 2010). In other words, climate-change impacts on the timing, flow, and amount of available freshwater resources could affect the ability of developing countries to increase access to potable water.
The microbiological quality of water due to lack of sanitation and other factors is poor, and climate change effects, which could reduce the quality of water (e.g. contamination by flooding, reduced dilution during drought etc. ), could potentially further deteriorate the already poor quality of water. For example, as of 2008, open defecation was practiced by approximately 17% of the world’s population, most of whom live in developing countries (WHO/UNICEF 2010). Increased frequency and intensity of precipitation could transport feces and lead to higher pollution of water sources while reduced precipitation could potentially lead to reduced dilution in contaminated water sources.
6
(Vorosmarty et al. 2000). According to the United Nations World Urbanization Prospects, world population growth rate between 2010 and 2015 (5-year growth rate) is projected to be approximately 1.1%, with growth rate in more developed countries being 0.2% and growth rate in less developed countries being approximately 1.3% (UNPD 2007). Population growth places increasing demand on limited water resources and the majority of this growth is occurring in developing regions which are most vulnerable to climate change impacts and, thus, have more stress placed on the water systems.
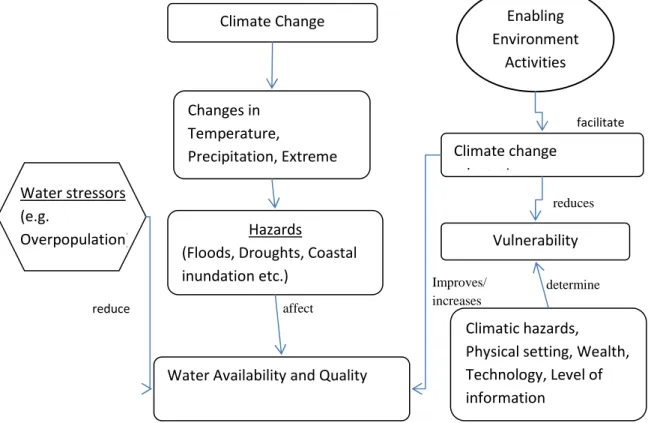
The flow chart below illustrates the relationships between key terms used in this paper.
Figure 3: Relationship between key terms used in the paper
Developing countries and their preparedness for climate change
The IPCC Fourth Assessment Report (AR4) states that “warming of the climate system is unequivocal, as is now evident from observations of increases in global average air and ocean temperatures, widespread melting of snow and ice and rising global average
Climate Change
Water stressors (e.g.
Overpopulation)
Changes in Temperature,
Precipitation, Extreme weather events, e.t.c
Climate change adaptation
Water Availability and Quality Hazards
(Floods, Droughts, Coastal inundation etc.)
Enabling Environment
Activities
facilitate
Vulnerability
reduce affect
Improves/ increases
reduces
Climatic hazards,
Physical setting, Wealth, Technology, Level of information
7
sea level” (IPCC 2007). It is necessary that countries are prepared to take the right measures to reduce the adverse effects of climate change and exploit the favorable effects of climate change. Preparedness refers to the presence or absence of planned and implemented policies and projects that reduce the vulnerability of a country’s water
resources to climate change and the adequacy of these policies and practices when
present. Vulnerability is the “degree to which a system is susceptible to, and unable to cope
with, adverse effects of climate change, including climate variability and extremes” and “is a function of the character, magnitude, and rate of climate change and variation to which a system is exposed, the sensitivity and adaptive capacity of that system (IPCC 2007).”
Changes in extreme precipitation events which are currently occurring, as well as other extreme weather events, make it critical that developing countries are resilient enough to withstand the adverse effects of climate change and take advantage of the favorable effects. Climate change has some favorable impacts and by being prepared, countries could make the most of these impacts. For example, increased precipitation in some areas could lead to improved groundwater recharge and employing artificial recharge measures can increase volume of water recharged, thus, increasing water availability. Also, rainwater harvesting could be carried out either at the household level or at the community level or both and would improve water availability, particularly during seasons of low rainfall. Taking action early could therefore, help to not only minimize adverse impacts but also optimize benefits of climate change on the environment.
Perceptions of developing countries regarding climate change
8
with regards to adapting to climate change impacts can be a function of the perception of climate change within that country. Although, developing countries are especially vulnerable to climate change impacts due to lack of adequate human, financial, institutional, and technological resources, knowledge and awareness (information) of climate change can also play a significant role in helping tackle climate change impacts. An accurate assessment of the perception of the risks of climate change by individuals of a country is only achievable by determining the current level of awareness of climate change and its potential impacts in a country. Education and awareness campaigns can then be carried out where needed.
Research Objectives
Two studies were carried out for this thesis. This paper presents information on preparedness of 20 developing countries with regards to climate change (First study) and on the level of awareness of climate change in Nigeria (Second study). Objectives of both studies are described below but the second study is presented in Chapter II.
Research Study I
Given the significance of climate change adaptation in developing countries, a study of national documents was carried out to determine the preparedness of developing countries in tackling climate change impacts on water resources. This review was the first portion of this study.
The objective of this section of the research was to:
• Determine what policies and practices are relevant in assuring sustainability of water resources in developing countries with projected climate change scenarios
9
• Determine the preparedness of 20 developing countries with regards to reducing the vulnerability of water resources to climate change effects based on a review of national documents that describe current and planned adaptation measures
Literature review, methods, results, and discussion are presented in the sections immediately following this introduction.
Research Study II
The importance of determining the level of awareness in a developing country led to research being conducted in Nigeria (one of the 21 countries studied to determine level of preparedness) for this purpose. This constitutes the second portion of this study.
The objective of this section of the research was to
• Assess the knowledge and attitudes of university students in Lagos and Akwa Ibom states in Nigeria
• Assess the knowledge, attitudes, and practices of ministry and agency officials in Lagos and Akwa Ibom states in Nigeria
• Compare knowledge and attitudes of both study populations
A thorough introduction to this research, literature review, methods, results, and discussion are presented in Chapter II – Climate Change Perceptions in Lagos and Akwa Ibom States which begins on page 69.
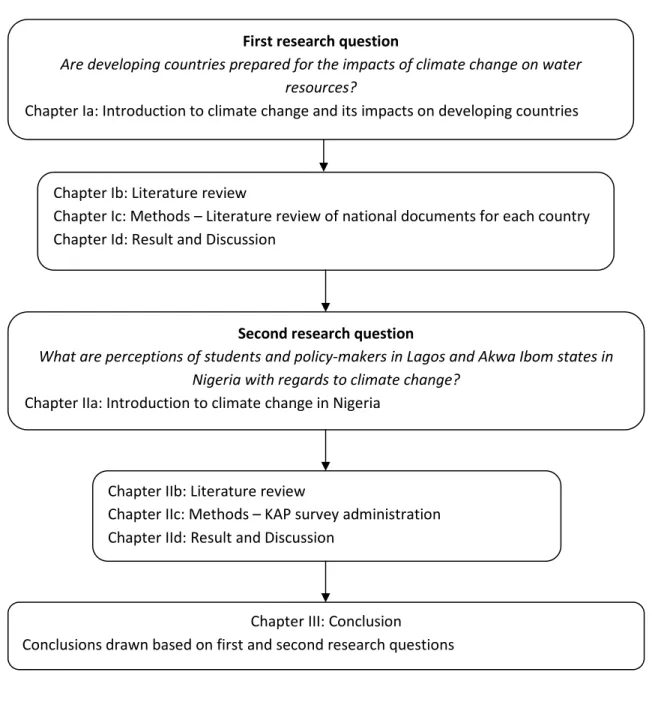
10 Figure 4: Structure of research paper
First research question
Are developing countries prepared for the impacts of climate change on water resources?
Chapter Ia: Introduction to climate change and its impacts on developing countries
Chapter Ib: Literature review
Chapter Ic: Methods – Literature review of national documents for each country Chapter Id: Result and Discussion
Second research question
What are perceptions of students and policy-makers in Lagos and Akwa Ibom states in Nigeria with regards to climate change?
Chapter IIa: Introduction to climate change in Nigeria
Chapter IIb: Literature review
Chapter IIc: Methods – KAP survey administration Chapter IId: Result and Discussion
Chapter III: Conclusion
11
b. Literature Review
Climate Change
Climate includes patterns of temperature, precipitation, humidity, wind and seasons. Climate change refers to the long-term shifts in the statistics of weather including its averages (NOAA, 2007). Climate patterns play a vital role in shaping natural ecosystems, and the human economies and cultures that depend on them. Because many systems are tied or related to climate (agriculture, wildlife, etc.), a changing climate can affect where and how people live by influencing land and water access and use, food production and water resource availability.
Global Climate Change Projections
Temperature
According to the IPCC (2007), an increase in global mean surface air temperature (SAT) is projected (for non-mitigation scenarios assessed) over the 21st century, and this increase is driven mainly by anthropogenic greenhouse gas concentrations. Geographical patterns of projected SAT warming show greatest temperature increases over land (roughly twice the increase in global average temperature). The multi-model mean SAT warming range for 2090 to 2099 relative to 1980 to 1999 is +1.1°C to +6.4°C for lower range of the best scenario Special Reports on Emission Scenarios (SRES) model (B11) and higher range of the worst scenario SRES model (A1F1). In terms of temperature extremes, it is very likely2 that heat waves will be more intense, more frequent, and longer lasting in a future
warmer climate.
1
Information on all scenarios can be found in the IPCC Fourth Assessment Report
2
12 Precipitation
The IPCC predicts that an increase in global average temperature would in all likelihood lead to changes in precipitation, and further projects an increase in global average precipitation during the 21st century; however, changes in precipitation will vary from region to region. The intensity of precipitation events is projected to increase, particularly in tropical areas that experience increase in average precipitation. In areas where mean precipitation is projected to decrease, precipitation intensity is projected to increase, but longer periods between rainfall events would occur (IPCC, 2007). Therefore, intense and heavy precipitation would be interspersed with longer relatively dry periods (drought). Wet extremes are projected to become more severe in many areas where mean precipitation is expected to increase, and dry extremes are projected to become more severe in areas where mean precipitation is projected to decrease (IPCC, 2007).
Sea level rise
Sea level is projected to rise between the end of the last century (1980 – 1999) and the end of this century (2090 – 2099) under different scenarios by a range of 0.18m (lower bound) to 0.59m (upper bound). In all scenarios, the average rate of sea level rise during the 21st century will very likely exceed the 1961 to 2003 average rate (1.8 ± 0.5mm per year). Sea level rise during the 21st century is projected to have considerable geographical variability (IPCC, 2007).
Uncertainties with climate change projections
Four sources of uncertainty associated with climate change projections are:
13
ii. Limitations of knowledge, modeling methodologies and computing: Knowledge of how Greenhouse Gases (GHGs) affect the Earth’s natural systems like the atmosphere and biosphere is imperfect, thus, thus the representations of these systems in models contain large uncertainties and assumptions.
iii. Future emissions scenarios: These emission scenarios are not predictions but instead separate storylines on how the world may develop. Although some scenarios appear to be more likely than others bearing in mind recent history and development paths, the IPCC is keen that no probabilities are assigned to any of its Special Report on Emission Scenarios (SRES) scenarios.
iv. Scaling: Representing local conditions that determine weather into the Global Climate Models (GCMs) and extracting local conditions from some models is very complex and can lead to uncertainties (Environmental Resources Management 2009).
14
Figure 5: Range of major uncertainties typically involved in impact assessments, showing the ‘cascade of uncertainty’ as these ranges are multiplied to encompass a comprehensive range of future possibilities.
Source: Modified from Jones 2000 and Schneider et al. 2002
Dealing with Climate Change
Adaptation and mitigation
With regard to climate change, there are ultimately three responses: Mitigation, adaptation, or “do-nothing.” Mitigation is the “technological change and substitution that reduce resource inputs and emissions (of GHGs) per unit of output (IPCC, 2007)” and adaptation is “the adjustment in natural or human systems in response to actual or expected climatic stimuli or their effects, which moderates harm or exploits beneficial opportunities.” The do-nothing approach refers to a business as usual approach where no efforts are made to change energy use, reduce emissions, or capture CO2, and environments are left as they are, rather than modified to improve resilience to climate change.
Harrington (2001) notes that the “do-nothing” option is only acceptable if the potential for harm from environmental changes falls within tolerable limits. However, climate change is already happening, and the adverse effects are being experienced in some regions. With
Carbon Cycle Response
Global Climate Sensitivity
Regional Climate Change Scenarios
Country Climate Change Scenarios
Range of Possible Impacts Emission
15
increased rainfall variability and temperatures, food productivity is threatened, water availability and quality are compromised, and there are increased risks to public health. According to Stern (2006), it is clear that a business-as-usual approach will only lead to dangerous territory. Therefore, the impracticality of a do-nothing approach means only the other two options are available for dealing with climate change.
Adaptation as a strategic response to climate change has only recently begun to receive greater consideration, so it is much less developed than mitigation as a policy response (Bosello et al., 2009; Burton et al., 2002). Bosello et al. (2009) observe that the difficulty of implementing mitigation policies, along with the increasing awareness of climate inertia, eventually made adaptation a possible response to climate change. Adaptation is viewed as a powerful tool in reducing the adverse effects of climate change and taking advantage of the favorable impacts. Some would even argue that adaptation is a superior response strategy to climate change than GHG emissions reduction, although there is limited evidence to back this claim (Tol et al., 1998). The most significant difference between mitigation and adaptation is that mitigation policies contribute to the global good whereas adaptation is only valuable in societies that adapt (Michaelowa, 2001).
16
research on adaptation is relatively less advanced than that on mitigation, the need for adaptation, and not just mitigation, is increasingly being recognized.
Vulnerability of developing countries with regards to climate change
All human societies are sensitive to climate because of the dependence of elements of human survival (food, water, forests etc.) on the climate. However, not all societies will be impacted by climate change in the same way. Knowledge about climate change impacts and vulnerability is accumulating, although the complexity of the problem (uncertainties), and the lack of empirical material, is hindering its progress (Fankhauser et al., 1999). It is a well-established fact that developing countries are disproportionately affected by climate change (e.g. Mirza, 2003; Rosenzweig et al., 1994; Gleick, 1989; Leary et al., 2007).
Vulnerability to climate change is determined by a variety of factors, including exposure to hazards, availability of resources, and entitlement of individuals and groups to call on these resources, in other words, by the ability to adapt (Adger, 2003). In addition, vulnerability is spatially variable, as it reflects local economic, social, and cultural characteristics, as well as physical settings (Sullivan et al., 2009).
The impacts of climate change are expected to be more severe in developing countries for several reasons, including, but not limited to, the following:
• The physical impacts of climate change are expected to be relatively large in developing countries, since precipitation is not likely to increase as is expected in many high-latitude regions, and increases in temperatures will lead to large evaporation losses (Christensen et al., 2007).
• Economic and technical capacity to adapt to climate change is limited in these countries (Mertz et al., 2009).
17
• Lack of adequate/educated human resources. Developing countries contain 80% of the world’s population but 25% of the world’s scientists, and only 4% of total world research is conducted in developing countries (Leary et al., 2003).
• Climate change is only one of the numerous environmental problems faced by developing countries, many of which are also facing overpopulation, rapid urbanization, and resource depletion (McGuigan et al., 2002).
Vulnerabilities and adaptation strategies are linked to the development of poverty reduction strategies in developing countries (Halsnaes et al., 2009). According to Mertz (2009), this process has been primarily donor-driven because many developing countries do not consider climate change as one of their greatest concerns. More immediate needs for economic growth and poverty reduction take priority. However, some developing countries, particularly small island nations and least developed countries, have insisted on the need for adaptation from the onset of climate change negotiations (Burton et al., 2002). This is a significant step because climate change will have adverse effects not just on the environment but on the economy of developing countries, and it promises to widen the inequity gap between the rich and poor within and across countries (UNDP, 2007; McMichael et al., 2008). For example, in cities in developing countries, the poorest live in unplanned squatter dwellings, often located in flood plains which represent the only available place or a source of fertile agricultural land (McGuigan, 2002). Vulnerability to climate change will, therefore, be further increased in developing countries if appropriate measures are not taken to tackle the impacts of climate change.
Vulnerability of water resources to climate change
18
supply and quality for domestic, irrigation, recreational, industrial, and aquatic ecosystem uses.
It is estimated that, by 2025, approximately 5 billion people, of the projected 8 billion in the world at the time, will be living in countries experiencing water stress (Arnell, 1999). This water stress will not be caused by climate change but by other water stressors, particularly economic and population growth (Zimmerman et al. 2008). However, climate change could impose additional pressure on water resources. According to Arnell (2004), with climate change, there will be between 53 and 206 million people moving into the water stressed category and between 374 and 1661 million are projected to experience an increase in water stress under different scenarios.
This change in water stress in different regions occurs as a result of the different effects climate change is having and will have on water resources around the world. Changes in precipitation, runoff patterns, sea level rise, and land use and population shifts that may result from these effects will have both beneficial and adverse effects on water resources. Warmer temperatures will accelerate the hydrologic cycle, altering precipitation, the intensity and frequency of floods and droughts, and the magnitude and timing of runoff (Frederick et al., 1997).
The effects climate change will have on water resources are:
• Saline water profiles in deltas and river mouths pushed further inland and coastal aquifers facing an increased threat of saltwater intrusion as a result of sea level rise and storm surges (Frederick et al., 1997).
19
• Worsening water quality as a result of increased transport of sediments and toxic substances into water bodies, for regions that experience precipitation increase (Fisher, 2000).
• Reduced water availability as a result of increased number of extreme drought events. The number of extreme drought is projected to increase by a factor of two by the 2090s (Burke et al., 2006).
• Decrease in groundwater recharge as a result of increased surface runoff from more frequent intense precipitation (BGR, 2008).
• Increased water availability in areas that receive more frequent rainfall.
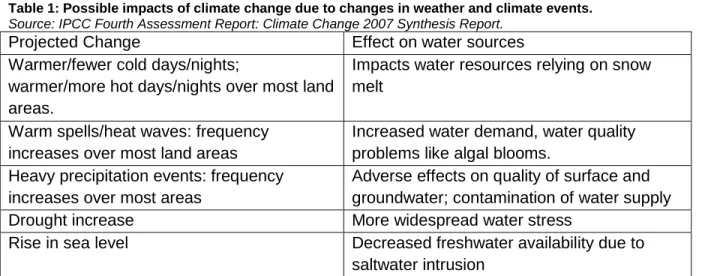
The table below is adapted from the IPCC Fourth Assessment Report and lists effects of climate change on water sources under different climatic conditions.
Table 1: Possible impacts of climate change due to changes in weather and climate events.
Source: IPCC Fourth Assessment Report: Climate Change 2007 Synthesis Report.
Projected Change Effect on water sources
Warmer/fewer cold days/nights;
warmer/more hot days/nights over most land areas.
Impacts water resources relying on snow melt
Warm spells/heat waves: frequency increases over most land areas
Increased water demand, water quality problems like algal blooms.
Heavy precipitation events: frequency increases over most areas
Adverse effects on quality of surface and groundwater; contamination of water supply
Drought increase More widespread water stress
Rise in sea level Decreased freshwater availability due to
saltwater intrusion
Why Developing Countries need to Adapt to Climate Change
20
for adaptation in developing countries stems from the following current and projected impacts climate change is having and will have on these countries:
• Decreases in crop yields as a result of decreased precipitation. Under similar scenarios, crop yields are expected to increase in developed regions (Parry et al. 2004).
• Increased population at risk of water stress in Africa. By the 2020s, approximately 75-250 million people will be at risk of increased water stress under different scenarios (Arnell 2004).
• In Latin America, approximately 12 to 81 million people will experience increased water stress in the 2020s (Arnell 2004).
• Approximately 1 billion people in South, South-East, and East Asia would face increased risks from reduced water supplies (IPCC, 2007).
• Sea level rise threatens not just water quality but also the lives of millions of people that live in coastal areas. In China, almost 60% of the population reside in coastal provinces, and of the 200 million people in Indonesia, 130 million live on the main island of Java (Hinrichsen, 1999).
The list of impacts presented above is not an exhaustive list of the impacts climate change will have on developing countries. It should be noted that the above impacts are a generalization, as there will be variations within continents.
Possible Adaptation Policies for Water Resources in Developing Countries
21
under current climatic conditions (Scheraga et al. 1998). Also, it should be noted that adaptation measures can have adverse effects if measures are employed without consideration for interdependent systems (Scheraga et al. 1998). For example, building seawalls can built to protect coastal property from sea level rise but seawalls prevent new wetlands from forming and wetlands are useful for flood control among other things (Scheraga et al. 1998). This will ultimately increase the risks of these other systems to climate change. Based on these categories, the following adaptation policy options have been proposed in different literature:
• Incorporate climate change into long-term planning. The catastrophic impacts of climate change and the long-term effects due to inertia of the climate system makes this a high priority policy option (Smith et al., 1996).
• Disaster relief and hazard reduction. With increasing intensity and frequency of extreme weather events, this policy option should be high priority in disaster prone countries. This policy would likely have net benefits under current climate because risks from disasters would be reduced (Smith et al., 1996).
• Water conservation and contingency planning for drought. Due to the likely increase in the frequency of droughts in many regions, drought early warning and preparedness should be a priority. (Smith et al., 1996; Downing et al., 1997)
• Contingency planning in the event of floods (Madzwamuse, 2010). An increase in rainfall variability is projected to lead to more frequent floods. Although floods can have adverse effects on water resources, with effective water management techniques (reservoirs, increasing storage capacities of storage containers etc.), some benefits can be garnered (Downing et al., 1997).
22
formulation of the national rainwater harvesting policy in Botswana, as rainwater harvesting was seen as an important aspect of adaptation (Omari, 2010).
• Enhance cooperation among states and countries with shared water bodies (Madzwamuse, 2010). Climate change may cause a direct shortage of water and/or lead to the degradation of water resources shared by communities, states or countries (Gleick, 1989). Hence, cooperation amongst those who share water bodies is vital.
• Cross-sector collaboration. Cross-sector collaboration and coordination is essential in planning and implementing climate change responses because the impacts of climate change span several sectors (AFCC, 2010).
Above are a number of policy/adaptation recommendations for reducing the adverse impacts of climate change and taking advantage of the favorable impacts. The choice of policy options is determined by several factors including confidence in local climate projections, alternative policy choices, and future benefits from adaptation measures (Mertz et al., 2009; Burton et al., 2002; Mendelsohn, 2000).
Status of Preparedness with regards to climate change adaptation in Developing Countries
23
impacts on water resources. However, according to the reports, there are still practices that can be undertaken by countries to reduce vulnerability and increase preparedness (Chagutah, 2010; Madzwamuse, 2010; Omari, 2010).
Ikeme (2003) examined the preparedness of sub-Saharan Africa with regard to climate change adaptation and found that the region was not prepared for climate change. He used a framework for assessing the adaptational preparedness of a region developed by Fankhauser et al. (1999) which considered three elements: Timely recognition of the need to adapt, incentive to adapt, and the ability to adapt. According to the research, Ikeme concluded that sub-Saharan Africa was not prepared because there was a lack of recognition of the need to adapt, poor incentive to adapt, and low capacity to adapt.
Although adaptation has only been recently gaining greater recognition as a plausible component of the total strategy for dealing with climate change, it is needed. Adaptation ensures proper preparedness, such that a country that has put in place adequate adaptation policies will be better prepared to eliminate or cope with the adverse impacts of climate change, while taking advantage of the positive effects of such natural processes.
Summary
Climate patterns play a vital role in shaping natural ecosystems, and the human economies and cultures that depend on them. Because many systems are tied or related to climate (agriculture, wildlife, etc.), a changing climate can affect where and how people live by influencing land and water access and use, food production and water resource
availability. Climate change is already happening, and the adverse effects are being experienced in some regions. All human societies will be impacted by climate change; however, developing countries will be disproportionately affected due to their limited adaptive capacity. Therefore, adaptation is needed to reduce the adverse impacts and exploit the beneficial impacts of climate change. There is a need for adaptation in
24
25
c. Methods
Twenty-one countries (identified below) are used in the analysis of the preparedness of developing countries with regards to adapting water sources (surface and groundwater sources) to climate change effects. These countries are located in three different continents and have varying topographies and climates. Countries used in the assessment were Bangladesh, Cambodia, Cape Verde, Chad, China, Ethiopia, Eritrea, Guatemala, Haiti, Indonesia, Iraq, Madagascar, Nepal, Nicaragua, Nigeria, Pakistan, South Sudan, Sudan, Syria, Vietnam, and Zambia.
Country Selection
Country selection was based on water availability and current climate change impacts in the countries. Available evidence indicated that all countries will be adversely affected, to some extent, by the impacts of climate change. Also, many of the countries (10 of 20) are currently either “water vulnerable” or “water stressed.” The countries selected all have the following characteristics and were chosen by out funding agency:
• They are susceptible to the water related hazards associated with climate change; • They are countries with low drinking water coverage;
• They are countries with high global disease burden; and
• They are countries in which the funding agency’s WaSH staff were actively interested in the project
Country Assessment
26
CC) reports amongst others. Online databases like the Global Environmental Facility (GEF) were also used in the assessments. These documents were used to assess climate change projections for all countries as well as the presence and efficacy of enabling environment activities that prepare the country to deal with the effects of climate change (Details on these assessments are presented in the Enabling Environment and Climate, Climate Change Projections, and Hazards sections in this Chapter).
Enabling Environment activities
An enabling environment refers to a set of interrelated conditions—such as legal, bureaucratic, fiscal, informational, political, and cultural—that impact on the capacity of
…development actors to engage in development processes in a sustained and effective
manner (Brinkerhoff 2004). Presence of a number of enabling environment activities
(presented below in the Enabling Environment activities identification section) was used to determine preparedness. The classes of conditions addressed in this paper are socio-cultural (e.g. supporting vulnerable groups like children and women) and informational (e.g. building institutional capacity). Creating an enabling environment that supports climate change adaptation is vital to achieving long-term, effective and sustainable water supply and quality.
Enabling Environment activities identification
27
communities, regions, and sectors due to the interconnectedness of climate related issues, and in-built flexibility in the country to adjust to the likely deviations due to the uncertainties present in climate change projections. The enabling environment activities identified have at least one of the characteristics listed.
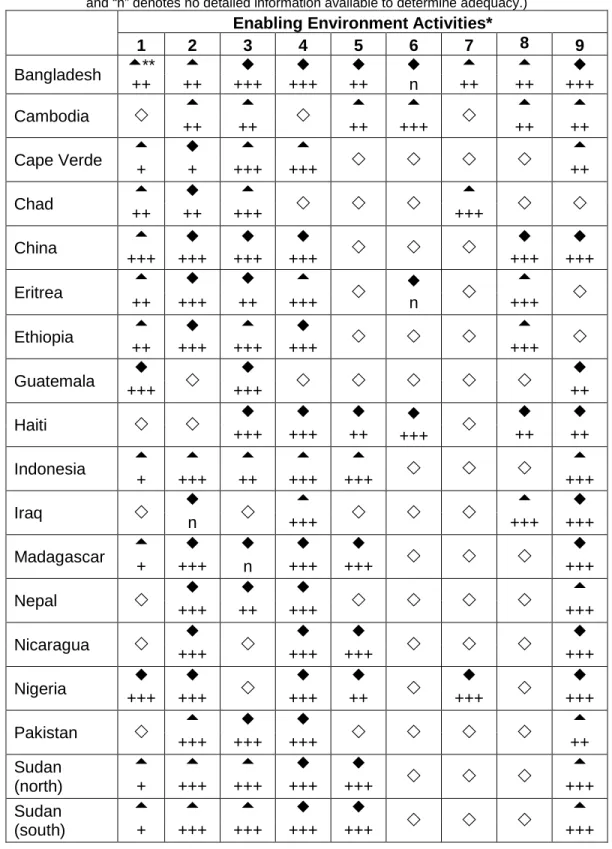
Nine enabling environment activities that are important in improving informational capacity of the countries, developing human and institutional capacity (capacities generally lacking in developing countries), and reducing equity issues were identified. Identification was achieved through literature search of current policy options and current needs for effective adaptation that achieve the objectives presented in the preceding sentence. These activities are relevant in ensuring effective adaptation of water resources to climate change. The enabling environment activities listed below were gathered from the list presented in the Possible Adaptation Policies for Water Resources in Developing Countries sub-section of
the Literature Review section above. According to Burton et al. (2006), for adaptation policy to be effective, some requirements need to be met. One of these is improved informational capacity. This was not part of the list but is seen as relevant so an activity that achieves this was added. The enabling environment activities are summarized below based on their significance in ensuring continuous availability of safe drinking water in communities in a changing climate. The nine enabling environment activities are:
1. Enhance adaptive capacity of poor and vulnerable (e.g. children) populations to ensure equity amongst all people
28
ensuring these communities have access to alternative water supplies and increasing the capacity of individuals through training workshops and other actions.
2. Raise awareness of climate change on national, regional, and community levels Climate change preparedness requires the initial awareness of climate change and its effects on water resources. It is vital that individuals in different regions (rural and urban) and decision makers at all levels (community, regional, and national) are informed about climate change risks so that they can take necessary precautions to reduce the vulnerability of water resources to climate change effects.
3. Incorporate Disaster Risk Reduction (DRR) agenda into programmes
An increase in the frequency and intensity of extreme weather events is projected globally due to climate change. This occurrence, which is currently being experienced by numerous countries, whether as an effect of climate change or not, makes the presence of DRR systems essential. An example includes early warning systems which can aid in preparing communities for the onset of a disaster, and thus, protect their water resources.
4. Enhance research on climate change adaptation
Although there exists uncertainties in climate change prediction, credible or probable hazards can be determined from collating a number of climate change scenarios from reliable sources (as was done in Table 3) to help aid in determining effective adaptation policies and practices to carry out. Also, most countries analyzed in this paper are already experiencing increased frequency of extreme events. Conscious research into effective adaptation programs is needed to ensure adequacy of any policies or programs employed.
5. Integrate climate change into planning, design, and management of water resources and supply
29
drastically, an approach that looks at climate change projections, rather than historic data, is required in designing and managing these resources, because climate change can render obsolete design assumptions using historic climate data. This required approach will also benefit present generations, since an increase in extreme weather events is already being experienced.
6. Diversify and adapt water resources used in water supply
Climate change is currently having adverse impacts on water resources, reducing availability (longer droughts and more intense rainfall) and degrading water quality (salinization of groundwater sources). Alternative sources (for example rainwater) may need to be introduced to reduce vulnerability because one source may not be reliable during all seasons.
7. Enhance cross-sector collaboration (e.g. water, health, and agriculture) in climate change adaptation planning
Climate change is expected to exacerbate current stresses on water resources (IPCC 2007). One of these stresses is over-abstraction by the agricultural sector, which will also be affected by climate change. A cross-sectoral collaboration is required among sectors to ensure that policies and programs employed achieve maximum benefit with minimum stress on the environment. If this activity is not employed, goal conflict might arise; that is, an adaptation practice employed by a sector might curb another sector’s progress or aggravate a problem.
8. Incorporate climate change adaptation into emergency preparedness and response planning (EPRP)
30
will minimize redundancy and ensure that relief programmes are comprehensive, addressing key areas like safe water provision.
9. Capacity building and institutional strengthening
Climate change will introduce burdens on water resources never before considered, and the ability of a country to prepare for these additional burdens is dependent on the financial, technical, and human resources available in different institutions and to different individuals and communities. Critical targets for capacity building and institutional strengthening include water ministries, community organizations, regional and local government, among others.
The literature on country-level programming was assessed for evidence of planning and/or implementation of these nine activities and adequacy of the activities when present. Primary documents used for this analysis include NAPAs, INCs, GEF database, and Adaptation Learning Mechanism website.
• The NAPAs are documents submitted to the UNFCCC that take into account existing coping strategies at the grassroots level, build upon that to identify priority activities, and are focused on urgent and immediate needs (UNFCC 2011). These documents assess the vulnerability of the country to current climate variability and extreme events, investigate where risks would increase due to climate change, identify key adaptation measures as well as criteria for prioritizing activities, and present a selection of a prioritized short list of activities.
• The INCs are documents required from all Parties to the UNFCCC and include data on country-level anthropogenic emissions, measures to adapt to climate change, and measures to mitigate climate change (UNFCCC, 2004).
31
• Adaptation Learning Mechanism (ALM) website (a website put together by GEF, UNFCCC, United Nations Development Programme (UNDP), The World Bank, United Nations Environment Programme (UNEP), the Food and Agriculture Organisation of the United Nations (FAO), and Gateway to the UN System’s Work on Climate Change) contains information on country programs.
The documents for each country and the database were studied for evidence of each of the nine enabling environment activities listed above. The chapters in these documents are generally divided into country background, country GHG emissions, country level climate change projections, current and possible adaptation measures, awareness activities, and priority projects. These chapters were specifically reviewed and keyword searches for words like “research”, “awareness”, “adaptation” also aided in the review of the documents. The documents for all countries had similar chapter breakdown so review for all countries were similar. Future projects or planned activities were mainly found in the list of priority projects recorded in the NAPAs. The activities being planned or implemented in each country are included below in the “Results and Discussion” section. Because this study focuses on adaptation and not mitigation, chapters in the NAPAs and INCs on GHG emissions and mitigation procedures were not studied. Country documents that were in languages other than English were given to individuals who could speak those languages and the above protocol was given to them for the document review. Also, google translate was used a secondary translation mechanism.
Enabling Environment activities adequacy assessment
32
• The activity addressed all hazards pertinent to this study (floods, drought, and coastal inundation) the country is exposed to, particularly the hazard the country is most frequently exposed to (hazard identification presented below).
• Programs or projects exist or are planned specifically to achieve an activity’s objective. For example, are there programs specifically aimed to enhance cross-sector collaboration like the founding of a climate change committee comprised of actors from different sectors.
• The activity was focused on the entire population rather than just a subset of the population.
Programs were found to be adequate when fulfilled at least two of the criteria above, partially adequate if they fulfilled one, and inadequate if they fulfilled none or if activities were absent in the countries. Detailed information on projects and programs could generally be found in the NAPAs and when detailed information was not found in the NAPA, an internet search of the program name was carried out in order to determine adequacy of activity. The name of the program was put in a search engine and information on the program was obtained. Program details were studied to determine if the criteria listed above were satisfied. For some programs, detailed information could not be found so an adequacy assessment could not be made as is noted in the “Results and Discussion” section.
Country Comparison
33
• GDP: The GDP is the value of all final goods and services produced in a country in a year and can be measured by adding all of an economy’s incomes, expenditures, and net exports (World Bank, 2004). According to the World Bank, the countries in this study fall into 3 income groups: upper middle income (China), lower middle income (Cape Verde, Guatemala, Indonesia, Iraq, Nicaragua, Nigeria, Pakistan, Sudan, Syria, Viet Nam, and Zambia), and low income group (Bangladesh, Cambodia, Chad, Eritrea, Ethiopia, Haiti, Madagascar, and Nepal). The GDP was chosen to determine if a country’s wealth is related to its preparedness to adapt to climate change.
• HDI: The HDI is an index that measures the average achievement in three basic dimensions of human development — a long and healthy life (health), access to knowledge (education), and a decent standard of living (income). The higher the number, the better the achievement in these three dimensions. Fussel (2009) noted in the World Development Report that based on a multi-criteria evaluation, the human development index outperforms several indices as a generic national level index of social vulnerability to climate change. The HDI was chosen for this reason and also because, if there is clear relationship between presence of activities and HDI, it may be attributed to education or income, two of the basic dimensions of HDI.
34
developed countries account for 15%of exposure to hazards but only 1.8% of the casualties (Peduzzi et al., 2002; Peduzzi et al., 2009). The DRI was chosen to understand if there was a link between vulnerability to hazards and preparedness.
Hazard Identification
In determining the preparedness of countries for tackling the effects of climate change, identification of hazards that are relevant to each country is essential in concluding on the adequacy of policies and programs. Hazards were determined based on current climate, climate change projections, and physiographic regions of each country. The hazards addressed in this study include floods (due to increased rainfall intensity and frequency), drought (due to decreased rainfall frequency, particularly during seasons of low rainfall), and coastal inundation (due to sea level rise, storms, cyclones, tidal surges). Coastal inundation does not apply to regions without a coastline. The hazards chosen represent wet climate conditions (flooding), dry climate conditions (drought), and climate conditions that affect a substantial population of the world (coastal inundation).
Climate and Climate Change Projections Analysis
35
projections, and country-level climate change projections from sources other than the IPCC (for example, NAPAs).
36
d. Results
Regional and Country-level Climate Change Projections
The preparedness of individual countries in tackling the effects of climate change and, thus, reducing the vulnerability of the water resources of the countries to these effects is based on a practical estimation or interpretation of the climate change effects to which individual countries are susceptible. Climate change projections for individual countries gathered from three major sources: the IPCC Fourth Assessment Report, Met Office Hadley Centre report, and country level documents like NAPAs and INCs are presented below.
37
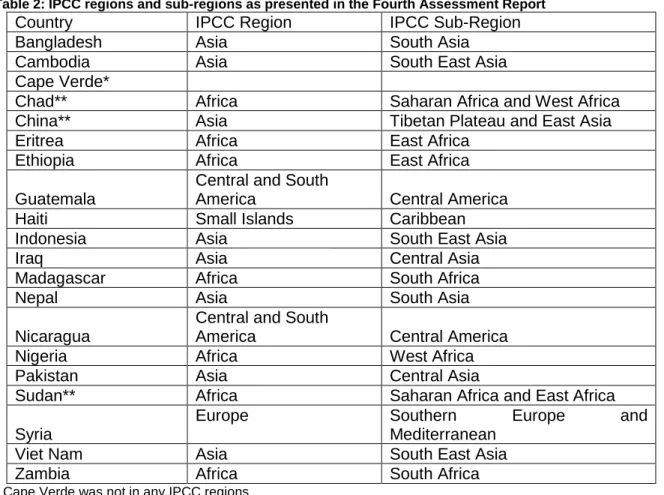
Table 2: IPCC regions and sub-regions as presented in the Fourth Assessment Report
Country IPCC Region IPCC Sub-Region
Bangladesh Asia South Asia
Cambodia Asia South East Asia
Cape Verde*
Chad** Africa Saharan Africa and West Africa
China** Asia Tibetan Plateau and East Asia
Eritrea Africa East Africa
Ethiopia Africa East Africa
Guatemala
Central and South
America Central America
Haiti Small Islands Caribbean
Indonesia Asia South East Asia
Iraq Asia Central Asia
Madagascar Africa South Africa
Nepal Asia South Asia
Nicaragua
Central and South
America Central America
Nigeria Africa West Africa
Pakistan Asia Central Asia
Sudan** Africa Saharan Africa and East Africa
Syria
Europe Southern Europe and
Mediterranean
Viet Nam Asia South East Asia
Zambia Africa South Africa
* Cape Verde was not in any IPCC regions
** These countries span more than one IPCC sub-region
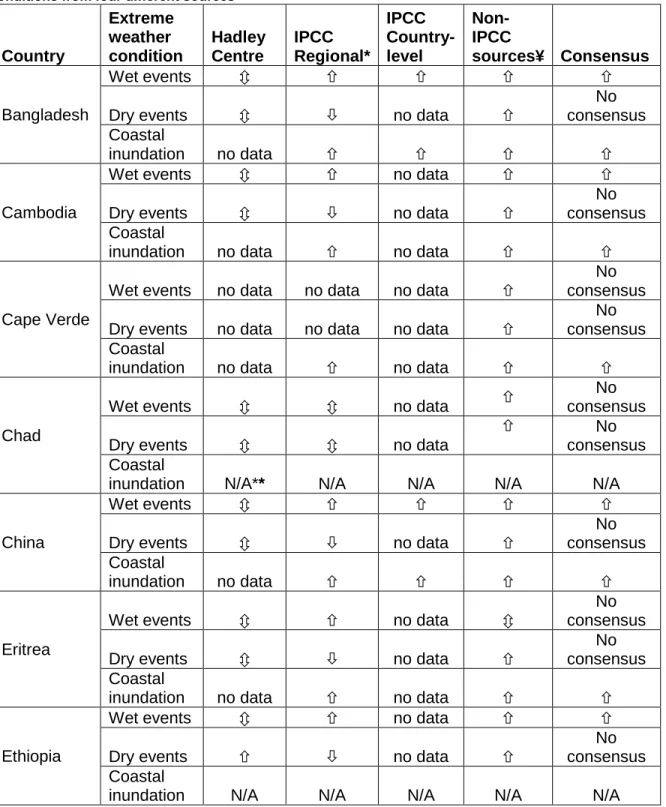
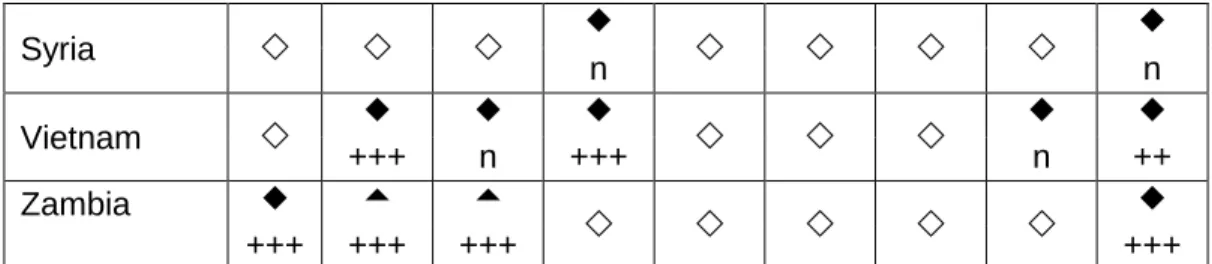
The table below illustrates climate change information for each of the countries. An “up” arrow () represents an increase in a particular extreme weather condition, a “down” arrow () represents a decrease in a particular extreme weather condition, and an “up and down” arrow () represents a possible increase or decrease in a particular weather condition. The extreme weather conditions presented in this report are:
• Wet events – which represent intense precipitation
• Dry events – which represent longer and more intense drought
38
and/or storms and cyclones is present. Cape Verde was not represented in the precipitation projection maps in the Hadley report, which explains the absence of information for Cape Verde. The determination of a consensus is explained in the Methods section.
Table 3: Projected changes in the frequency and/or intensity of three categories of extreme weather conditions from four different sources
Country Extreme weather condition Hadley Centre IPCC Regional* IPCC Country-level Non-IPCC
sources¥ Consensus
Bangladesh
Wet events
Dry events no data
No consensus Coastal
inundation no data
Cambodia
Wet events no data
Dry events no data
No consensus Coastal
inundation no data no data
Cape Verde
Wet events no data no data no data
No consensus Dry events no data no data no data
No consensus Coastal
inundation no data no data
Chad
Wet events no data
No consensus
Dry events no data
No consensus Coastal
inundation N/A** N/A N/A N/A N/A
China
Wet events
Dry events no data
No consensus Coastal
inundation no data
Eritrea
Wet events no data
No consensus
Dry events no data
No consensus Coastal
inundation no data no data
Ethiopia
Wet events no data
Dry events no data
No consensus Coastal
39 Country Extreme weather condition Hadley Centre IPCC Regional* IPCC Country-level Non-IPCC
sources¥ Consensus
Guatemala
Wet events no data
no data No
consensus
Dry events no data
no data No
consensus Coastal
inundation no data no data no data
No consensus
Haiti
Wet events no data
No consensus
Dry events no data
Coastal
inundation no data no data
Indonesia Wet events Dry events No consensus Coastal
inundation no data
Iraq
Wet events no data no data
No consensus
Dry events no data no data
No consensus Coastal
inundation N/A N/A N/A N/A N/A
Madagascar
Wet events no data
No consensus
Dry events no data
Coastal
inundation no data no data
Nepal
Wet events no data
Dry events no data
No consensus Coastal
inundation N/A N/A N/A N/A N/A
Nicaragua
Wet events no data
No consensus
Dry events no data
Coastal
inundation no data no data
Nigeria
Wet events no data
No consensus
Dry events no data
No consensus Coastal