DEEP
LEARNING
& IDEOLOGICAL
RHETORIC
Brice D. L. Acree
A dissertation submitted to the faculty of the University of North Carolina at Chapel Hill in partial fulfillment of the requirements for the degree of Doctor of Philosophy in the Department of Political Science.
Chapel Hill 2016
Approved by:
James Stimson
Thomas Carsey
Michael MacKuen
Justin Gross
c
2016
ABSTRACT
Brice D. L. Acree: Deep Learning & Ideological Rhetoric. (Under the direction of James Stimson)
Political conflict unfolds in language. To understand the quest for, and exercise of, power,
we must understand political speech. For more than a decade, political methodologists have
sought to develop methods for using language to study how politicians speak to the public, to
the media, and to each other. This dissertation advances that line of research. Chapters 2 and
3 address ‘deep learning’ methods for analyzing political texts. These computational models,
built on artificial neural network architectures, seek to automatically learn complex patterns in
data. Chapter 2 introduces basic deep learning models, and Chapter 3 introduces distributional
word representations and convolutional neural network models. The final chapter points these
methods toward a substantive problem. As a discipline, we have studied, and debated, the
nature of political ideology. We have often found that, for citizens and elites alike, ideology is
oriented around a single primary dimension: liberalism to conservatism. In Chapter 4, I offer
a different view. Using the language from political ideologues and presidential candidates, I
show that ideology can be much richer and varied than a single dimension will capture, but
for Lauren
ACKNOWLEDGMENTS
North Carolina—land of the pines, the Tar Heels, and the craftiest ales brewed from that
per-nicious and wicked weed—is the only place I could imagine embarking on this epic quest we
call graduate school. I could say that I have beenfortunate to study here, but that hardly
ex-presses the magnitude of my appreciation. I only hope that I can convey, in measures equal to
my gratitude, how thankful I am for those people who have shown me uncommon support and
friendship, and without whom I could not have sustained this project.
The department of political science at the University of North Carolina has provided
fer-tile ground for graduate work. In particular, I thank the American Politics Research Group for
their feedback, which sharpened my ability to clearly build and express arguments. I am also
indebted to the graduate students for whom I had the pleasure to TA. They had to hear me roar
the virtues of Bayesian inference week in and week out, and somehow never charged the white
board in mutiny. Their patience and feedback taught me how to explain technical material,
which I hope is apparent in the work that follows.
Two groups of scholars provided the data used in this dissertation. I had the privilege to
work with Justin Gross, Noah Smith, and Yanchuan Sim on building and refining the Ideological
Books Corpus. The ReactLabs data was kindly shared by Amber Boydstun, who collected the
data with Philip Resnik and Jeffrey Korn.
I owe my growth as a scholar to an incomparable group of advisors. Dean Lacy, for reasons
surpassing my understanding, thought I might succeed in graduate school, and encouraged me
to apply to doctoral programs. Philip Paolino, my first graduate advisor, sparked my interest in
statistical methodology, introduced me to Bayesian inference, and most importantly, taught me
that methods are a means to an end, not the end in themselves. Michael MacKuen and Timothy
beyond the methodological minutiae and think in terms of broader, theoretical contributions.
Justin Gross bears the most responsibility for my discovery of, and love for, computational
text analysis. He included me in his research during my first semester, and sent me on a path to
where I stand now. Thomas Carsey, too, deserves a share of the blame. He invited me to enroll
in a machine learning course he was auditing (which he promptly stopped auditing after a few
weeks). Tom encourages and challenges in equal measure, and he works harder on behalf of his
students than anyone I have met. Most of all, I owe a lifetime of thanks to my advisor, mentor,
and harshest critic, Jim Stimson. You can paint stripes on a toad, but that does not make it a
tiger. Jim does not hesitate to tell you when you’ve sent him a toad of a paper, no matter the
prose with which you’ve dressed it. Jim’s feedback has made me a better scholar by pushing me
to lay bare my assumptions, to express my arguments clearly, and to place periods inside the
quotation marks.
That understates Jim’s greatest contribution to this dissertation, however. Why is it that
when someone builds a wall, somebody else immediately needs to know what’s on the other
side? Why else? Curiosity. Discovery. Jim’s work is genuinely motivated by the thrill of
discover-ing somethdiscover-ing heretofore unknown, and shardiscover-ing it with others. That much was obvious durdiscover-ing
our first meeting, and it was contagious. Jim instills in his students an appreciation for broad
thinking and diverse ideas, insisting that we do not reap what we do not sow. As his student, I
have learned to sow many ideas, and this dissertation sees some of those grown to fruition.
My many friends, from Carolina and locations beyond, have supported me in ways large
and small. I especially owe thanks to Kelsey Shoub, my partner in methodological crime; to Eric
Hansen and Andrew Tyner, whose penetrating questions early in the dissertation process made
me think seriously about my role in, and contribution to, the discipline; to Aziz and Ashaya, my
soundtrack when the nights were dark and full of doubts; to Chelsea Estancona, Dan Gustafson,
Ryan Williams, and Rob Williams, for their support on and off the basketball court; and to Chris
Finally, I reach that highest pantheon of my gratitude: those who have loved me
uncon-ditionally throughout this process. My wife, Lauren Milam Acree, has born the weight of this
dissertation as much as I. She has ceaselessly encouraged and supported my research. Lauren’s
kindness is woven through the document you are about to read, and without her this thesis
would surely have never come together. My father Doug, my brother Addison, and my
grand-mother Shirley have been unfailing pillars in my life, without whom I would not have reached
graduate school in the first place. And I thank my grandfather Robert, and my uncle Scott, who
would have been proud of this accomplishment. I wish they could read my dissertation—or at
least skim a few pages before wondering aloud ‘What’s this have to do with politics, anyway?’.
Theodor Geisel, better known by thenom-de-plumeDoctor Seuss, once asked, “My
good-ness how the time has flewn; how did it get so late, so soon?” This dissertation represents the
culmination of many years, and the contributions of many friends and colleagues. My mantra
in writing this project was to keep looking forward—that if I look back, I am lost. At the end of
the journey, as I write these acknowledgments, I now pause to look back. So many people have
helped to get me to this place. I cannot possibly pay my debts to them, but I will strive to be
TABLE OF CONTENTS
1 INTRODUCTION. . . 1
1.1 Political Text Classification . . . 2
1.2 Contribution . . . 4
1.2.1 Methods Contribution. . . 5
1.2.2 Substantive Contribution . . . 9
1.3 The Challenges of Text. . . 11
1.4 Processing & Preparing Text for Analysis . . . 14
1.4.1 Bag of Words . . . 14
1.4.2 Preserving Word Order . . . 18
2 DEEP NEURAL NETWORKS FOR TEXT CLASSIFICATION . . . 22
2.1 Neural Network Models . . . 24
2.1.1 Neural Network Basics. . . 25
2.1.2 Richer Networks . . . 28
2.2 Model Specification . . . 35
2.2.1 Model Evaluation. . . 36
2.2.2 Loss & Evaluation . . . 37
2.2.3 Number of Nodes & Layers . . . 38
2.2.4 Overfitting . . . 39
2.2.5 Activation Functions . . . 40
2.2.6 Learning Rate . . . 41
2.4 Applications . . . 45
2.4.1 Political Tone . . . 45
2.4.2 Political Ideology . . . 53
2.5 Discussion. . . 57
2.6 Tables . . . 59
2.7 Figures . . . 63
3 DISTRIBUTED WORD REPRESENTATIONS FOR POLITICAL TEXT . . . 72
3.1 Distributed Word Representations . . . 73
3.1.1 Continuous Bag of Words . . . 75
3.1.2 Word Embeddings . . . 81
3.2 Document Representations. . . 86
3.2.1 Vector Aggregation . . . 87
3.2.2 Convolutional Networks . . . 88
3.3 Applications . . . 93
3.3.1 Debates . . . 94
3.3.2 Note on Multi-Channels. . . 98
3.4 Discussion. . . 99
3.5 Tables . . . 103
3.6 Figures . . . 107
4 ON THE STRUCURE OF ELITE IDEOLOGY . . . 116
4.1 Theory . . . 117
4.1.1 What is ideology? . . . 118
4.1.2 Who has an ideology? . . . 120
4.1.3 What is the structure of ideology?. . . 121
4.2 Data & Design. . . 131
4.2.1 Methods . . . 133
4.2.2 Expectations . . . 135
4.3 Results . . . 136
4.4 Discussion. . . 141
4.5 Tables . . . 143
LIST OF TABLES
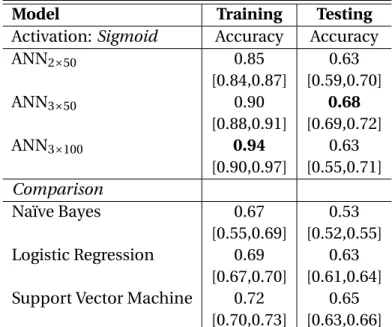
2.1 Predictive Accuracy for Ideological Classification . . . 59
2.2 Logit & ANN Comparison . . . 60
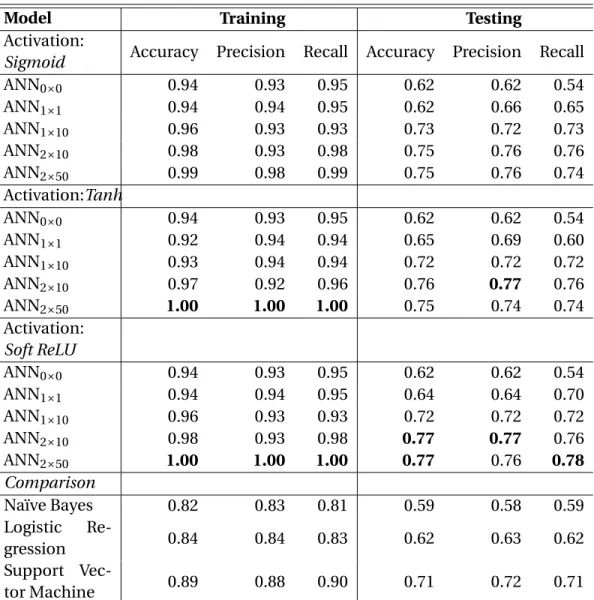
2.3 Comparing ANN Specifications for Text . . . 61
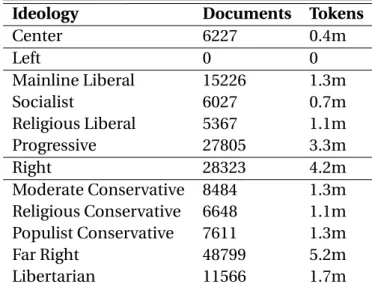
2.4 Summary of the Ideological Books Corpus . . . 62
3.1 Word Representations Capture Semantic and Syntactic Meaning . . . 103
3.2 Distribution of Topics in the October 3 2012 Presidential Debate . . . 104
3.3 Topic Cross-Validation Accuracy from Three Models . . . 105
3.4 CNN Test Set Predictive Accuracy for Tone and Topics. . . 106
4.1 Descriptions of the Subclasses in the IBC . . . 143
4.2 Ideological Classification Accuracy Across Models . . . 146
4.3 Words & Phrases Associated with Liberal Ideologies . . . 147
4.4 Words & Phrases Associated with Conservative Ideologies . . . 148
4.5 2016 Candidates’ Use of Ideological Language . . . 149
4.6 Democratic 2008 Candidates’ Use of Ideological Language . . . 150
4.7 Republican 2008 Candidates’ Use of Ideological Language. . . 151
LIST OF FIGURES
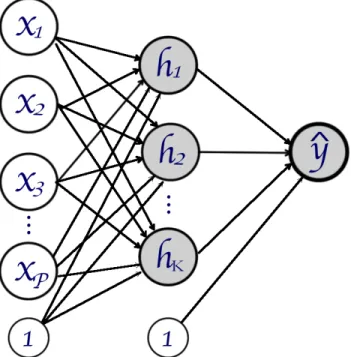
2.1 A Basic Artificial Neural Network . . . 63
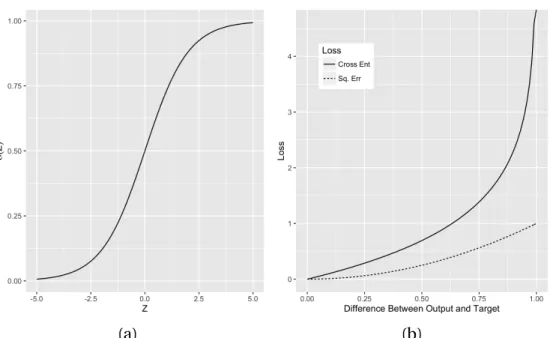
2.2 Sigmoid Activation & Cross-Entropy Loss . . . 64
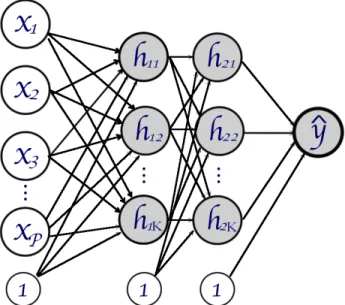
2.3 A One-Layer Artificial Neural Network . . . 65
2.4 A One-Layer Artificial Neural Network . . . 66
2.5 Learning Process of Three Neural Networks . . . 67
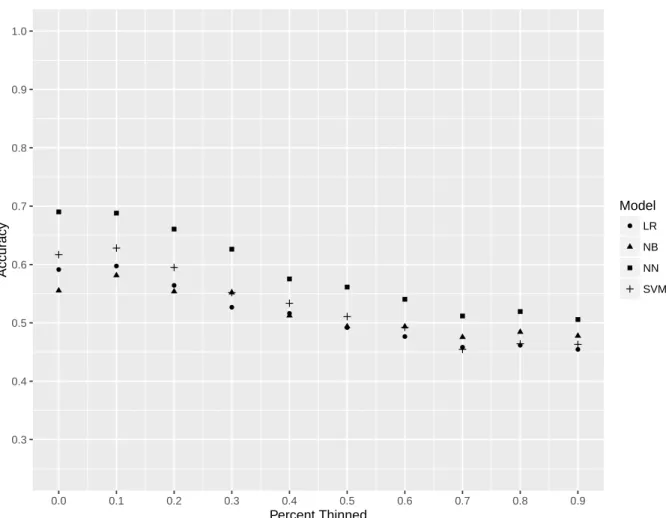
2.6 Accuracy from Unigram Thinning . . . 68
2.7 Accuracy from Unigram/Bigram Thinning . . . 69
2.8 Accuracy from Unigram, Bigram and Trigram Thinning . . . 70
2.9 Cross-Validation Predictive Accuracy for Ideology. . . 71
3.1 Graphical Representation of the CBOW Model . . . 107
3.2 Graphical Representation of the CBOW Model with Context . . . 108
3.3 Generic Evaluation for the CBOW Model . . . 109
3.4 Domain-Specific Evaluation for the CBOW Model . . . 110
3.5 Graphical Representation of the Convolution Process . . . 111
3.6 The Convolution Process with Multiple Window Sizes . . . 112
3.7 Topic Classification Precision . . . 113
3.8 Tone Classification Precision with Multiple Embeddings. . . 114
3.9 Topic Classification Precision with Multiple Embeddings . . . 115
4.1 Dimensionality of Corpora Classifications . . . 153
4.2 Latent Representation of Libertarian Documents . . . 154
4.3 Latent Representation of Progressive Documents . . . 155
4.4 Latent Representation of Religious Documents . . . 156
1 INTRODUCTION
Politics comprises, in large part, the artful (and sometimes painfully inartful) use of
lan-guage. Candidates for political office barnstorm for months at a time, making their cases and
leveling criticisms of opponents’ actions and points of view; legislators draft and debate bills;
presidents issue statements; justices hand down legal opinions; information age rabble-rousers
peddle conspiracy theories to anyone with an internet connection; and journalists, columnists
and bloggers dissect, reframe and disseminate it all to the American public. For political
schol-ars, the trove of data locked away in transcripts and manuscripts is both a blessing and a curse.
The answers to many fascinating questions lie within the written word; yet harnessing the data
in ways both efficient and reliable poses considerable methodological challenges.
I am not the first, nor will I be the last, to address these challenges. In political science, we
have sought for decades to use text as a source of data. Over the past two decades, we have
built our capacity to process, quantify, and model text using computational methods. With
in-creased computing power and advanced statistical methodology, scholars have developed new,
powerful, and efficient tools to extract patterns from, and test substantive theories using, text
as data. My dissertation seeks to advance this rich history of methodological and substantive
work. It does not represent a paradigmatic shift in political methodology. It represents a step
forward, progress in the normal scientific march toward better tools and better understanding.
This dissertation addresses three major topics. The first, which comprises Chapters 1 and
2, addresses methods for large-scale text analysis. Specifically, these chapters introduce ‘deep
learning’ methodologies for supervised text classification to a political science audience. The
second topic, addressed entirely in Chapter 2, shows how we can improve how we quantify
lan-guage using distributed word representations. The third topic for this dissertation, contained in
In this introduction, I will briefly describe these topics. I will also seek to make clear where
this dissertation fits within the broader field of political methodology, how the dissertation
moves the field forward, and why the reader should bother him- or herself with the results.
1.1 Political Text Classification
Much of political conflict unfolds in language. From speeches to media coverage, platforms
to treaties, tracts to broadcasts, power and influence require communication. As Grimmer &
Stewart (2013, 1) put it, “To understand what politics is about we need to know what political
actors are saying and writing.” This recognition is not new. For decades, political scientists
have manually coded texts for various features—partisan bias, racial undertone, policy frames,
conflictual or negative language, specific policy or treaty provisions, and so on. Computational
methods for text analysis, which use computer programs and statistical models to automate
these tasks, simply make this process faster, more efficient, and scalable to collections of texts
that would be infeasible to code by hand.
In political science, we often wish to achieve one of three goals with text data: classification,
clustering/scaling, and prediction. Most political scientists will find these familiar, even if they
have never used text as data. These tasks are essentially the same goals we pursue in our
quan-titative research. The first two of these tasks fall generally into measurement techniques; that
is, given texts, can we extract useful measurements therefrom? The third attempts to leverage
information in texts to make forecasts about future preferences, behavior, or events.
We can also partition text analysis approaches into two broad classes: supervised and
un-supervised. The former uses hand-labeled data to train a model, which can then be used to
predict the labels on held-out documents. For example, a researcher could hand-code
docu-ments according to their positivity or negativity (i.e., the sentiment) of the language therein.
The researcher then fits a statistical model to estimate what words or phrases predict the
senti-ment of the docusenti-ments, and then use this information to label the sentisenti-ment of many—perhaps
hand-labeled documents. Instead, these methods attempt to uncover latent patterns in
docu-ments. Analagous to principal components or exploratory factor analysis, this class of models
produces groupings or scaled representations of documents that the researcher attempts to
in-terpret after model estimation.
Many scholars have employed supervised (e.g., Laver, Benoit & Garry (2003)) and
unsuper-vised (e.g., Slapin & Proksch (2008), Proksch & Slapin (2008) and Spirling (2011)) models to scale
documents into a continuous policy space. Other scholars have attempted to leverage text for
predictive purposes. Tumasjan, Sprenger, Sandner & Welpe (2010), Bermingham & Smeaton
(2011), Beauchamp (2015), and Skoric, Poor, Achananuparp, Lim & Jiang (2012) attempt to
predict electoral polls and outcomes using large-scale Twitter data. Diermeier, Godbout, Yu
& Kaufmann (2012) and Beauchamp (2011) use language in Senate floor speeches to predict
the ideological position of Senators, according to DW-Nominate. These, and the many others
I do not cite, are all important projects. But this line of research falls outside the scope of this
dissertation.
Supervision My dissertation focuses on supervised models classifying political texts. In other
words, I train models to classify political texts into hand-coded, discrete categories. I focus on
supervised methods because I believe that supervision provides a necessary theoretical
con-trol over automated methods. We can find many unsupervised, latent representations of text
data. Textual data contains myriad signals—ideological, partisan, educational, sophistication,
linguistic, translational. Unsupervised methods may unveil important summaries of the
docu-ments in any collection. Unfortunately, there is no guarantee that amongst the many signals in
text, any summary will produce something of substantive interest. When attempting to
mea-sure nuanced concepts, like my analysis of elite ideology in Chapter 3, supervision makes more
sense, because it grounds the measurement task in substantive expertise.
Classification We deal with classification questions routinely, even if we do not think of them
factors make individuals more likely to vote than others? Or make countries more likely to
engage in war? How do voters choose between many political parties, or insurgent groups
be-tween potential targets? In each of these cases, we attempt to use observable information about
people, countries or institutions to classify them into groups: voters and nonvoters, liberals and
conservatives, Labour, Tory, or Liberal Democratic voters, and so on.
In text analysis, we face a similar challenge: how can we take the language in a document to
classify the document itself? In this dissertation, I focus on classifying documents by the topics,
ideology, and tone they represent. I pay particular attention to the classification of ideology,
which appears in all three chapters. I build on prior work by Sim, Acree, Gross & Smith (2013)
and Iyyer, Enns, Boyd-Graber & Resnik (2014), who use political language to classify documents
into ideological categories, and on work by Acree, Gross, Smith, Sim & Boydstun (2014), who
use ideological classification as the basis for testing a theory of post-primary moderation in
presidential campaigns.
Of course, we can imagine plenty of areas where our theories require us to classify political
texts. Boydstun, Gross, Resnik & Smith (2013) test a theory of policy framing by tracing the
evo-lution of frame over time through media. Tumasjan et al. (2010) classify Twitter statements by
their sentiment, and use the aggregated results to forecast German federal elections. Of
partic-ular interest to institutionalists, scholars have also used supervised methods to classify policy
stances in Congressional floor speeches (Thomas, Pang & Lee 2006, Hopkins & King 2007),
ed-itorials (Hopkins & King 2007), or online debates (Somasundaran & Wiebe 2010). In essence,
methods for classification are useful because they can group documents into any category of
substantive interest, and provide measurements for evaluating social and political theories.
1.2 Contribution
This dissertation seeks to advance this line of political research by introducing new tools
from the computer science literature. I must be clear—I did not invent deep learning methods,
my aspiration is to begin to lay the foundation with this document: to prove the usefulness of
deep learning methods for political scholars, to provide practical guidance for its use, and to
assess whether model evaluation benefits from domain-specific tests.
I see the contribution in three parts: (1) I introduce deep learning methods which, while
used in the natural language processing and computer science literature for more than a decade,
have not appeared in political science scholarship. Though not universally superior to other
methods for text classification, deep learning models have the advantage of adapting to
com-plex interactivity and nonlinearities in language, which can render them more powerful in
mea-surement tasks. (2) I describe distributed word representations, why they are useful, and show
for the first time that domain specificity can matter as much as general model performance
when using distributed word vectors. (3) I revisit a longstanding conflict in political science
be-tween what we believe about ideology, and how we typically measure it. With new data and a
new perspective, I make an argument that ideology can be multidimensional, even when the
vast majority of our measurements to date reduce to a single dimension.
1.2.1 Methods Contribution
The bulk of this dissertation centers on deep learning methods as applied to political texts.
As I have mentioned already, these methods have yet to appear in political science scholarship,
despite—as I show in the first two chapters—their usefulness for text analytic tasks. I offer two
reasons why. First, like many machine learning methods, artificial neural networks work well
in measurement or dimensionality reduction, but are ill suited to testing substantive theories.
I explore this more inChapter 1, but briefly, artificial neural networks make it very difficult
to assess how variables affect each other. For measurement problems, we might not care, so
long as the model performs its task well. Most of our work, however, centers on testing causal
theories of social behavior. Artificial neural networks—no matter how deep or complex—are ill
suited to that task.
political scientists learn and use. More common econometric and statistical methods tended
to progress around principled problem solving. We have Gauss-Markov assumptions but our
data are correlated over time, so we derive a model to account for this autocorrelation and an
estimation routine to fit the model. Artificial neural networks, by contrast, tended to develop by
heuristic. These models were developed with biological inspiration, and much of the structure
seen in advanced models follows this pattern. Feed-forward artificial neural networks were
de-signed to mimic how mammal brains learn, and convolutional neural networks were developed
to mimic the behavior of mammalian retinas.
As a result of its separate development, deep learning has its own vocabulary, its own
tra-ditions, and its own intuitions. This creates a high barrier to entry for scholars outside of the
field. Of course, the same could be said of statistical and machine learning methods over the
past several decades. Many exciting developments in our substantive understandings of
poli-tics derived from scholars adapting tools from other fields. In this dissertation, I introduce these
deep learning methods, show their usefulness in several text classification tasks, and develop a
domain-specific model assessment dataset for a particular type of deep learning model, known
as distributed word models.
We should, of course, question why we desire new tools for computational text analysis. Are
the current methods used in political scholarship not up to the tasks we demand they perform?
If deep learning requires us to adapt to a different tradition of computational models, is it really
worth it? My contention is yes. Current methods perform well, but suffer from some weaknesses
that ultimately limit their performance. I will offer three:
1. Our methods struggle to incorporate high-order interactivity that we know exists in
lan-guage. For example, we might learn much about a document by observing that two words
are used together (‘climate change’) and in conjunction with others (‘so-called’) (Iyyer
et al. 2014). Our existing methods struggle to adapt to this without the researcher
interactivity automatically.
2. Current methods tend to ignore word order, or incorporate word order byn-gramming
the corpus, or treating multi-word phrases as the unit of analysis (see the final section of
this introduction). Word order clearly matters for language. Ignoring it sets a natural limit
on how well our models match our understandings of political text. Evenn-gramming, though useful, presents serious problems, most notably that the researcher much decide
how to remove unimportant multi-word phrases. N-grams are typically generated by
shingling, or considering everyn-length phrase that occurs in a text (Spirling 2011). This
results in mostn-grams as meaningless phrases. Deleting uncommonn-grams, however,
can accidentially remove important, informative but uncommon phrases. Deep learning
can adapt to word order without needing ton-gram the corpus or deal with its challenges.
3. We nearly universally quantify text atomically, meaning that we treat words as
indepen-dent, atomic units. This ignores that words are related in natural language, which again
discards useful information and limits the performance of current methods. Deep
learn-ing methods can efficiently and reliably generate continuous, lower-dimensional
repre-sentations of words that can capture the semantic (definitional) and syntactic (linguistic
role) meaning of words.
My first two chapters seek to address these challenges. InChapter 1, I introduce deep
learn-ing artificial neural networks. Deep learnlearn-ing methodologies present an excitlearn-ing new area for
exploration in political science research. These computational models attempt to replicate, in
a starkly simplified form, the information processes of the mammalian brain. Deep learning
methods distributelearning across many computational units, much as the brain distributes
learning across many neurons. Artificial neural network models, which serve as the
infrastruc-ture for deep learning, have been described in the computer science and artificial intelligence
literature for decades. For much of that time, only simple models could be estimated with
to build larger, richer, and more complex models.
I begin with a simple example: using an artificial neural network model to perform logistic
regression. With this familiar case, I introduce some of the vocabulary in the deep learning
lit-erature, and cover the basic model structure. I also introduce the many choices scholars face
when specifying neural network models—such as model parameters, non-linear ‘activation’
functions, the dimension of the network itself—along with, when possible, practical guidance.
I present a Monte Carlo simulation study, which shows how deep artificial neural networks can
adapt to complex data patterns, like those found in language. Using two data sources, I go on to
show that artificial neural networks not only perform well compared to common text analytic
models in the political science literature, but in many cases perform better.
Building on this foundation,Chapter 2marks a significant step forward for the analysis of
political texts. To date, political science researchers have relied on ‘atomic’ word
representa-tions. That is, we typically measure words as atomic units, without concern for the semantic
(definitional) or syntactic (linguistic role) similarities between words. This means that we
ig-nore a wealth of valuable information contained in language. We wish to use language because
we believe it conveys meaning. Whenever possible, our methods should try to measure that
meaning.
Distributed word representations are a tool to do just that. In essence, estimating distributed
representations of words is simply dimensionality reduction. Instead of representing words as
atomic, independent units, we try to find latent, lower-dimensional representations of words
that capture patterns in word use. The result is an encoding for words that places similar words
close together in a common space, and dissimilar words further away, which in turn captures
what words mean and how they are used in language.
Chapter 2 also builds a new evaluation tool for these word representation. In the deep
learning literature, there is an unspoken assumption that distributed word representations built
actually obscure domain-specific word meanings. For instance, the word ‘gridlock’ in general
language can imply traffic or congestion; in politics, it usually refers to partisanship and
po-larization. I show that validating models with general-purpose evaluation data misses this
nu-ance. I further show that using distributed word representations trained on multipurpose text
data does not always outperform representations trained on smaller, domain-specific text
col-lections.
Finally, inChapter 2, I describe a particular type of deep learning model: Convolutional
Neural Networks. These models attempt to leverage spatial dependence between words in
doc-uments to, e.g., classify docdoc-uments into groups. This could provide a major step forward for
po-litical research. As I discuss in the final section of this introduction, scholars face many choices
when using text data. One of the most important is how to account for word order. The typical
solution is to treat as the analytical unit the multi-word phrase, orn-gram. This suffers from
many problems, however. As I point out inChapter 1,n-gramming requires the researcher to make many data cleaning choices, such as how long the multi-word phrases should be, and how
to thin out meaningless or rare phrases. These choices can be highly consequential for model
performance. Convolutional neural networks, by contrast, adapt to word order naturally. They
do not require the researcher ton-gram the documents before estimating the model. As a result,
model performance can prove more stable.
I intend the contribution for the methods community, then, to be two-fold: introducing
methods that hold substantial promise for extracting useful information from textual data, and
moving our methods away from atomic representations of language toward representations
that capture the meaning of words.
1.2.2 Substantive Contribution
In my final chapter, I address a longstanding issue in political science. We recognize as a
field the importance of ideology—those core beliefs that inspire our preferences and motivate
morality, and ethics. We also describe ideological conflict largely in terms of left and right, the
ongoing battle between liberalism and conservatism. This structure is born out time and again
in empirical exercises, from Congress to courts to citizen policy preferences. In the vast majority
of quantitative work, political researchers find a unidimensional representation of ideology as
powerful as it is parsimonious (Jost 2006).
Yeta priori, there is no reason to assume that ideologyhasa unidimensional form. If ideol-ogy is truly about ideas, then it should extend beyond how we respond to yes/no policy
ques-tions. Is should also reflect the many distinct belief systems that inspire those preferences. I
address this issue inChapter 3. I present a theory of ideological censorship, which posits that
the familiar unidimensional representation of ideology derives from the nature of two-party
conflict. Ideology itself, I argue, may be nuanced and multidimensional for political elites with
highly constrained political belief systems. Most citizens, however, show little ideological
con-straint beyond a general liberal or conservative orientation. Parties intent on winning power do
not need to appeal to nuanced ideological beliefs. They simply need to offer a binary choice:
Democrat or Republican? So long as these parties generally reflect the liberal-conservative
di-vide, political conflict will look unidimensional.
To evaluate the merit of this theory, I use two sources of data. The first, the Ideological Books
Corpus (Sim et al. 2013), comprises ideological writings from political elites, but outside of any
immediate partisan or electoral competition. The second contains campaign speeches from
presidential candidates from 2008-2016. Using the multidimensional and hierarchical
ideolog-ical classifications provided by Sim et al. (2013), I show that many ideologideolog-ical classifications
can be recovered using only the text that the authors employ. Further, the differences in
lan-guage between ideological groups match our substantive intuition about what differentiates
these groups from one another. Finally, I find evidence that a lower dimensional
representa-tion does not adequately summarize these texts. In other words, there are real and
liberal-conservative dimension.
The same pattern does not appear in campaign speeches. To the contrary, presidential
can-didates do not appear to sample much of their language from particular ideological groups.
Instead, candidates appear as ideological generalists, using language from many ideological
groups on the left and the right. Further, the candidates’ language can be easily summarized in
a single dimension that maps cleanly onto a substantive understanding of left and right, with
conservative Republicans on one end and liberal Democrats on the other. Even candidates in
primary campaigns, where we might expect sharper ideological differentiation, appear to
com-ply with our more traditional conceptualization of ideology, treating the main scope of conflict
as one between liberalism and conservatism.
This revisits, and I hope revitalizes, an important discussion for political researchers. For
a long while, our research has uncovered a single ideological dimension, and we have largely
accepted this as the structure of ideological conflict in the United States. By seeking out another
source of data, and by employing methods for analyzing large text collections, I show that this
conclusion may be hasty. Ideology is not unidimemsional or multidimensional—it is both. The
structure of beliefs, at least among elites, can be richly nuanced and multifaceted. When filtered
through an partisan lens, however, ideological conflict simplifies to a battle between left and
right. I hope that this theory, and the evidence I provide, advances how we conceive of, and
measure, elite political ideology.
1.3 The Challenges of Text
If the tasks we perform with textual data is so similar to the rest of our quantitative
enter-prise, does text really differ from other sources of data? We face plenty of challenges in data
analytics. Are those entailed in employing text as data really so different, so difficult, as to merit
its own field of inquiry? The answer is, in the same breath, yes and no. Many methods used for
text analysis are familiar, but textual data present unique problems that render it difficult to use
as concepts related to how text data is processed and quantified. These concepts are essential
for understanding the remainder of this thesis.
Text is challenging because it isunstructured. Unlike data that can be easily quantified, text
is qualitative. There is no immediately apparent way to integrate text into statistical models.
We face this issue plenty in other research, of course. How do we represent ideology—which
we typically describe as ‘liberal’ or ‘conservative’—quantitatively? For such problems, we make
simplifying assumptions that allow us to ascribe numerical values to qualitative meaning. We
assume some sort of dichotomy or scale, which we can plug into statistical models. The
prob-lem of quantification is as old as empirical political science itself.
How is text different? Text requires considerable processing to represent it quantitatively.
How do we define the unit of analysis? Is it the letter, the word, the multi-word phrase, the
sentence, the paragraph? Should we retain some, none, or all of the capitalization or
punctua-tion? Should we treat documents as ordered sequences of words? As bags of word frequencies?
Should we treat all words equally, or should we try to heavily weight words we find more
impor-tant according to some criteria? Should we ignore very common words? The last section of this
introduction addresses these questions more specifically.
Text also brings with it the legion complexities of natural language. Pause for a moment
to consider how rich, nuanced, and complicated language can be. Teachers find it
challeng-ing enough to instruct students on how to properly communicate their ideas orally and in the
written word. Language comprises grammar, semantic meaning, syntax, humor, negation,
sar-casm. . . and the list continues. As humans, we have engineered the most incredible, the most
ingenious, ways to communicate the complexities of emotion, desire, feeling, and belief. Set a
monkey to your laptop for all eternity—I guarantee you it will not produce the works of
Shake-speare. How can we possibly expect computers or statistical methods to comprehend, or
lever-age, the information contained in the spoken or written word?
in political science make simplifying assumptions that, while troublesome for a linguist, result
in methods that perform fairly well. For instance, nearly all methods used in political science
make the ‘bag of words’ assumption. This assumes that words are exchangeable, meaning that
words in a document occur with some probability independent of the words that appear before
or after. This clearly makes no sense. Word order matters quite a lot for humans to comprehend
one another. Yet, perhaps surprisingly, ignoring word order and simply accounting for word
occurrence can account for many patterns of substantive interest. Does the word ‘alien’ appear
in a document addressing immigration? If so, we probably (though not certainly) can infer at
least the general perspective of the author.
Advances in computer science include the development of deep learning methodologies.
These methods have proven so successful that they power many technologies we use daily:
speech recognition and talk-to-text applications on cell phones, facial recognition in social
me-dia platforms, and automated language translation, to name but a few. These tools have also
proven useful in natural language processing and text analytic task. In this dissertation, I use
them to estimate political tone and ideology, and to capture the semantic and syntactic
mean-ing of words in political texts, but they have been used in more text analytic tasks than I can
possibly recount here: sentiment analysis, topic modeling, authorship detection, generating
new texts, and on and on.
The myriad methods—deep learning or otherwise—for text analysis makes this area both
inviting and foreboding. Grimmer and Stewart (2013), in an invaluable overview published by
Political Analysis, point out two facts about text methods. First, borrowing from Box (1979), “All
quantitative models of language are wrong—but some are useful.” Second, there is no single
best automated text analysis method. In other words, what renders text analysis so challenging
is not that the methods are impossibly complicated—most are not—but the diversity of
meth-ods available, and the many choices we must make in order to quantitatively analyze textual
1.4 Processing & Preparing Text for Analysis
In most applied political research to date, scholars applybag of wordsmodels, which treat
documents as exchangeable distributions of words or phrases. These methods underly the
methods discussed in the first chapter of this thesis, and I discuss processing for this family
of models first. I also discuss data processing for more advanced applications, which relax the
exchangeability assumption and attempt to account for word order, which features heavily in
the second chapter of this paper.
1.4.1 Bag of Words
Bag of word, or BOW, models treat documents as exchangeable distributions of words or
phrases. According to this assumption, the order in which words occur does not matter. For
actual language, this assumption clearly does not hold. For human comprehension, we require
a logical sequence of words to express a point, and we can easily concoct sentences where word
order is of paramount importance. (For example, compare the meaning of the sentences “I am
not a crook.” to “Am I not a crook?”)
Perhaps surprisingly, though, BOW methods perform well despite this lack of verisimilitude.
For many predictive tasks, knowing that a word (or phrase) occurs in a document provides
suf-ficient evidence, even if we ignore where in the document that word appears. For example,
if a news story contains the two-word phrase “second amendment” several times, the story is
probably discussing gun rights. Where in the document this word occurs will not often matter.
By assuming exchangeability of the words or word phrases, we maintain considerable
predic-tive ability, while simplifying how we quantitapredic-tively represent documents, and how we apply
models to these data.
Document-Term Representation In BOW models, we nearly always represent documents as
a ‘document-term’ matrix (DTM). (Clearly the transpose of such a matrix would be a
‘term-document’ matrix, so these are equivalent.) The DTM contains a row for every document in the
vocabulary. The most basic DTM contains word counts. For example, if the word “president”
occurs three times in the first document, then the first row, “president” column of our DTM will
contain a 3.
The DTM can also be populated with various weighted representations of the words.
Fre-quent weights are document-proportions, which take term frequencies and divide them by the
number of words in a document. This gives a sense of how prevalent a word is in a document,
and helps to ‘control’ for document length. Another common weight is the term
frequency-inverse document frequency (tf-idf ) weight, which provides higher weights for terms that
dif-ferentiate documents. IfDis the number of documents in the corpus,Xis the document-term
matrix, andxd,v is the number of times that wordv occurs in documentd, the tf-idf weight is
defined as:
tf-idf(d,v)=xd,v×log
D
P
dI(v∈d)
(1.1)
whereI(·) is the indicator function, returning 1 if the argument is true, and zero otherwise, and (v ∈d) means that termv occurs in documentd. In plain English, the tf-idf score gives higher weights to terms that (a) occur in many times in a document; (b) occur in only a few
other documents; (c) a combination of (a) and (b). If a word occurs in every document in a
corpus—for example, prepositions typically occur in nearly all natural language—the term
fre-quency gets weighted by log(1)=0. If a word occurs in only ten percent of documents, the term frequency gets up-weighted by a factor of log 10≈2.3.
Unit of Analysis For many documents, the unit of analysis is straightforward. If we seek to
measure the sentiment of user tweets on Twitter, we would probably treat the tweet as the unit
of analysis. In such a situation, we would hand-label some subset of tweets as falling into our
sentiment categories (e.g., ‘positive,’ ‘neutral,’ or ‘negative’), fit a model to these data, and after
tuning the model, use learned parameters to generate predictions for a large class of new data.
to classify the ideological content of political speech, should we attempt to classify the entire
speech as a single document? Should we parse the speech into paragraphs, or sentences?
Maintaining larger documents can make classification more reliable. Language is noisy, and
small perturbations in word use in short documents could spur large shifts in predictions. For
example, if a candidate for office says “All my opponent cares about is the second amendment,”
a statistical model may infer that the use of ‘second amendment’ indicates that represents a
conservative viewpoint. In a longer document, however, we would undoubtedly see far more
indicators of a liberal perspective, which could reduce our mis-classification rate.
On the other hand, shorter documents can better represent mixtures of classifications. If we
seek to observe how much a candidate is sampling his or her language from ‘religious
conserva-tive’ versus ‘libertarian’ ideologies, we may justifiably parse single speeches into its component
sentences. This would allow us to model how a candidate switches between two ideological
schools of thought in a single speech.
Choosing the unit of analysis for text modeling is task dependent, and requires the analyst
to balance between the amount of information provided in a single document (i.e., longer
doc-uments provide more information) with the expected nuance of docdoc-uments themselves.
Text Cleaning In many applications, researchers prefer to strip text of capitalization,
punctu-ation, numerals, and non-typical characters. Under such a text cleaning regime, a document
that says “I would like to buy 100 widgets!! Thanks!! :)” would be converted to the string “i
would like to buy widgets thanks”. Clearly some information is lost in this process, but in many
applied settings the information loss is compensated for by simplifying the resulting
vocabu-lary. (In the first instance, the single-word vocabulary would be “I”, “would”, “like”, “to”, “buy”,
“100”, “widgets”, “!”, “Thanks”, “:)”, while the second would simply be “i”, “would”, “like”, “to”,
“buy”, “widgets”, “thanks”).
Stemming Stemming simply means reducing words to their linguistic stems, dropping
“repealed,” and “repealing” convey much the same thing: that a piece of legislation is being, or
has been, or should be repealed. Once we know that the author is discussing repealing, the
suf-fix itself provides scant new information. Stemming also helps to reduce the dimensionality of
the vocabulary, by collapsing variations on single words into a single term. In other words,
in-stead of counting the three ‘repeal’ words separately, we define a single ‘repeal’ stem and count
all versions of that term as instantiations of the same term.
N-Gramming Words do not always convey meaning in isolation. The word ‘pride’ conveys
different meaning if combined with ‘gay’ versus with ‘American’. The BOW assumption that
words are exchangeable would treat the word ‘pride’ the same, whether it occurs after ‘gay’ or
after ‘American.’ To maintain the simplicity of the BOW assumption, but still allow for some
local word ordering, we can generate vocabularies ofN-grams, orN−word phrases. To gener-ate bigrams, or two-word phrases, from the string “We should support gay pride movements,”
we simply take every two-word phrase that occurs in the text: “We should,” “should support,”
“support gay,” “gay pride,” “pride movements.” Each two-word phrase is treated as a unique
term, as if these phrases were a single word.
Documents can be represented as collections of unigrams, bi-grams, tri-grams, or
higher-order n-grams. Without some principled thinning of the vocabulary, however, this process can
dramatically expand the dimension of the vocabulary. Even for the example sentence above,
the vocabulary of unique words or word phrases is five unigrams, nine unigrams and bigrams,
and twelve unigrams, bigrams and trigrams, and so forth. When applied carefully, however,
n-gramming can ease the restrictiveness of the BOW assumptions, by allowing forlocal
depen-dence of words in meaningful multi-word phrases.
Vocabulary Reduction Theoretically, we would like to employ all available information in a
text corpus. This may include all unique words, as well as all multi-word phrases, that appear
in a given corpus. Unfortunately, this will nearly always be too computationally expensive, and
substantive meaning, and thus provide little useful information to leverage in modeling
situa-tions. In the previously mentioned sentence, for example, all of the two-word phrases except
“gay pride” convey little information about the perspective of the author. Including all one- and
multi-word phrases as predictors in a statistical model will prove inefficient, computationally
expensive and can reduce the accuracy of the resulting model.
Thinning the vocabulary is something of an art. Most commonly, researchers remove terms
(either words or multi-word phrases) that do not occur sufficiently frequently in the corpus, or
do not occur in a sufficient number of documents. This filters out very rare words,
typograph-ical errors, or other unique terms (like social media user names, or other hypertext mark-up)
that will almost certainly not assist us in substantive research tasks. The process of thinning
vo-cabulary frequently requires some trial-and-error, to balance efficiency against the potentially
useful information conveyed by the inclusion of rarer terms.
Many researchers also choose to filter outstop words, or very common words, that convey little information by themselves. Stop words usually include prepositions, functional words like
‘the,’ ‘is,’ ‘which,’ ‘that,’ and pronouns. One can easily imagine situations where stop words
con-vey necessary information, or else might concon-vey information useful for substantive research. If
we concern ourselves with thegendered nature of political language, for instance, we would
want to preserve the use of gendered pronouns like ‘him’ or ‘his’ versus ‘her’ and ‘her’s.’ On the
other hand, if we seek to model the process by which states adapt legislation from other states,
we may add functional words, like the names of state-specific agencies or institutions, to the
list of stop-words. The ultimate choice is task-specific, though in applied research, it is more
common to drop stop words than to retain them.
1.4.2 Preserving Word Order
Word order is essential for language comprehension. By making the exchangeability
as-sumption of BOW models, we potentially ignore valuable information. Further, despite the
analyst to make many consequential choices, such as how large ofn-grams to generate from
a corpus, how to filter out the vast majority of uninformativen-grams, and generally how to
represent local word dependence without making the resulting vocabulary too large to be
prac-tical.
To set aside the exchangeability assumption requires a different manner of quantitatively
representing documents. Since words are no longer exchangeable, the document-term matrix
no longer suffices. Instead, we need to construct a matrix representation of documents that
preserves word order. Instead of representing a document as a row in a DTM, we represent a
single document as a matrix, where each row represents a single word, and rows are stacked in
the order of the words in a document.
I will discuss two common ways to encode the row values: one-hot vectors, and distributed
word vectors. We can still stem,n-gram, strip punctuation and numbers, and convert all letters
to lowercase, before constructing the one-hot or distributed word matrices. Since we preserve
word-order, it’s less important ton-gram, but we still typically convert to lowercase. The other
options are left to the analyst.
One-Hot Word Representation The simplest way to represent a word is one-hot encoding. A
one-hot vector for words will have an cell corresponding to every word in the vocabulary, and
will show 1 in the cell corresponding to the word in question, and 0 elsewhere. For example, if
we are one-hot encoding the document “Our children can achieve great things,” the first row
of the matrix will have a 1 for the entry corresponding to the word ‘our’ and 0 elsewhere; the
second row will have a 1 for the entry corresponding to the word ‘children’ and 0 elsewhere; and
so forth.
Distributed Word Representation One-hot representations are sparse, but tend to be very
high-dimensional. Even in moderately sized corpora, there will tend to be thousands of unique
words, meaning that the one-hot vectors will have length in the thousands. We may suspect,
(sayL ¿V) dimensions. Such a suspicion would be well-founded in natural language mod-eling, since many words will be convey similar information, or be used in similar contexts. In
Chapter 2 of this thesis, I will discuss one popular such reduction: neural word embeddings,
made famous by Google’sword2vecmodel and similar work.
Constructing a distributed representation of a document looks much the same as the
one-hot. Instead of each word in the vocabulary being represented by a long and sparse one-hot
vector, each word is represented by a dense vector of lengthL. Typical values forLare between
100 and 500, meaning that we represent each word as existing in some continuous 100 to 500
dimensional space. The document is represented with one row for every word, stacked in the
order in which the words appear in the document.
Document Padding In the BOW approach, we represent an entire corpus as a single DTM,
with one row for each document. By preserving the order of words, eachdocument is
repre-sented as a matrix, with as many rows as there are words in the document. An entire corpus,
then, will be represented as a three-dimensional array, where we stack all document matrices
together.
For such a representation, however, we require each of the matrices to have the same
di-mension. Every word is represented in the sameLdimensions, but each document will contain
a different number of words. To fix this issue, it is common topadortruncatedocuments to the same length. If the longest document in our corpus has 50 words, we may force all documents
to have 50 rows. Any document that has fewer than 50 words will be padded with some filler
word (which isn’t a real word, usually just the spacer</s>). So for a thirty-word document,
the first thirty rows will be populated by theL-dimensional word representations
correspond-ing to those thirty words. The remaincorrespond-ing twenty rows will be filled with the representation for
the filler word. If some documents are too long, we may set the document length to be
some-where between the shortest and longest, in which case documents over, say, 50 words will be
By preserving word order, we are typically required to specify a unit of analysis to be fairly
small. Sentences, tweets, clauses or paragraphs may contain tens to low-hundreds of words, but
entire speeches, news stories, chapters or books will contain many thousands to hundreds of
thousands of words. (The reader must keep in mind that the number of words in a document is
not the number ofuniquewords, it is how many total words the document contains.) A
single-spaced six-page paper may contain 3000-4000 words by itself. The multi-dimensional array
representation for a corpus can get unwieldy very quickly, making it difficult to store the array
in memory, much less fit a model to it. As such, longer documents (e.g., chapters of a book) are
2 DEEP NEURAL NETWORKS FOR TEXT CLASSIFICATION
The complications inherent in mining usable data from text are not new to political science.
As Krippendorff (2004) and Hopkins & King (2010) note, researchers have been “content
ana-lyzing” political text for at least six decades. For much of this period, content analysis required
scholars and trained coders to wade through stacks of documents, coding each by hand
accord-ing to criteria established by the research project. Faster computaccord-ing and more advanced
tech-nical capacity have permitted researchers to engineer tools for automated or semi-automated
content analysis (Laver, Benoit & Garry 2003, Grimmer & Stewart 2013). Yet, as always, there
must be tradeoffs. No algorithm or statistical model can perfectly process text for every
schol-arly application. More importantly, purely unsupervised approaches leave little room for
theo-rists’ particular questions and concerns to guide the empirical process. In this article, I propose
a supervised and highly customizable model, and present a class of questions it is well
cali-brated to answer.
This paper addresses an emerging tool in machine learning, known broadly as ‘deep
learn-ing’ methods. This set of tools involves the use of neural networks with multiple layers of hidden
nodes to learn patterns in data (LeCun, Bengio & Hinton 2015, Schmidhuber 2015)1. Multi-layer
neural networks offer some strengths that other methods do not. Namely, neural network
mod-els provide straightforward ways to account for deep interactivity, interconnectivity and
nonlin-earities in the data (Pal & Mitra 1992, Belue & Bauer 1995). These strengths are particularly
use-ful when modeling text corpora, since language involves high degrees of interactivity. For
exam-ple, the phrases ‘climate,’ ‘change,’ ‘climate change,’ and ‘so-called climate change’ all convey
different meaning. Dictionary-based methods, which might categorize documents into topics,
frames, or ideological perspectives based on word occurrence, will fail to account for the
inter-active effect of combining ‘so-called’ and ‘climate change’ unless the researcher can specify the
patterna priori(Iyyer et al. 2014). More sophisticated structural approaches, like latent dirichlet
allocation (LDA) or structural topic models (STM) and their variants, might model multi-word
(n-gram) phrases (Blei, Ng & Jordan 2003, Blei 2012, Wang, Zhang & Zhai 2011, Roberts, Stewart,
Tingley, Airoldi & Others 2013). Deep learning methods offer some natural, and flexible, ways
to automatically account for such interaction between words and phrases in natural language
(Collobert, Weston, Bottou, Karlen, Kavukcuoglu & Kuksa 2011, Collobert & Weston 2008).
That said, deep learning methods also suffer some weaknesses. This class of models tends
to be computationally intensive, especially as the size of the data grows. This inefficiency arises
from several sources, the primary of which are the large numbers of parameters the models
re-quire us to estimate, and the need to iteratively update parameters in stages (Glorot & Bengio
2010). The flexibility of artificial neural networks (ANNs) also make it extremely easy to overfit
to training data, requiring analysts to regularize and ideally—though this can be challenging
considering computational efficiency—cross-validate the models (Tu 1996, Zhang 2000,
Srivas-tava, Hinton, Krizhevsky, Sutskever & Salakhutdinov 2014). Finally, ANNs can appear as ‘black
box’ tools that provide few ways of assessing the model estimates, aside from the model’s
pre-dictive power. Structural models, like regression-based approaches, allow for the analyst to
see parameter estimates and assess their face validity. For example, the analyst could view the
words that receive the highest weighting vis-à-vis a topic category. The analyst could then
eval-uate whether the words most closely associated with a topic make sense. ANNs, however, often
involve hundreds or thousands of parameters, which interact with each other at the multiple
layers of the network. As mentioned above, this has the advantage of accounting for high-order
interactivity in the data, but it renders is difficult to evaluate what information the model finds
most useful in making predictions.
in part. I will discuss a promising extension in the following chapter. In this chapter, however,
I focus entirely on fully connected, feed forward networks. I begin by defining feed-forward
ANNs, then discuss some issues of model specification, before presenting a short simulation
experiment, along with two applications using data on the tone of statements in a presidential
debate, and the ideological content of political books.
2.1 Neural Network Models
Artificial neural network models comprise a family of methods based on a stylized
under-standing of cognitive function. A detailed explanation of brain functioning goes beyond the
scope of this paper (and beyond the ability of the author). In broad strokes, brains comprise
dense networks of neurons connected by axons and dendrites, the former responsible for
send-ing electrical and chemical signals across the network, and the latter responsible for acceptsend-ing
signals from elsewhere in the network. The responsibility of the neuron is to perform very
ba-sic computation on the signals and to decide how and where to pass it through the network.
Taken by itself, a single neuron is not capable of learning in any meaningful way. Embedded in
a network with millions or billions of other neurons, however, the networked structure provides
incredible information processing and pattern learning power.
ANNs loosely replicate this style of learning by connecting individual, simple computations,
forming an arbitrarily large and complicated network. Put simply, neural networks are
dis-tributed learning models. ANNs take training data as an input, and distribute processing across
units callednodes. Information is passed between those nodes alongedges in an attempt to discover (potentially complex) patterns in the data. The information being passed are vectors
or matrices of data, or more often, the weighted and transformed vectors.
In this section, I will make these concepts more concrete. I begin with a basic ANN, its
structure and how parameters are fit. I then continue to describe richer neural network models,
2.1.1 Neural Network Basics
To begin, I will address some basic terminology. Neural networks aid researchers in learning
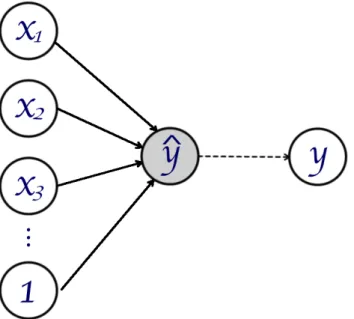
patterns in data that can map inputs onto outputs. For illustration, see Figure 2.1. Inputs(the
x’s in the figure) are the variables we use to make predictions about the outputs(the y). For
example, we might seek to model the topics of documents using the words contained in those
documents. In that situation, the topic for each document is the output, while we could use
vectors of word counts for each document as inputs. In a supervised learning task, which will
be the focus of this paper, these topic labels are known.2The additional input labeled1in Figure
2.1 represents thebias, or the equivalent to the intercept in a regression framework. The units of
the ANN, represented by circles in the graph, are callednodes. Nodes are graphically connected
to other nodes via edges, which symbolize weights. Inputs are weighted and then combined
and potentially transformed at the nodes. If the network has multiple layers of nodes, these
‘messages’ are then passed forward through the network. If, as in Figure 2.1, the network only
has two layer of nodes, the input and the output, the ‘message’ is weighted to directly form
predictions of the output.
Regression Example
Logistic Regression Because this can all seem quite abstract, we can consider a simple case
to build the intuition of ANNs. Consider some training data {Y,X} with target (i.e., dependent
variable)Y and inputs (i.e., predictors)X. We will index the training cases withi =(1, 2, ...N), and will index the inputs withp =(1, 2, ...P). A typical approach to the problem would be to
specify some mapping from inputs to outputs, for example
yi=g(β0+β1xi1+β2xi2+...βPxi P+²i)
=h(β0+Xiβ+²i) (2.1)
This familiar setup involves a linear combination of inputs (β0+Xiβ) and some transforma-tion (h(·)) of that linear combination. With continuous outputs, we might allowhto simply be the identify function. For binary outputs, we may instead perform a sigmoid transformation,
often with the inverse logit (softmax) function or with the standard normal cumulative
distri-bution (probit) function. For this example, we will assume that yi ∈{0, 1}, and that the link is the inverse logit, i.e.,h(z)=exp(z)/(1+exp(z)).
This problem can be recast as a simple ANN, shown in Figure 2.1. In this example, the inputs
are the predictors in the regression, such thatX1in the figure represents the length-Nvector of
inputs for the first predictor. As in a regression framework, the1input corresponds to a
length-Nvector of ones for the intercept. The edges represent the parameters in the regression model.
The edge connectingX1to the node ˆyrepresentsβ1, the edge connecting1to node ˆyrepresents
theβ0, and so forth. The computation happening at node ˆyis twofold. First, we take the linear
combination of the weights and inputs (β0+Xβ) and then we transform the resulting vector using the inverse logit function.
Fitting We can estimate the weights in this model by minimizing some loss function via
gra-dient descent. For example, in many applied settings, we minimize the sum of the squared
er-ror. In that situation, we would initialize theβweights to starting values, take the transformed
linear combination of the inputs and weights at the hidden node, and compute the squared
differences between the predictions and the target outputs. To minimize the loss, we take the
derivative of the loss at the current parameter estimates, and adjust these values in the direction
function withσ(·), the error and gradient are
E(t)= N
X
i
¡
(yi−σ(β0(t)+Xiβ(t)))
¢2
(2.2)
∂E(t) ∂β =
N
X
i
σ(yi−β0−Xiβ(t))(β0−Xiβ(t))(1−β0−Xiβ(t))Xi
= N
X
i
σ(yi−yˆ(t))( ˆy(t))(1−yˆ(t))Xi (2.3)
where we substitute ˆy(t)for the predicted value ofy at the current value of the parameters,
i.e. ˆy=σ(β0(t)+Xiβ(t)), for simplicity.
With a binary output, we might prefer a different loss. The cross-entropy loss function, given
in Equation 2.4, offers an alternative.
E(t)= − N
X
i
¡
yiln ˆy(it)+(1−yi) ln(1−yˆ(it))
¢
(2.4)
∂E(t) ∂β =
N
X
i
( ˆyi(t)−yi)Xi (2.5)
I skip some algebraic manipulation to arrive at Equation 2.5, which we obtain with two
ap-plications of the chain rule. The result is rather elegant. As the equation shows, the derivative
of the cross-entropy function simplifies to an expression in terms of ( ˆyi(t)−yi), or the differ-ence between the prediction and the target output value. Contrast this with the expression in
Equation 2.3, where the magnitude of the derivative depends onσ(yi−yˆi(t)). Referring to Figure 2.2, one can see that the sigmoid function curve levels off at either extreme. In the
classifica-tion (or logistic regression) scenario, this would correspond to situaclassifica-tions where the predicted
probabilities are either close to zero, or close to one.
As a result, the gradient descent algorithm will tend to slow when predictions approach one
or zero. Similarly, updating can be slower with the squared error loss because errors are simply
penalized less. In a situation where the target output for observationi is 1 and the predicted