Cover Page
The handle http://hdl.handle.net/1887/21914 holds various files of this Leiden University
dissertation.
Author
: Khmelinskii, Artem
Title
: Multi-modal small-animal imaging: image processing challenges and applications
Multi-modal small-animal imaging:
Colophon
Multi-modal small-animal imaging: image processing challenges and applications Ph.D. thesis with a summary in Dutch
Leiden University Medical Center (LUMC)–Leiden University, Leiden the Netherlands
This work was carried out in the ASCI graduate school. ASCI dissertation series number 280
Financial support for the publication of this thesis was kindly provided by:
- Advanced School for Computing and Imaging, the Netherlands
- Bontius Stichting inz. Doelfonds Beeldverwerking, Leiden, the Netherlands
- Universitaire Bibliotheken Leiden, Leiden, the Netherlands
ISBN 978-90-6464-698-0
© 2013 Artem Khmelinskii, Leiden, the Netherlands
Multi-modal small-animal imaging:
image processing challenges and applications
Proefschrift
ter verkrijging van
de graad van Doctor aan de Universiteit Leiden,
op gezag van Rector Magnificus Prof. mr. C. J. J. M. Stolker,
volgens besluit van het College voor Promoties
te verdedigen op woensdag 9 oktober 2013
klokke 10.00 uur
door
Artem Khmelinskii
Promotiecommissie
promotor: Prof. dr. ir. B. P. F. Lelieveldt
Leiden University Medical Center Delft University of Technology
co-promotor: Dr. ir. M. Staring
Leiden University Medical Center
overige leden: Prof. dr. M. Hoehn
Max Planck Institute for Neurological Research, Cologne
Prof. dr. ir. M. Hendriks-de Jong
Contents
Chapter 1 Introduction 1
Chapter 2 Articulated whole-body atlases for small animal image
analysis: construction & applications 13
Chapter 3 Segmentation and visual analysis of whole-body mouse
skeleton µSPECT 35
Chapter 4 Atlas-based organ & bone approximation for ex vivo
µMRI mouse data 51
Chapter 5 Interactive local Super-Resolution Reconstruction of MRI whole-body mouse data: applications to bone and kidney metastases
61
Chapter 6 A visualization platform for high-throughput, follow-up,
co-registered multi-contrast MRI rat brain data 79
Chapter 7 Brain maturation of the adolescent rat cortex
and striatum: changes in volume and myelination 91
Chapter 8 Summary and conclusions 111
Samenvatting en conclusies 119
Acknowledgements 127
List of publications 129
Chapter 1
1.1
Background
In pre-clinical research, whole-body small animal imaging is widely used for the
in vivo visualization of functional and anatomical information to study the different
biological processes that take part in cancer, neurological and cardiovascular diseases, and help with a faster development of new drugs. Mice in particular are used, not only because they are small, have a fast reproduction rate, are easy to handle and widely available, but also because they share about 97.5% of human DNA [1, 2].
With the miniaturization of different clinical imaging equipment [3] the importance of small-animal imaging continues to grow [4]. Functional information (changes in metabolism, blood flow, regional chemical composition and absorption—physiological activities) is provided by imaging modalities such as positron emission tomography (PET), single-photon emission computed tomography (SPECT) and specialized magnetic resonance imaging (MRI). Both PET and SPECT have a high sensitivity and only nanomolar concentrations of molecular probes are needed for imaging. In SPECT, the nuclear isotopes are more readily available, cheaper, and have longer half-lives as compared to PET. PET however, has a slightly higher sensitivity [5].
Structural imaging modalities like radiography, computed tomography (CT), MRI and ultrasound provide detailed depictions of anatomy. µCT nowadays combines excellent spatial resolution with fast acquisition times. It is an excellent modality for bone imaging. Ultrasound is a real-time imaging modality that allows to visualize blood flow in vivo, and can be used to study blood flow and cardiac function in mice. It is extremely cost-effective and non-invasive. MRI provides good spatial resolution and has excellent contrast resolution to distinguish between normal and pathological tissue.
Optical imaging modalities, such as bioluminescence imaging (BLI), Fluorescence Imaging (FLI) and near-infrared (NIR) fluorescence imaging offer a high sensitivity in visualizing molecular processes in vivo. Optical imaging is fast and easy to perform, and relatively inexpensive. Bioluminescence imaging is often employed for assessing therapeutic response because of its excellent sensitivity whilst fluorescence imaging facilitates tumor growth monitoring because of its quick and convenient multiple time-point image capture [5].
1
1.2
Image processing challenges and motivation
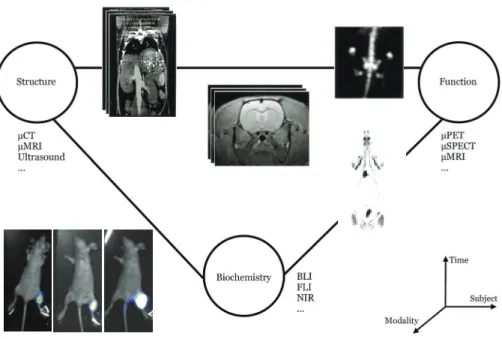
With all these advances in image acquisition, the problem is shifting from data acquisition to data processing. The organization, analysis and interpretation of this heterogeneous integrated whole-body imaging data (Figure 1.1) has become a demanding task for the following reasons:
the postural variability of the subjects between scans. There are little to no standardized protocols for whole-body animal imaging. If a subject is imaged using different imaging modalities and protocols, during follow-up studies or cross-sectional studies, the subject is positioned in different ways and postural variations occur (head, back and front limbs, etc.). This greatly complicates data analysis and comparison. Although there are some multimodality animal holders, to date they are not widely used or generally compatible with all the different scanners, and even with the use of the holders, there are still significant differences in animal posture in longitudinal studies
the high-throughput nature of the data. More and more small-animal imaging is used in a life-span setting for drug development, in cancer studies and developmental studies. Exploring, detecting, visualizing and quantifying those changes in a robust way has become essential to utilize the full potential of the data
the heterogeneous image structure. Some modalities provide 2D images (BLI), other, 3D (MRI, CT). Some are photographs, other are tomographic modalities. Some provide full whole-body information, other only functional information on only specific organs or lesions. Adding the temporal dimension, 4D images are used in follow-up and cross-sectional studies using different animals
Figure 1.1 Organizing, analyzing and interpreting heterogeneous imaging data has become a demanding task for the following reasons: (i) the high-throughput nature of the data (longitudinal and developmental studies); (ii) the heterogeneous image structure (2D BLI images, 3D MRI and CT data); (iii) sometimes the whole-body is imaged, sometimes only a specific organ (e.g.: brain imaging); (iv) the postural variability of the subjects between scans (as depicted here in the example given for the BLI photographs)
1.3
Previous work
1
depends on the availability of a correspondent co-registered CT dataset. In [10], Suh et al. developed a weighted demons registration method that can give preferences to particular regions of the input image using a weight image to register whole body rat CT image and PET images. Wang et al. [11] proposed in a simulation study the use of non-tomographic modalities like X-ray projections, to provide organ-level anatomical references of small animals in 3D by registering a digital mouse atlas. Le et al. [12] on the other hand developed an automatic non-rigid registration of whole body CT mice images. This method however cannot deal with very large postural differences.
As such, the recent interest in atlas based approaches has enabled combinations of different modalities, mainly in pairs. However, little to no work has been reported that enable combining several (>2) modalities into a comprehensive analysis framework, that also allows the study of follow-up data.
1.4
Contextualization
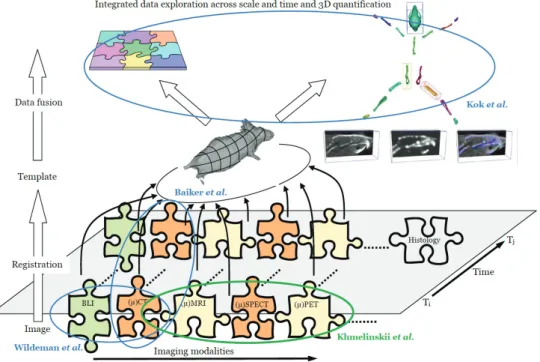
In this thesis, we further explore the approach as depicted in Figure 1.2, that served as a basis for the molecular image analysis research as performed at Laboratorium voor Klinische en Experimentele Beeldverwerking (LKEB)–LUMC. This approach is based on an articulated whole-body atlas as a common reference to normalize the geometric heterogeneity caused by postural differences, anatomical differences between individuals and geometric differences between imaging modalities. Mapping to this articulated atlas has the advantage that all the different imaging modalities can be (semi) automatically registered to a common anatomical reference; postural variations can be corrected, and the different animals can be scaled properly.
In the context of this framework (Figure 1.2), Wildeman et al. [13] proposed a 2D/3D registration of μCT data to multiview photographs based on a 3D distance map combining optical/BLI data with CT. Baiker et al. [14] on the other hand, presented a fully automated skeleton registration and organ approximation method using an articulated whole-body atlas in μCT mouse data [14]. This method was validated on 41 CT datasets and was successfully used to follow osteolytic lesions quantitatively and visually over time [14].
Kok et al. focused on integrating the whole-body data exploration across scale and
time. For this purpose, he introduced the Articulated Planar Reformation (APR) algorithm [15], where after registering the articulated atlas to the data at hand, that data is reformatted along individual skeletal elements, and displayed in the atlas reference view. In this view, each volume of interest (VOI) corresponds to a single bone, which can be interactively selected for direct comparison with the corresponding VOI at another time-point or of another subject. Comparative visualization techniques that automatically highlight change over time were also provided [15].
morphometry method for mouse brain MRI analysis with application to Alzheimer’s Disease research in transgenic mice [1, 16, 17, 18].
Abdelmoula et al. recently proposed an automatic registration method to fuse both microscopic optical histology images and matrix assisted laser desorption ionization imaging mass spectroscopy (MALDI-IMS) data of the mouse brain. This allows to correlate the information about the neuroanatomical structures provided by the former with the chemical/molecular information provided by the latter. This assists in the early detection and diagnosis of migraine.
Mahfouz et al. is currently studying correlations between the specificity of certain groups of neuroreceptors to different regions of the mouse brain. The goal is to understand which genes/regulators are co-expressed with each neuroreceptor in different brain regions and link the functions of these neuroreceptors, genes and regulators to these brain regions.
Figure 1.2 Overview of the proposed integrated approach. The data acquired using different imaging modalities for different time-points is registered to the common reference, which in this case is an
1
1.5
Scope of this thesis
As mentioned above, in Figure 1.2, aspects such as whole-body follow-up registration and integrated visualization in the general approach have been addressed. In this thesis, we have focused on three complementary aspects, and worked towards an automated analysis pipeline for quantitative small animal image analysis. The specific goals of this thesis are:
(i) to further generalize the articulated atlas-based registration method to the multi-modality component of the global approach presented in Figure 1.2, focusing on SPECT and MRI whole-body mouse data
(ii) to expand the Articulated Planar Reformation algorithm by linking it to recently introduced resolution-enhancing MR reconstruction techniques which enable “zooming in” on small anatomical details not detectable with conventional MRI
(iii) to prove the added value of atlas-based analysis of multi-modal follow-up data in a life-science study of the ageing processes in the brain, with a specific focus on multi-contrast MR rat brain data
1.6
Thesis outline
The remainder of this thesis is structured as follows.
In Chapter 2, an overview of the construction process of an articulated small
animal atlas together with its applications is described. Using three publicly available whole-body small animal atlases (MOBY mouse [19], Digimouse [20] and
SD Rat [21, 22]), each skeleton is segmented manually into individual bones or bone groups. For each bone, its corresponding joint(s) locations together with anatomically realistic degrees of freedom are defined. These labeled atlases form the basis of the methodology presented in Chapters 3, 4 and 5.
In Chapter 3, a method for whole-body µSPECT mouse data segmentation and
Chapters 4 and 5 focus on MRI mouse data. In Chapter 4, a novel semi-automated atlas organ and bone approximation for µMRI mouse data is presented. Guided by anatomically realistic kinematic constraints imposed by the articulated MOBY atlas the user interactively identifies a number of joints/landmarks in the MRI dataset. Individual atlas bones are automatically mapped to the target data based on the joint correspondences and the organs are mapped using Thin-Plate-Spline interpolation. In Chapter 5, the relevance of combining the articulated atlas-based segmentation and articulated planar reformation solutions for whole-body mouse data is further extended. An end-to-end integrated interactive approach is presented where, guided by BLI hotspots, VOIs in whole-body mouse MRI are super-resolution reconstructed (SRR) and presented in the standardized atlas space complemented by anatomical CT, for study of (micro) bone metastasis. This approach allows to overcome the limitations of CT in investigating small/micro tissue-events like micro tumors (less than half slice thickness), soft tissue tumors pathology, the homing of labeled stem cells or disease and inflammatory test pools. It also allows to overcome the high computation demand of the SRR technique when applied to large datasets (whole-body mice in this case). Chapters 6 and 7 are dedicated to an explorative study of juvenile development and ageing processes of the brain. In Chapter 6, a visualization platform for side-by-side exploration of co-registered high-throughput, follow-up, cross-sectional, multi-contrast MRI rat brain data is presented. This tool is built to assist in the exploration of this high-throughput and highly heterogeneous life-span rat brain data. Its functionality and utility in molecular imaging research are evaluated by means of a case study evaluation with three domain experts. In Chapter 7 results of this development and ageing study are presented.
In Chapter 8, main findings of each chapter are summarized and future work is
discussed.
References
[1] Scheenstra A. Automated morphometry of transgenic mouse brains in MR
images 2011
[2] Fox J. G., Barthold S. W., Davisson M. T. et al. The Mouse in Biomedical
Research: Diseases Academic Press, 2nd edn. 2007.
[3] Massoud T. F. and Gambhir S. S. Molecular imaging in living subjects:
seeing fundamental biological processes in a new light Genes and
Development 17(5): 545–580 2003
[4] Lelieveldt B. P. F., Botha C. P., Kaijzel E. L. et al. Towards integrated
analysis of longitudinal whole-body small animal imaging studies Proc
IEEE Intal Conf on Acoustics, Speech and Signal Processing 5768–5771 2011 [5] Koo V., Hamilton P. W. and Williamson K. Non-invasive in vivo imaging in
1
[6] Joshi A. A., Chaudhari A. J., Li C. et al. Posture matching and elastic
registration of a mouse atlas to surface topography range data Proc IEEE
Intl Symp Biomed Imaging 366–269 2009
[7] Savinaud M,. de La Gorce M., Maitrejean S. et al.Model-based multi-view
fusion of cinematic flow and optical imaging Med Image Comput Comput
Assist Interv 13(Pt2): 668–675 2010
[8] Suh J. W., Scheinost D., Dione D. P. et al.A non-rigid registration method
for serial lower extremity hybrid SPECT/CT imaging Med Image Anal 15(1):
96–111 2011
[9] Gutierrez D. F. and Zaidi H. Automated analysis of small animal PET
studies through deformable registration to an atlas Eur J Nucl Med Mol
Imaging39(11): 1807–20 2012
[10] Suh J. W., Kwon O. K., Scheinost D. et al.CT-PET weighted image fusion for
separately scanned whole body rat Med Phys 39(1): 533–42 2012
[11] Wang H, Stout D. B. and Chatziioannou A. F. Mouse Atlas Registration with Non-tomographic Imaging Modalities—a Pilot Study Based on Simulation
Mol Imaging Biol 14: 408–419 2012
[12] Li X., Yankeelov T. E., Peterson T. E. et al.Automatic nonrigid registration
of whole body CT mice images Med Phys 35(4): 1507–20 2008
[13] Wildeman M. H., Baiker M., Reiber J. H. C. et al. 2D/3D registration of
micro-CT data to multi-view photographs based on a 3D distance map Proc
IEEE Intl Symp Biomed Imaging 987–990 2009
[14] Baiker M., Milles J., Dijkstra J. et al. Atlas-based whole-body segmentation
of mice from low-contrast micro-CT data Med Image Anal 14(6): 723–737
2010
[15] Kok P., Baiker M., Hendriks E. et al. Articulated planar reformation for
change visualization in small animal imaging IEEE T Vis Comput Gr 16(6):
1396–1404 2010
[16] Scheenstra A. E. H., Dijkstra J. and van der Weerd L. Volumetry and other
quantitative measurements to assess the rodent brain Methods Mol Biol
771: 277–291 2011
[17] Muskulus M., Scheenstra A. E. H., Braakman N. et al. Prospects for early detection of Alzheimer's Disease from serial MR Images in transgenic
mouse models Curr Alzheimer Res 6(6): 503–518 2009
[18] Scheenstra A. E. H., Muskulus M., Staring M. et al.The 3D Moore-Rayleigh
test for the quantitative groupwise comparison of MR brain images Inf
Process Med Imaging 21: 564–575 2009
[20] Dogdas B., Stout D., Chatziioannou A. et al. Digimouse: a 3D whole body mouse atlas from CT and cryosection data Phys Med Biol 52(3): 577–587 2007
[21] Bai X., Yu L., Liu Q. et al. A highresolution anatomical rat atlas J Anat 209(5): 707–708 2006
Chapter 2
Articulated whole-body atlases for small
animal image analysis: construction &
applications
Abstract
Using three publicly available small-animal atlases (Sprague–Dawley rat, MOBY, and Digimouse), we built three articulated atlases and present several applications in the scope of molecular imaging. Major bones/bone groups were manually segmented for each atlas skeleton. Then, a kinematic model for each atlas was built: each joint position was identified and the corresponding degrees of freedom were specified. The articulated atlases enable automated registration into a common coordinate frame of multimodal small-animal imaging data. This eliminates the postural variability (e.g., of the head, back, and front limbs) that occurs in different time steps and due to modality differences and nonstandardized acquisition protocols. The articulated atlas proved to be a useful tool for multimodality image combination, follow-up studies, and image processing in the scope of molecular imaging. The proposed models were made publicly available.
2.1
Introduction
In preclinical research, different imaging modalities are used for the in vivo
2
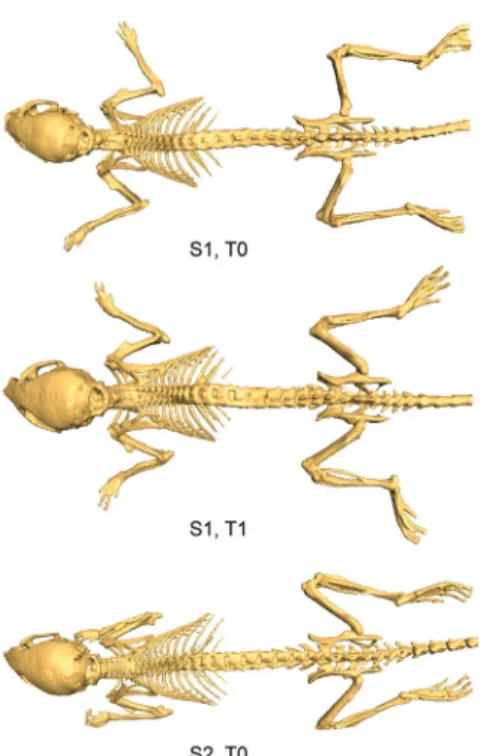
Figure 2.1 Illustration of the postural variability (limbs, head) that occurs in follow-up and cross-sectional molecular imaging studies: top and middle mouse—same subject S1, two time steps T0 and T1; bottom mouse—different subject S2
One way of handling this problem is to use atlases. In biomedical imaging research, anatomical atlases have proven to be useful for defining a standard geometric reference for further subject analysis and meaningful comparisons. Atlases may consist of a 3D, sometimes 4D, whole-body or organ-based geometric representation. This enables mapping functional activity and anatomical variability among individuals and populations. Considering the issues mentioned above, having such a model allows for a more effective way to combine, structure, and execute all sorts of comparisons and correlations within the data. For example, it is possible to make population brain studies in a specific time frame. For that, brain images from each individual, obtained through MRI, PET, and other imaging techniques, are spatially warped to a brain template. After combining the data, inferences are made about tissue identity at a specific location by referring to the atlas or looking for variability of those locations within that population.
for both male and female human bodies. The available datasets were designed to serve as a reference for the study of human anatomy and have been applied to a wide range of educational, diagnostic, treatment planning, virtual reality, and artistic, mathematical, and industrial uses [2]. The 4D NCAT phantom on the other hand provides a more realistic model of the human anatomy and motions because it does not sacrifice any flexibility to model the anatomical variations and patient motion and has been used in SPECT simulations [3]. For a more detailed survey on computational anatomical and physiological models, see [4].
Within the scope of preclinical molecular imaging research, there are various mouse and rat atlases with different characteristics and purposes, acquired using different techniques (CT, MRI, cryosectioning, etc.). Many of those are thoroughly described and published in literature and are publicly available: the LONI Rat atlas published by the UCLA Laboratory of Neuro Imaging [5] and other brain focused atlases [6–10], the Edinburgh Mouse Atlas Project [11] that describes and presents a 3D model of the mouse embryo, the MRI Atlas of Mouse Development from the California Institute of Technology [12], the Mouse Cochlea Database made by the University of Minnesota [13], and whole-body small animal atlases like MOBY mouse [14] and Digimouse [15] and the high resolution Sprague–Dawley (SD) rat [16, 17].
However, these mouse and rat atlases are either specific, organ-dedicated atlases (brain, hypothalamus, heart, etc.), low-resolution, or cannot deal with the large postural variations that occur within the scans acquired using different imaging modalities during follow-up studies (different time steps) or if different animals are used because mice are positioned in different ways when scanned and there is no standardized acquisition protocol.
The work described here addresses the abovementioned problems by introducing articulations in three existing whole-body atlases: (1) Digimouse [15], (2) MOBY mouse [14], and (3) high-resolution SD rat [16, 17]. A kinematic model is built for each atlas where bones in each skeleton are manually segmented and labeled, and the corresponding degrees of freedom (DoFs) for each joint are defined.
Mapping to this articulated atlas has the advantage that all the different imaging modalities can be (semi) automatically registered to a common anatomical reference; postural variations can be corrected, and the different animals (according to strain, size, age, body fat percentage) can be scaled properly.
The goals of this work are to:
(i) Introduce the concept of the articulated whole-body small animal atlas (ii) Present and discuss several implemented application examples: atlas to
µCT data registration, follow-up µCT studies, cross-sectional µCT studies, multimodality atlas to BLI and µCT image registration and analysis, and atlas to µMRI data approximation; and
2
2.2
Methods
2.2.1 Atlas descriptions
Presently, in the work described here, three small animal atlases are used. In this section, a brief description of each one is presented.
MOBY (mouse whole-body) atlas
Segars et al. generated a realistic 4D digital mouse phantom based on high-resolution 3D MRI data from Duke University. The organs of this atlas were built using non-uniform rational b-spline (NURBS) surfaces, which are widely used in 3D computer graphics.
The final package includes a realistic 3D model of the mouse anatomy and accurate 4D models for the cardiac and respiratory motions. Both the cardiac and respiratory motion models were developed based on cardiac gated black-blood MRI and respiratory gated MRI data from the University of Virginia. It has been used in simulation studies in SPECT and X-ray CT [14].
Digimouse atlas
Dogdas et al. constructed a 3D whole-body multimodal mouse atlas from co-registered X-ray µCT and color cryosection data (anatomical information) of a normal nude male mouse. It also includes PET data (functional information) representing the distribution of a mixture of the tracers [18F] fluoride and 2-deoxy-2-[18F]fluoro-D-glucose within the mouse. The image data were co-registered to a common coordinate system using the fiducials and resampled to an isotropic 0.1 mm voxel size. Using interactive editing tools, several organs were segmented and labeled.
The final atlas consists of the 3D volume (in which the voxels are labeled to define the anatomical structures listed above) with co-registered PET, X-ray CT, and cryosection images and can be used in 3D BLI simulations and PET image reconstruction [15].
High-resolution SD rat atlas
Xueling et al. built a highresolution 3D anatomical atlas of a healthy adult SD rat from 9,475 horizontal cryosection images (at 20 μm thickness). Coronal and sagittal section images were digitized from the horizontal sections and anatomical structures under the guidance of an experienced anatomist. The 3D computerized model of the rat anatomy was generated using a parallel reconstruction algorithm and interactive atlas-viewing software was developed that offers orthoslice visualization, featuring zoom, anatomical labeling, and organ measurement. Also, an interactive 3D organ browser based on a virtual reality modeling language was deployed on a website. The models of each organ and tissue constructed from the images were used for calculations of absorbed dose from external photon sources [16, 17].
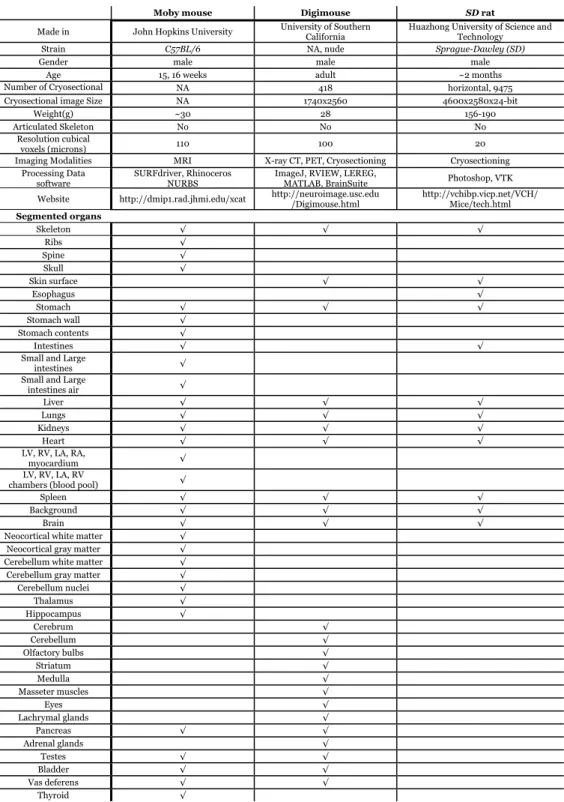
the Appendix, an overview of the main differences between these three atlases is presented.
2.2.2 Articulated atlas constructions
In all the abovementioned atlases, the included skeletons do not distinguish between single bones and joints. To render the registration performance independent of the data acquisition protocol and large postural variations due to postural heterogeneity between scans, we present a segmentation of the skeleton into individual bones and add anatomically realistic kinematic constraints to each joint.
Segmenting the skeleton
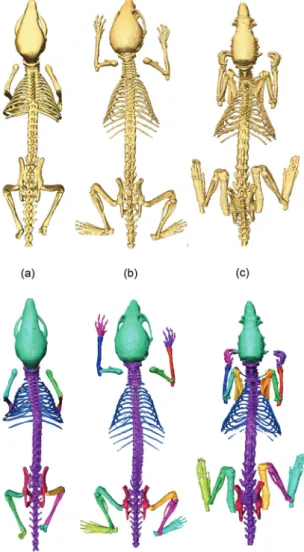
The first step was to manually segment the following bones/bone groups in each atlas from the skeleton using the Amira™ V3.1 software [18], guided by anatomical text books [19, 20], and a high resolution CT scan of a real mouse: scapula,
humerus (upper front limb), clavicula (collarbone, rat only), ulna-radius (lower
front limb), manus (front paw), femur (upper hind limb), tibia-fibula (lower hind limb), pes (hind paw), caput (skull), columna vertebralis (spine), costae (ribs),
sternum (chest bone), and pelvis. The resulting labeled skeletons for each atlas can
be seen in Figure 2.2
Introducing joint kinematics
In the second step, a kinematic model for each atlas was built, i.e., each joint position was identified and the corresponding DoFs were specified. Two types of joints were distinguished: ball joints and hinge joints.
In Table 2.1, the DoFs for the ball and hinge joints can be seen. These DoFs are anatomically correct and were defined according to expert specifications described in literature [19, 20].
Table 2.1 Joint types in the atlas skeleton and the correspondent DoFs [21], pictograms from [22]
2.2.3 Atlas-based whole-body registration/segmentation of small animals datasets
The skeleton is the rigid frame of the animal, in the sense of tissue stiffness. Besides the articulations of individual bones with respect to each other, little deformation takes places in the bones themselves within the same animal. This is in contrast to,
Joint types Modeled joint DoFs of the articulated bone
2
e.g., organs, which highly vary in shape, depending on the posture of the animal.Therefore, a robust registration strategy should be based on the skeleton. Although there are approaches in literature that perform small animal whole-body image registration based on the entire skeleton [23, 24], these methods may fail if large postural variations among different animals or among the same animal in a follow-up study occur.
Therefore, we propose an approach that employs the articulated skeleton model as described above for registration of the skeleton in a first step. Organs are non-rigidly matched in a second step, initialized by the result of the skeleton matching.
Figure 2.2 Illustration of the three segmented skeletons for each atlas: top row—before partitioning, bottom row—after partitioning. (a) MOBY, (b) Digimouse, and (c) SD rat
Skeleton registration
first step, all bones can subsequently be matched individually by executing the registration from proximal to distal bone segments. The registration of a distal segment is thereby constrained by the joint type of the proximal bone it connects to. For example, for the tibia, the registration is constrained by the DoFs of the knee joint. The deformation model that is required for the individual bones depends on the type of study and may vary between rigid (intra-subject) and non-rigid (inter-subject) deformation models. The selected registration criterion depends on the modality of interest. It can be a point-based (e.g., Euclidean distance), surface-based (e.g., Euclidean distance and surface curvature), or volume-based registration criterion (e.g., Normalized Mutual Information). In this paper, we limited ourselves to a surface-based registration measure, i.e., the Euclidean distance between two surfaces. Since the registration has to deal with large articulations, potentially pathological data (as a result of bone resorption) and inter-subject data, a rigid transformation model including non-isotropic scaling was chosen. This renders the registration robust to pathological cases while still taking different bone sizes into account. The registration was embedded in the Iterative Closest Point [25] framework and optimized using an interior-reflective Newton method.
Organ registration
The registered skeleton allows us to initialize the registration of several other major organs, because their location is strongly dependent on the animal posture. To realize this, the transformation model should be chosen such that it can handle the large deformations that can occur for soft tissues. Many methods have been proposed for registration of individual organs (see e.g., [26, 27] for reviews), which are not discussed further here. In the applications described next, we selected thin-plate-spline (TPS) interpolation [28]. The required anatomical landmarks that define the TPS mapping are primarily derived from the registered skeleton. To this end, we compute a sparse set of initial correspondences on the animal skin by selecting the skin points closest to a set of anatomical landmarks on the skeleton
(e.g., the joints). From this sparse set of skin points, a denser set of point
correspondences is calculated by means of an iterative matching of local distributions of geodesic distances [21]. This results in a set of correspondences on the skin and on the skeleton, which in combination define the TPS interpolants.
Evaluation metrics for registration accuracy
To evaluate the accuracy of the registration algorithm for the skeleton, skin, and organs, three different error metrics were defined [21]:
Joint localization error is calculated as the Euclidean distance between corresponding anatomical landmarks (point-to-point distance). To this end, the locations of the upper lower limb and the lower limb-paw joints of all datasets were indicated manually using the extracted skeleton surfaces. For validation, the manually determined joint locations were compared to those automatically determined by registration of the skeleton
Euclidean point-to-surface distance was determined to quantify border positioning errors. It was used to evaluate the registration error over the surface of the entire skeleton and skin
2
and an automated segmentation. It is a voxel-based measure and therefore includes differences in object sizes as well as spatial misalignment [30]. Given the absolute volumes of a manual segmentation result Vm and an automated
segmentation result Va, the Dice coefficient is defined as the intersection of the volumes, divided by the average volume:
(1)
2.3
Applications
In this section, three application examples are presented that employ the articulated skeleton model for analysis of follow-up, cross-sectional, and multimodality small animal imaging studies. Each application was quantitatively validated.
2.3.1 Atlas to µCT registration for follow-up and cross-sectional µCT
studies
Whole-body segmentation based on articulated skeleton registration
Anatomical referencing of molecular events inside the animal using non-contrast-enhanced µCT is difficult, because although the skeleton can be extracted easily from the data as a whole it is often required to know exactly in which bone the molecular event takes places and because the poor soft-tissue contrast in the abdomen complicates organ localization and renders registration very difficult. Above that, µCT is often used in oncological studies to assess metastatic activity in bone, and since the locations where possible metastases can develop greatly varies, a very flexible data acquisition protocol with respect to animal positioning in the scanner is required. For such applications, animal posture, shape, and limb position may vary substantially.
To deal with the challenges specific to µCT, we employ the fully automated articulated atlas-based skeleton and organ segmentation method for non-contrast-enhanced whole-body data of mice [21] described in the section above. The skeleton is represented with a surface, derived from the modified MOBY atlas. To test the proposed method, data acquired during a study of the metastatic behavior of breast cancer cells were used. Breast cancer has a preference to metastasize to bone, and at the location of a metastatic lesion, osteolysis occurs, causing structural damage in the skeleton (fractures or completely resorbed bones). The subject was injected with luciferase positive human MDA-MB-231 breast cancer cells into the cardiac left ventricle. The animal was scanned 40 days after cell injection to screen for possible small amounts of photo-emitting tumor cells in bone marrow/bone mimicking µCT-metastatic spread. Nine anesthetized mice
(BALB/c, Charles River WIGA, Sulzfeld, Germany), 6–9 week old, eight female, one
male, with a mean weight of 22.23±2.18 g, were acquired with a Skyscan™ (Kontich, Belgium) 1178 µCT scanner. Fourteen 3D data volumes of the nine mice were acquired with step size 1°, 50 keV X-ray voltage, an anode current of 200 μA, an aluminum filter of 0.5 mm thickness, an exposure time of 640 ms, and without
using a contrast agent. The reconstructed datasets covered the range between
−1,000 (air) and +1,000 (bone) Hounsfield units. Neither cardiac nor respiratory gating was used. The mice were scanned in arbitrary prone and supine postures and arbitrary limb positions. Table 2.2 shows the joint localization and point to surface errors for before and after registering the articulated atlas skeleton, lungs, and skin to the data. Subsequently, the brain, heart, liver, kidneys, spleen, and stomach were mapped from the atlas to the subject using TPS interpolation [21].
Before registration After registration Joint localization error (mm)
Right knee 14.29 ± 5.51 0.75 ± 0.29
Right ankle 18.70 ± 5.87 1.82 ± 1.01
Left knee 16.61 ± 4.80 0.77 ± 0.26
Left ankle 19.93 ± 5.15 1.69 ± 1.14
Right elbow 5.66 ± 2.11 1.31 ± 0.44
Right wrist 15.56 ± 4.49 1.27 ± 0.53
Left elbow 5.23 ± 2.96 1.23 ± 0.39
Left wrist 18.04 ± 6.47 1.21 ± 0.56
Euclidean point to surface distance (mm) Entire skeleton 3.68 ± 0.77 0.58 ± 0.03
Lungs 1.27 ± 0.26 0.47 ± 0.03
Skin 11.06 ± 8.49 0.75 ± 0.53
Table 2.2 Skeleton, lungs, and skin registration results. The results are separated in two columns: before registration, i.e.: after the initialization alone and after registration. For the bone, the used error metric is the joint localization error, while for the lungs, skin, and the whole skeleton, it is the point to surface distance
2
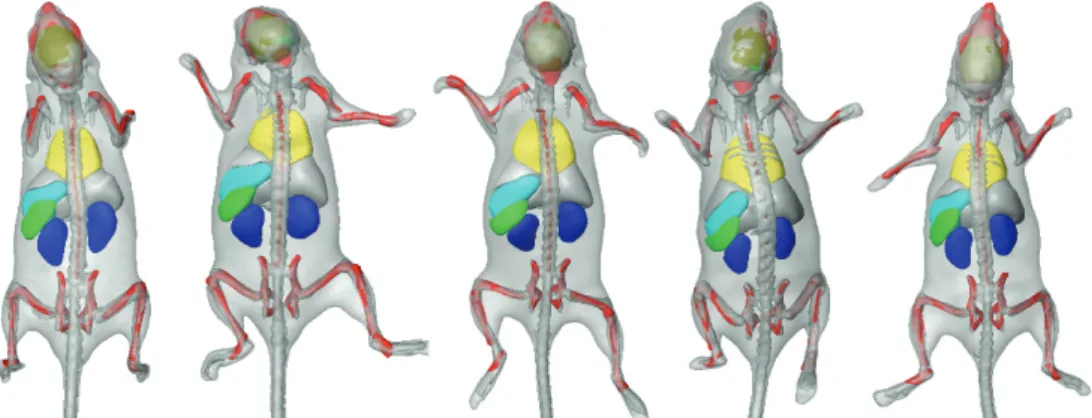
The result is a segmentation of the animal body into individual bones and major organs. This can be used for qualitative assessment of morphology at a single point in time in one or more animals—a cross-sectional study (Figure 2.3), or to follow morphological changes over time—a follow-up study (Figure 2.4). To facilitate the comparison of cross-sectional and follow-up data, also visualization concepts were developed that are based on mapping the data to a common reference frame and present the results simultaneously (Figure 2.5).
Figure 2.4 Skeleton registration and organ approximation using the same subject, at five different time points (4 weeks). The animal was put into the acquisition device arbitrarily, in supine (first three) and prone (last two) position, respectively, and the postural variations of the head, back, and front limbs are clearly visible
2.3.2 Multimodality registration, visualization and analysis
Combination of BLI and segmented µCT data
BLI is an imaging technique that has found widespread application in preclinical research over the past years. It is used to track cells and monitor the function of specific genes and processes in the cellular biochemistry with a high sensitivity in living animals. A typical application domain is oncology, where researchers aim at monitoring the development of metastases using a highly sensitive optical modality, BLI, and relate it to morphological changes using an anatomical modality like µCT [31, 32].
Figure 2.5 Demonstration of mapping the registered bones of four different animals from the corresponding target domain to a common reference domain (the MOBY atlas domain). The large postural differences of the animals (left) are not present any more (right), enabling a more intuitive comparison of different time points
The BLI data in this work were acquired using the Xenogen IVIS Imaging System, 3D series scanner by Caliper LifeSciences™ (Alameda, USA). The data were collected from a study with two experiments in mice on the metastatic behavior of breast cancer cells as to visually verify the reconstructed BLI sources with the injection site as seen in the µCT data. One hundred thousand RC21-luc cells-luciferase expressing human renal carcinoma cell line and 100 μl 100,000 KS483-HisLuc cells-luciferase expressing murine mesenchymal stem cell line were injected under the renal capsule and into the left heart ventricle, respectively, and scanned after 3 to 4 weeks (time for the carcinoma to establish).
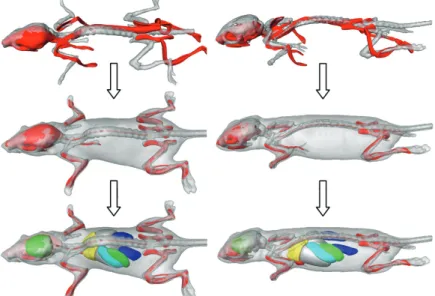
Two alternative ways have been worked out to perform the BLI to CT registration. A semi-automated method, which requires manual selection of at least three anatomical landmarks both on the photographs, and the CT data were implemented. Subsequently, these corresponding landmarks are used to map one data domain to the other. As a second approach, a fully automated way to perform this registration was implemented. Based on the skin contours on the photographs, a 3D distance map is derived and used for registration of the animal skin, derived from CT [33]. In addition, the atlas to CT mapping as described above can be applied as well. The result is a fully segmented animal that serves for anatomical referencing if combined with a qualitative BLI source localization algorithm (e.g.,
2
Figure 2.6 Overview of the steps towards a combined visualization of fully segmented whole-body µCT and BLI data. The MOBY atlas is registered to the µCT data and subsequently, the µCT data are registered to the BLI data using the photographs either by using manually selected landmarks or fully automatically using a 3D distance map (see text). In the resulting visualization, the BLI source (red) is shown and can be related to the skeleton and organs
2.3.3 Atlas to μMRI approximation
Organ and bone approximation for ex vivo mouse data
Since µMRI data provide greater contrast between the different soft tissues of the body but poorer bone contrast than CT data, it can be used to closely follow the changes in phenotype in studies that require genetic modifications.
A novel semi-automated organ approximation method for μMRI mouse data that considerably reduces the required user effort compared to manual segmentation was implemented. It includes the limbs and provides a shape approximation of the bones in MR data. To derive the set of skin correspondences, the user interactively points out the joints/bone landmarks guided by anatomically realistic kinematic constraints imposed by the articulated atlas. Given this set of dense skin correspondences, the organ approximation is performed using the TPS approximation as described in the “Methods” section. The bone approximation is
performed by (1) automatically identifying all the joints out of the manually indicated landmarks and (2) applying a scaling and rotation to the atlas bone surfaces [35].
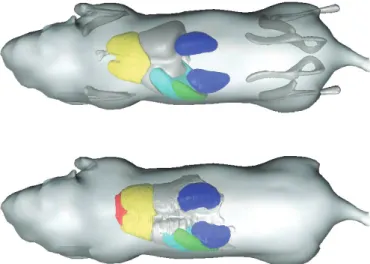
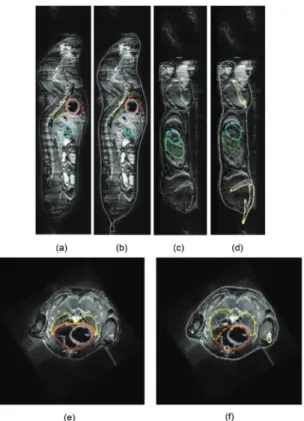
Application of the registration resulted in segmentations of the limbs and six major organs: heart, spleen, lungs, kidneys, liver, and stomach. See Figures 2.7 and 2.8 where the obtained results are presented both in 2D-and 3D visualizations, respectively. Table 2.3 shows the Dice coefficients for four major organs (heart, lungs, kidneys, and liver). In all the abovementioned application examples, experiments were executed using MATLAB™ R2008b (The Mathworks, Natick, USA) and took always ≤6 min of runtime in a 2.40 GHz Intel Quad Core™, with 4 GB of RAM, Windows™ PC.
Figure 2.7 Top—Atlas-based bone and organ approximation. Bottom—Manual organ segmentation
2.4
Discussion and conclusions
2
Figure 2.8 Organ and bone approximation results for µMRI mouse data: a, c, e—manual organ segmentation. b, d, f—organ and bone approximation results. Coronal and sagittal planes, respectively. yellow lungs, red heart, green spleen, cyan stomach, cream bone, gray skin, white liver. Reproduced from [35] with permission
The obtained results for the semi-automatic atlas to MRI data approximation were generally satisfactory and similar to the manual segmentations (heart, kidneys, liver), while for other organs the atlas approximations are more variable (organs with inherent shape variability such as the stomach and spleen), and errors were larger. The calculated Dice coefficients reveal “moderate” (0.41–0.6 [41]) performance for the lungs and mostly “substantial” (0.61–0.80) or “excellent” (>0.7 [42]) performance for heart, liver, and kidneys. The comparison of the calculated Dice coefficients with previously published results shows that while performing better than [37] and at a similar level as [39], the proposed method does not obtain as good results for the lungs as the method proposed in [38] (see Table 2.3). However, the example given in Figure 2.6 reveals that the proposed TPS mapping of the mouse major organs leads to a realistic approximation and can be used by biologists for qualitative anatomical referencing. Also, in the context of the intended application of combining segmented 3D data and BLI, the achieved accuracy should suffice to define a heterogeneous tissue model for Bioluminescence Tomography; it has been shown [43] that integration of tissue-specific photon properties yields more accurate and quantitative BLI source reconstruction than a homogeneous tissue model.
atlas to a 3D distance map, which is derived from multiple photographs. This is especially interesting for cases, where researchers are interested mainly in quantification of the light source. If morphological changes have to be studied in detail over time, a µCT scan would still be required. However, since these usually occur at a later point in time, CT data acquisition could be omitted at early time points and therefore reduce radiation burden of the animals.
The strategy applied here to make the atlases articulated was outlined to deal with major postural variations (involving long bones or large bone complexes); however, it can be extended to the whole skeleton to cope with any minor variation. One can define a kinematic model for each vertebra of the columna vertebralis (whereas here the columna vertebralis is defined as one big bone complex) and even to some non-rigid organs. Also, it is important to refer that often, depending on the task at hand, the DoFs for each bone/bone complex can be defined or redefined accordingly (e.g., in [21] some additional DoFs were allowed, although they are anatomically unnecessary, to compensate for errors that have been made during the specific task of whole-body atlas to 3D mouse data registration).
Mouse 1 Mouse 2 Mouse 3 [37] [38] [39]
Vs(mm3) Va(mm3) Dice Vs(mm3) Va(mm3) Dice Vs(mm3) Va(mm3) Dice Dice Dice Dice
Heart 292.62 227.16 0.65 282.36 241.83 0.80 292.56 202.19 0.74 0.4673 0.81 0.8161 Lungs 421.15 392.78 0.39 429.74 437.26 0.56 344.55 362.38 0.44 0.4871 0.82 N/A Kidneys 264.57 268.10 0.43 301.28 268.94 0.72 305.68 231.27 0.72 0.4363 0.60 0.5899
Liver 1131.77 1776.11 0.63 1087.54 1939.77 0.68 1484.82 1551.95 0.63 0.6508 0.80 N/A
Table 2.3 Organ approximation results for 3 μMRI mouse datasets: dice coefficients for four major organs—heart, lungs, kidneys, and liver. The last three columns provide a comparison with results obtained by Chaudari et al. [37], Baiker et al. [38], and Joshi et al. [39] for μCT data mouse data. Vs is subject volume, Va, atlas volume
The presented articulated models were made publicly available and can be downloaded from the “Articulated Atlases Download” section of the following web address: www.lkeb.nl
Acknowledgments
2
Appendix
Comparison of the three original atlases
Moby mouse Digimouse SD rat
Made in John Hopkins University University of Southern California
Huazhong University of Science and Technology
Strain C57BL/6 NA, nude Sprague-Dawley (SD)
Gender male male male
Age 15, 16 weeks adult ~2 months
Number of Cryosectional
i NA 418 horizontal, 9475
Cryosectional image Size NA 1740x2560 4600x2580x24-bit
Weight(g) ~30 28 156-190
Articulated Skeleton No No No
Resolution cubical
voxels (microns) 110 100 20
Imaging Modalities MRI X-ray CT, PET, Cryosectioning Cryosectioning Processing Data
software SURFdriver, Rhinoceros NURBS ImageJ, RVIEW, LEREG, MATLAB, BrainSuite Photoshop, VTK Website http://dmip1.rad.jhmi.edu/xcat http://neuroimage.usc.edu /Digimouse.html http://vchibp.vicp.net/VCH/ Mice/tech.html
Segmented organs
Skeleton √ √ √
Ribs √
Spine √
Skull √
Skin surface √ √
Esophagus √
Stomach √ √ √
Stomach wall √
Stomach contents √
Intestines √ √
Small and Large
intestines √
Small and Large
intestines air √
Liver √ √ √
Lungs √ √ √
Kidneys √ √ √
Heart √ √ √
LV, RV, LA, RA,
myocardium √
LV, RV, LA, RV
chambers (blood pool) √
Spleen √ √ √
Background √ √ √
Brain √ √ √
Neocortical white matter √
Neocortical gray matter √
Cerebellum white matter √
Cerebellum gray matter √
Cerebellum nuclei √
Thalamus √
Hippocampus √
Cerebrum √
Cerebellum √
Olfactory bulbs √
Striatum √
Medulla √
Masseter muscles √
Eyes √
Lachrymal glands √
Pancreas √ √
Adrenal glands √
Testes √ √
Bladder √ √
Vas deferens √ √
Thyroid √
2
References
[1]. Talairach J. and Tournoux P. Co-planar stereotaxic atlas of the human brain: 3-dimensional proportional system - an approach to cerebral
imaging Thieme Medical Publishers; New York 1988
[2]. The visible human project,
http://www.nlm.nih.gov/research/visible/visible_human.html
[3]. Segars W. P., Lalush D. S. and Tsui B. M. W. Modeling respiratory
mechanics in the MCAT and spline-based MCAT phantoms IEEE T Nucl Sci
48(1): 89–97 2001
[4]. Zaidi H., Tsui B. M. W. Review of Computational Anthropomorphic
Anatomical and Physiological Models P IEEE 97(12): 1938–1953 2009
[5]. Toga A. W., Santori E. M., Hazani R. et al. A 3D digital map of rat brain
Brain Res Bull 38(1):76–85 1995
[6]. Broadwell R. D. and Bleier R. A cytoarchitectonic atlas of the mouse
hypothalamus J Comp Neurol 167(3): 315–339 1976
[7]. Celio M. R., Hof P. R., Bloom F. E. et al.A computerized stereotaxic atlas of
the mouse brain Soc Neurosci Abst 24: 1065–1065 1998
[8]. MacKenzie-Graham A., Lee E. F., Dinov I. et al. A multimodal,
multidimensional atlas of the c57bl/ 6j mouse brain J Anat 204: 93–102
2004
[9]. Rosen G. D., Williams A. G., Capra J. A. et al.The mouse brain library Int Mouse Genome Conference 14: 166 2000
[10]. Thompson P. M., Mega M. S., Narr K. L. et al.Brain Image Analysis and
Atlas Construction In: Sonka M. and Fitzpatrick J. M., eds. Medical image
processing and analysis. Academic Press; chapter 17: 1063–1119 2000 [11]. Brune R. M., Bard J. B. L., Dubreuil C. et al. A three-dimensional model of
the mouse at embryonic day 9 Dev Biol 216: 457–468 1999
[12]. Dhenain M., Ruffins S. W. and Jacobs R. E. Three-dimensional digital
mouse atlas using high-resolution MRI Division of Biology 232: 458–470
2001
[13]. Santi P. A. and Nietfeld J. Development of a mouse cochlea database ARO Session K4 Inner Ear Anatomy 2 Abst 376 2002
[14]. Segars W. P., Tsui B. M. W., Frey E. C. et al. Development of a 4D digital mouse phantom for molecular imaging research Mol Imag Biol 6(3): 149– 159 2004
[15]. Dogdas B., Stout D., Chatziioannou A. et al.Digimouse: a 3D whole body mouse atlas from CT and cryosection data Phys Med Biol 52(3): 577–587 2007
[17]. Wu L., Zhang G., Luo Q. et al. An image-based rat model for Monte Carlo organ dose calculations Med Phys 35(8): 3759–3764 2008
[18]. Amira, http://www.amiravis.com
[19]. Cook M. J. Anatomy of the Laboratory Mouse Academic Press 1965
[20]. Bab I., Hajbi-Yonissi C., Gabet Y. et al. Micro-tomographic atlas of the
mouse skeleton Springer 2007
[21]. Baiker M., Milles J., Dijkstra J. et al. Atlas-based whole-body segmentation
of mice from low-contrast micro-CT data Med Image Anal 14(6): 723–737
2010
[22]. Martini F. H., Timmons M. J., Tallitsch R. B. et al. Human Anatomy,
Pearson Education-Benjamin Cummings, Fifth Edition, ISBN-0-321-31204-X 2006
[23]. Li X., Yankeelov T. E., Peterson T. E. et al.Automatic nonrigid registration
of whole body CT mice images Med Phys 35(4): 1507–20 2008
[24]. Somayajula S., Joshi A. A. and Leahy, R. M. Mutual information based
non-rigid mouse registration using a scale-space approach Proc IEEE Intl Symp
on Biomedical Imaging 1147–1150 2008
[25]. Besl P. J. and McKay N. D. A method for registration of 3D shapes IEEE T Pattern Anal 14: 239–256 1992
[26]. Maintz J. B. A. and Viergever M. A. A survey of medical image registration
Med Image Anal 2: 1–36 1998
[27]. Zitova B. and Flusser J. Image registration methods: a survey Image Vision Comput 21: 977–1000 2003
[28]. Bookstein F. L. Principal warps - Thin-Plate Splines and the decomposition
of deformations IEEE T Pattern Anal 11: 567–585 1989
[29]. Dice L. Measures of the amount of ecologic association between species
Ecology 297–302 1945
[30]. Zijdenbos A. P., Dawant B. M. and Margolin R. A. Morphometric analysis of
white-matter lesions in MR-images - method and validation IEEE T Med
Imaging 13: 716–724 1994
[31]. Kaijzel E. L., van der Pluijm G. and Löwik C. W. G. M. Whole-body optical imaging in animal models to assess cancer development and progression
Clin Cancer Res. 13(12): 3490–3497 2007
[32]. Kaijzel E. L., Snoeks T. J. A., Buijs J. T. et al. Multimodal imaging and
treatment of bone metastasis Clin Exp Metastasis 26(4): 371–379 2007
[33]. Wildeman M. H., Baiker M., Reiber J. H. C. et al. 2D/3D registration of
micro-CT data to multi-view photographs based on a 3D distance map Proc
IEEE Intl Symp Biomed Imaging 987–990 2009
[34]. Kok P., Dijkstra J., Botha C. P. et al.Integrated visualization of multi-angle
bioluminescence imaging and micro CT Proc SPIE Medical Imaging 6509:
2
[35]. Khmelinskii A., Baiker M., Chen X. J. et al. Atlas-based organ & bone
approximation for ex-vivo µMRI mouse data: a pilot study IEEE Intl Symp
on Biomedical Imaging 1197–1200 2010
[36]. Zhou Y. Q., Davidson L., Henkelman R. M. et al. Ultrasound-guided left-ventricular catheterization: a novel method of whole mouse perfusion for
microimaging Lab Invest 84(3): 385–389 2004
[37]. Chaudhari A. J., Joshi A. A., Darvas F. et al. A method for atlas-based volumetric registration with surface constraints for optical
bioluminescence tomography in small animal imaging Proc SPIE Medical
Imaging 6510 Part 2: 651024 2007
[38]. Baiker M., Dijkstra J., Que I. et al. Organ approximation in μCT data with
low soft tissue contrast using an articulated whole-body atlas Proc IEEE
Intl Symp on Biomedical Imaging 1267–1270 2008
[39]. Joshi A. A., Chaudhari A. J., Shattuck D. W. et al. Posture Matching and Elastic Registration of a Mouse Atlas to Surface Topography Range Data
Proc IEEE Intl Symp on Biomedical Imaging 366–369 2009
[40]. Li X., Yankeelov T. E., Peterson T. E. et al. Constrained non-rigid registration for whole body image registration: method and validation
Proc SPIE Medical Imaging 6512: 651202-1–651202-8 2007
[41]. Landis J. R. and Koch G. G. The measurement of observer agreement for
categorical data Biometrics 33(1): 159–174 1977
[42]. Bartko J. J. Measurement and reliability: statistical thinking
considerations Schizophrenia Bulletin 17(3): 483–489 1991
[43]. Alexandrakis G., Rannou F. R. and Chatziioannou A. F. Tomographic bioluminescence imaging by use of a combined optical-PET (OPET) system:
a computer simulation feasibility study Phys Med Biol 50(17): 4225–4241
Chapter 3
Segmentation and visual analysis of
whole-body mouse skeleton µSPECT
Abstract
Whole-body SPECT small animal imaging is used to study cancer, and plays an important role in the development of new drugs. Comparing and exploring whole-body datasets can be a difficult and time-consuming task due to the inherent heterogeneity of the data (high volume/throughput, multi-modality, postural and positioning variability). The goal of this study was to provide a method to align and compare side-by-side multiple whole-body skeleton SPECT datasets in a common reference, thus eliminating acquisition variability that exists between the subjects in cross-sectional and multi-modal studies. Six whole-body SPECT/CT datasets of
BALB/c mice injected with bone targeting tracers 99mTc-methylene diphosphonate
(99mTc-MDP) and 99mTc-hydroxymethane diphosphonate (99mTc-HDP) were used to evaluate the proposed method. An articulated version of the MOBY whole-body mouse atlas was used as a common reference. Its individual bones were registered one-by-one to the skeleton extracted from the acquired SPECT data following an anatomical hierarchical tree. Sequential registration was used while constraining the local DoFs of each bone in accordance to the type of joint and its range of motion. The APR algorithm was applied to the segmented data for side-by-side change visualization and comparison of data. To quantitatively evaluate the proposed algorithm, bone segmentations of extracted skeletons from the correspondent CT datasets were used. Euclidean point to surface distances between each dataset and the MOBY atlas were calculated. The obtained results indicate that after registration, the mean Euclidean distance decreased from 11.5 ± 12.1 to 2.6 ± 2.1 voxels. The proposed approach yielded satisfactory segmentation results with minimal user intervention. It proved to be robust for "incomplete" data (large chunks of skeleton missing) and for an intuitive exploration and comparison of multi-modal SPECT/CT cross-sectional mouse data.
3.1
Introduction
Whole-body small animal imaging is widely used for the in vivo visualization of functional and anatomical information to study cancer, and for evaluation of drugs in pre-clinical research. An efficient combination of functional and structural information enables the visualization of cellular function and the follow-up of molecular processes in the living animals in their anatomical context. Functional information is provided by modalities such as PET, SPECT, MRI and Optical Imaging (OI), while anatomical information is usually obtained using CT and ultrasound.
3
the subject is positioned in different ways and postural variations occur (e.g., of the head, back and front limbs, etc.). One way to cope with this variability is to use multimodal animal holders between different scanners or use combined SPECT/CT, PET/CT, PET/MRI, or PET/SPECT/CT scanners that are becoming increasingly available. However, multimodal holders are not widely used or compatible and when they are, there are still significant differences in animal posture between different time points [3].
Various approaches were proposed to handle heterogeneous multi-modality data: Joshi et al. [4] proposed a method for fitting an elastically deformable mouse atlas to surface topographic range data acquired by an optical system; this method does not incorporate the extremities. Savinaud et al. [5] proposed a novel model-based approach to track animals in 3D from monocular video which allows the quantification of bioluminescence (BLI) signal on freely moving animals. Wildeman et al. [6] proposed a 2D/3D registration of μCT data to multiview photographs based on a 3D distance map combining optical/ BLI data with CT. Suh
et al. [7] published a serial registration method to serial μCT/SPECT mouse lower
extremities images.
In [2, 3], the authors suggested the use of articulated whole-body small animal atlases as a standard geometric reference to tackle the problem of segmenting and organizing heterogeneous whole-body multi-modality small animal data. Using the articulated whole-body MOBY atlas, Baiker et al. presented a fully-automated skeleton registration and organ approximation method in low-contrast μCT mouse data [1]. This method exploits the high contrast of bone to automate the registration process of the skeleton model and the subsequent organ approximation. However, performing an anatomical CT scan together with a functional one is not always desired in longer term follow-up studies, where prolonged radiation exposure may become a confounding factor in cancer research, or may cause adverse radiation effects [8].
The main technical contributions of this paper are twofold:
(i) we present a semi-automated atlas-based skeleton segmentation method for whole-body SPECT mouse data that requires minimal user input
(ii) using the Articulated Planar Reformation (APR) algorithm [12, 13], we provide the user with an intuitive side-by-side comparison and exploration platform for multi-modal (SPECT/CT), cross-sectional and follow-up data in a standardized layout, independent on the position of the animal during acquisition
3
3.2
Materials and methods
3.2.1 Method overview
The first step of the proposed approach is to extract the skeleton from the SPECT data. Subsequently, the articulated mouse atlas is registered to the data following a hierarchical anatomical tree: first, the atlas is coarsely registered to the entire skeleton. Then, starting with the skull, each atlas bone is accurately registered to the correspondent bone in the data using the Iterative Closest Point (ICP) approach [14]. After the atlas is registered to the data, we apply the APR algorithm [12, 13] to reformat the segmented data into segments corresponding to a mouse atlas and thus mapping the data to a standardized atlas space. The presented method is validated using 6 BALB/c mice, and the quantitative performance of the method is assessed calculating the Euclidian point to surface distance between the atlas and the correspondent μCT skeleton surface. The results are compared to the results present in the literature for low-contrast μCT whole-body mouse data [1]. For a visual overview of the proposed method see Figure 3.1.
3.2.2 Articulated MOBY atlas
A realistic 4D digital mouse phantom was generated by Segars et al. [15] based on high-resolution 3D MRI data of a C57BL/6, 15 week old mouse from Duke University. The skeleton in this atlas did not distinguish between single bones and joints. To allow the registration to perform independent of the data acquisition protocol and large postural variations due to postural heterogeneity between scans, we presented a segmentation of the skeleton into individual bones and added anatomically realistic kinematic constraints and DoFs to each joint in [1, 3, 16]. Using the Amira™ V3.1 software [17] and guided by anatomical text books [18, 19] the following bones/bone groups were labeled: scapulae, humeri (upper front limbs), ulnae/radii (lower front limbs), manus (front paws), femora (upper hind limbs), tibiae/fibulae (lower hind limbs), pedes (hind paws), caput (skull),
columna vertebralis (spine), costae (ribs), sternum (chest bone), and pelves. Each
joint position was identified and the corresponding DoFs and kinematic constraints were specified. Two types of joints were distinguished: ball joints and hinge joints. The resulting articulated version of the MOBY skeleton can be seen in Figure 3.2.
3.2.3 Whole-body SPECT/CT mouse data acquisition
In this study, we aim to demonstrate the robustness of the atlas-based segmentation with respect to the different whole-body SPECT scan settings and high posture variability that exists between those scans. Therefore, six male,
BALB/c mice were retrospectively collected from several different imaging studies
to represent that variability. One half was intravenously injected with 50 ± 6 MBq 99mTc-MDP, and the other one with 50 ± 6 MBq 99mTc-HDP. All mice were scanned 4 hours later using the Bioscan NanoSPECT/CT™ device (Washington DC, USA), equipped with four gamma cameras and pinhole apertures. With the combined scanner, the SPECT and CT were acquired one after the other without movement of the animal, so both imaging modalities are registered by hardware calibration. SPECT images were reconstructed using the ordered subset expectation maximization (OSEM) and CT images using the filtered back projection (FBP) algorithms. 99mTc-MDP and 99mTc-HDP are gamma-emitting radionuclide substances, where the metastable technetium (99mTc) is tagged onto a phosphonate compound (MDP, HDP) to generate 99mTc-MDP and 99mTc-HDP respectively, which selectively concentrate in the bone and are the primary imaging agents used to image changes in bone vascularity and osteoblastic activity [20]. Both tracers are used in translational research. For all mice, part of the tracer is cleared by the liver and as such, this organ is visible as well. Between these six datasets, the resolution of the scanner varies, ranging from SPECT voxel size of 0.60 x 0.60 x 0.60 mm3 to 0.20 x 0.20 x 0.20 mm3. The highest resolution CT dataset has a voxel size of 0.10 x 0.10 x 0.10 mm3 and the lowest 0.99 x 0.99 x 1.00 mm3 (see Table 3.1 for further detail). All procedures involving animals were approved by the Animal Experimental Committee (DEC) of the Erasmus MC and performed in agreement with The Netherlands Experiments on Animals Act (1977) and the European Convention for Protection of Vertebrate Animals Used for Experimental Purposes (Strasbourg, 18 March 1986).
SPECT CT
Resolution (voxel size in mm3)
Mouse 1 0.60 x 0.60 x 0.60 0.80 x 0.80 x 0.80 Mouse 2 0.30 x 0.30 x 0.30 0.99 x 0.99 x 1.00 Mouse 3 0.30 x 0.30 x 0.30 0.20 x 0.20 x 0.20 Mouse 4 0.30 x 0.30 x 0.30 0.10 x 0.10 x 0.10 Mouse 5 0.20 x 0.20 x 0.20 0.20 x 0.20 x 0.20 Mouse 6 0.20 x 0.20 x 0.20 0.10 x 0.10 x 0.10
Table 3.1 Resolution of each SPECT and correspondent CT dataset
The SPECT datasets were used for testing the proposed approach, and the correspondent µCT datasets to quantitatively validate the performance of the method.
3.2.4 SPECT/CT data pre-processing
3
the extraction of the best possible skeleton requires minimal user input to adjust the threshold and morphological operators parameter settings (more specifically in the extraction of the spine centerline step, see section below). This results in a coarse estimation of the major accumulations of the radioactive tracer: bladder, kidneys, part of the liver and the skeleton. In Figure 3.3, one can see that due to the differences in nature between the SPECT and CT data, the resultant skeleton in the case of the SPECT data is incomplete, with several parts missing (especially the front limbs, hind limbs and the skull, which is incomplete with large holes). For the CT datasets on the other hand a simple threshold returns the full, complete skeleton (Figure 3.3).
3.2.5 Articulated atlas-based SPECT skeleton data segmentation
In this step the articulated MOBY atlas is fitted to the skeleton extracted from the SPECT data. For this purpose a modified version of the fully automated approach presented in [1] was used. To deal with the large articulations between bones and/or bone groups, the registration of the atlas is employed following a hierarchical model tree (see Figure 3.4). It is initialized with a coarse alignment of the atlas and the entire target SPECT skeleton, where a similarity transformation model is applied to accommodate for the animal pose in the scanner and for size differences between animals (7 DoFs are taken into account: three for translation, three for rotation and one for isotropic scaling). After the coarse alignment of the entire skeleton, the individual bones are registered stepwise using the ICP algorithm [14], which is a method for point-based registration (skeleton surfaces in this case). We start at the skull, then, if necessary, the user locates the spine location where the vertebra connects the spine to the pelvis, the spinal centerline is extracted using three dimensional region growing until the pelvis is reached and registered and finally proceed to the back limbs, sternum and front limbs separately. The transformation models for the individual bones are dependent on the joint type (ball or hinge) and for each type a realistic motion model was defined ensuring that the bones remain in anatomically realistic shapes. See [1] for more details.
![Table 2.1 Joint types in the atlas skeleton and the correspondent DoFs [21], pictograms from [22]](https://thumb-us.123doks.com/thumbv2/123dok_us/8271217.2190764/27.892.305.587.707.912/table-joint-types-atlas-skeleton-correspondent-dofs-pictograms.webp)