Abstract— In the last years, the traffic accidents study is become important because they produce several died and hurt around the world. Drowsiness is a safety hazard in commercial vehicle driving. The conditions to which drivers are exposed put them at higher risk. Driver drowsiness detection technologies have the ability to avoid a catastrophic accident by warning the driver of his/her drowsiness. To help in reducing this fatality, in this paper, a new Algorithm for automatic driver’s drowsiness detection based on EEG using Mahalanobis Distance is proposed. This uses physiological data of drivers to measure or detect drowsiness. These include the measurement of brain wave or EEG and approaches based on EEG signals have the advantages in making accurate and quantitative assessment of alertness levels. Hence under the assumption that the EEG power spectrum in an alert state can be reasonably modeled using a multivariate normal distribution, Detection of the drowsiness present in the signal with known awake signal is the subject of this paper.
Index Terms—BMI-Brain Machine Interface, EEG-Electro
Encephalograph, MD - Mahalanobis Distance.
I. INTRODUCTION
Electroencephalograph (EEG) is the spontaneous activity along the scalp. EEG signals are measured by placing several electrodes on the head around the brain. Between certain electrodes, a potential difference is measured and converted into a waveform (EEG signal). Driving support systems to assist drivers play a central role in ITS (lnte1ligent Transportation Systems). Examples of such systems include forward / side obstacle detection systems to detect vehicles driving in front of, or in front of
Manuscript received July 15, 2012.
Pranjali Deshmukh, Pursuing M.E. from Dept of E&TC, MIT COE
Pune (India),
Prof. S.B. Somani, is associated with E & TC Department
MIT COE Pune, University of Pune, India,
Shivangi Mishra, Pursuing M.E. from Dept of E&TC, MIT COE
Pune (India),
Daman Soni , Pursuing M.E. from Dept of E&TC, MIT COE
Pune (India), email:
and to the side of, the vehicle equipped with the system; distance detection systems for vehicles ahead; and lane departure prevention support systems .BMI systems give warning information or other information in the event of an emergency. But the current systems are not always driver-friendly because they give warnings independently of the state of the driver. To realize driving support systems that are friendly to drivers, it is essential to give information that depends on the seriousness or urgency level of the information after the driver's slate has been detected. Examples of driver states to be detected include consciousness degradation through drowsiness, inattentive driving and physical or mental fatigue. There are number of methods to detect drowsiness. They can be categorized into two main approaches [3].
The first approach focuses on physical changes during fatigue, such as the inclination of the driver’s head, sagging
posture, and decline in gripping force on the steering wheel. Since these techniques allow noncontact detection of drowsiness, they do not give the driver any discomfort. However, these parameters easily vary in different vehicle types and driving conditions [3] [4] [5].
The second approach focuses on measuring physiological changes of drivers, such as eye activity measures, heart beat rate, skin electric potential, and electroencephalographic (EEG) activities. These parameters are sensitive to fatigue effects [4] [6]
Hence Drowsiness detection algorithm for EEG-based brain–machine interface (BMI) system is proposed as EEG-based method can use a shorter moving-averaged window to track second-to-second fluctuations in the subject performance.
EEG BASED DROWSINESS ESTIMATION
USING MAHALANOBIS DISTANCE
Volume 1, Issue 6, August 2012
II. METHODOLOGY
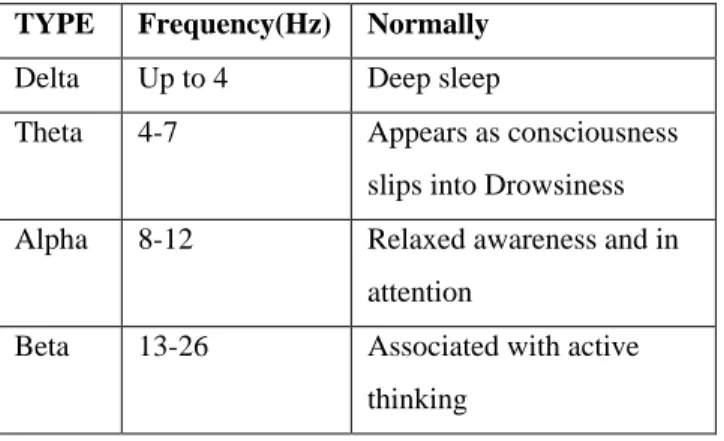
EEG is described in terms of rhythmic activity, which is divided into bands of frequency.
TYPE Frequency(Hz) Normally
Delta Up to 4 Deep sleep
Theta 4-7 Appears as consciousness
slips into Drowsiness
Alpha 8-12 Relaxed awareness and in attention
Beta 13-26 Associated with active
thinking Table 1: EEG Rhythms
As EEG spectra in theta rhythm (4–7 Hz) and alpha rhythm (8–11 Hz) usually shows the changes the cognitive state and memory performance, these rhythms are used to derive the drivers’ alert models and detect their cognitive
state from EEG spectra in theta and alpha rhythms [8]. Under the assumption that the driver will be in an alert state during the first few minutes of driving, the driver’s alert
state can be derived by the first few minutes of EEG recording. If the driver is under an alert state, his EEG spectra in theta and alpha rhythm will follow a multivariate normal distribution. Then the deviation of the driver’s
current state will be assessed continuously from the alert model by using Mahalanobis distance (MD). If the driver remains alert, his EEG spectra in theta and alpha rhythm will match the alert model. Otherwise, if the driver becomes drowsy, then his EEG spectra will deviate from the alert model, and hence, MD will increase.
A. EEG data acquisition
The implementation process is carried out using the database available in the physonet website. The available database was in EDF format, for compatibility it is converted in to ascii format for the MATLAB 7.9.The raw signal is then segemented according to the Rechtschaen and Kales [1968] sleep stage classification standard [9]. The segmented Awake stage and stage I signal is filtered using 3rd order Savitzky-Golay Filter. Savitzky-Golay filtering can be
thought of as a generalized moving average. Savitzky-Golay smoothing filters are typically used to "smooth out" a noisy signal. This filter is also called a digital smoothing polynomial filter or a least-squares smoothing filter. The Savitzky-Golay filtering method is often used with frequency data or with spectroscopic (peak) data.
B. Mahalanobis Distance
Mahalanobis distance of a multivariate vector
from a group of values with
mean and covariance matrix
S is defined as:
The Mahalanobis transformation is a powerful tool for studying the multivariate normal distribution as it often allows :
* To transform a given multinormal distribution into the simple standard (spherical) multinormal distribution. * To solve the problem at hand on this very simple distribution.
* Then to carry this solution back to the original distribution using the "reverse" Mahalanobis transformation.
For example, it can be used :
* For calculating the marginal distributions of the multinormal distribution.
* For studying the distributions and conditions of independence of quadratic forms in multivariate normal variables.
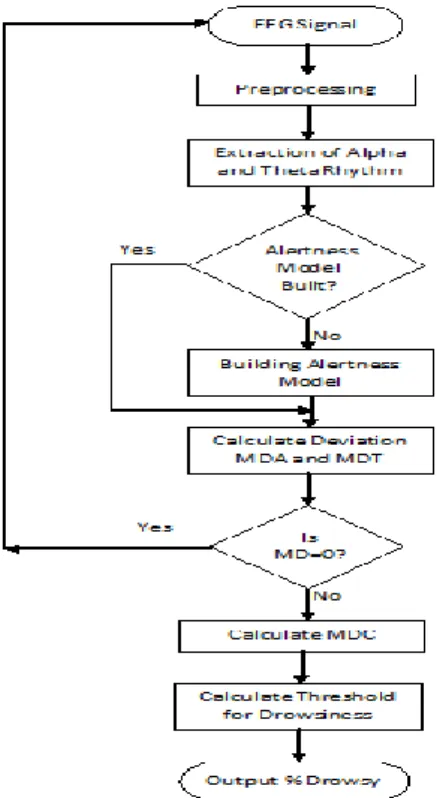
C.Work flow
Fig. 1- Flowchart of the drowsiness detection algorithm
First, a low-pass filter (moving average filter) with a cutoff frequency of 32Hz is used to remove power-line noise and other high-frequency noise. Next, EEG data will be down sampled to a sampling rate of 64 Hz to reduce the computation load. Finally, EEG spectra in alpha rhythm and theta rhythm are extracted [8] [1] .
Alpha Rhythm is associated with relaxed awareness and in attention state of mind and Theta rhythm is associated with consciousness slips into Drowsiness state of mind. Hence Alpha and Theta rhythms are only extracted from EEG spectra. Moreover Wakefulness EEG contains low voltage, mixed frequency activity whereas Drowsy EEG marks the transition from wakefulness to drowsiness. Drowsy EEG is defined by a relatively low voltage, mixed frequency activity -with a prominence of alpha and theta band shown in Fig.2 [1].
Fig. 2- Wakefulness and Drowsy EEG spectra A new alert model for every subject in every driving session will be constructed under the assumption that the driver should be in an alert state during the first few minutes of driving. First 3-min EEG spectral data are used to derive
the alert model. The alert model can be represented and characterized by a multivariate normal distribution N (µ, Σ2), where µ is the mean vector and Σ is the covariance matrix.
After the alert model is built, the preprocessed EEG spectra in alpha and theta rhythms will be directly calculated to obtain the Mahalanobis distance for alpha rhythm (MDA) and for theta rhythm (MDT), respectively. Then, a linear combination MDC of MDT and MDA is used to compute a combined measure of deviation. MDA, MDT, and MDC can be taken as an indicator of drowsiness.
Finally, the threshold of Mahalanobis distance for drowsiness can be defined. If the value of MDC is larger than the threshold, the cognitive state of the driver can be viewed as drowsy state. In order to classify alert and drowsy states effectively, F-measure is used to find out the threshold of MD for drowsiness.
The F-measure is the harmonic mean of precision and recall, and its value F can be calculated as follows:
F= 2 × (Precision ×recall ) (Precision+ recall)
Where Precision means positive predictive value (PPV) and recall means sensitivity which is related to percentage of Drowsy people identified as having drowsy condition [2].
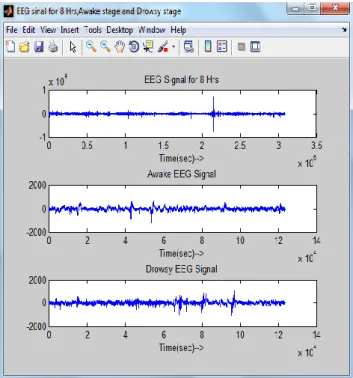
III. RESULT
There are many algorithms available for Drowsiness Detection. But as EEG-based method can use a shorter moving-averaged window to track second-to-second fluctuations in the subject performance, a new algorithm for drowsiness detection using EEG signal is proposed. This algorithm can be implemented by using uClinux system kernel or by using MATLAB software. But by using MATLAB we can write a separate code for each step of algorithm independently. Hence to provide better flexibility and performance MATLAB is preferred.
Volume 1, Issue 6, August 2012
Fig 3:- Total sleep signal,awake EEG signal, Drowsy EEG signal
After gating Awake and Drowsy stage signal, Noise is removed using bandstop and Golay filters. Then by using DWT Alpha, Theta rhythms are extracted from processed signal as below.
Fig 4:- Alpha and Theta signal for awake EEG signal
Fig 5:- Alpha and Theta signal for drowsy EEG signal
After alpha, theta extraction Mardia’s test of multivariate normal distribution is applied to EEG signal to check its validity to act as alertness model. Then MD for Alpha, MD for Theta and Hence MDtotal is calculated for different values of constant as in the formula of MDC.Once MDC is calculated the threshold for each value of MDC at each constant value is calculated [1]. F- measure will give the value of percentage of drowsiness. Percentage of drowsiness against the constant value is plotted as below.
0 50 100 150 200 250 300
0.1 0.2 0.3 0.4 0.5 0.6 0.7 0.8 0.9 1
Drowsiness Percentage for Subject 1 MDA=0.1129 and MDT=0.1535 Drowsiness percentage for Subject 2 MDA=0.2260 and MDT=0.1858 Drowsiness percentage for Subject 2 MDA=0.2026 and MDT=0.1368
Constant
%
Dr
o
w
si
n
e
ss
IV. CONCLUSION
EEG based Drowsiness Detection Algorithm is best suited for detecting Drowsiness due to high computation speed and portability. It can be easily used into real time applications as long term monitoring is possible. Hence it can be easily used for car driving application.
V. REFERENCES
[1] Shivangi R.Mishra, Prof. S. B. Somani, Pranjali Deshmukh, Daman Soni, ―EEG Signal Processing and
Classification of Sensorimoter rhythm-based BCI‖, International Journal of Engineering Research & Technology (IJERT), Vol. 1 Issue 4, June – 2012. [2] Chin – Teng Lin and Che-Jui Chang,‖A Real Time
Wireless Brain Computer Interface System for Drowsiness Detection‖, IEEE Transaction on Biomedical Circuits and Systems,Vol.4, No.4,August 2010.
[3] M. J. Flores, J.M. Armingol and A. Escalera, ― Real Time Drowsiness Detection System for an intelligent vehicle‖, in Proc. IEEE Intelligent Vehicles
Symp.,pp.637-642,2008
[4] A. Eskandarian and A. Mortazavi, ―Evaluation of a smart algorithm for commercial vehicle driver drowsiness detection‖, in Proc. IEEE Intelligent
Vehicles Symp.,pp.553-559,2007.
[5] T. Hong and H. Qin, ―Drowsiness detection in embedded system‖, in Proc. IEEE Int. Conf. Vehicular
Electronics and Safety, pp 1-5,2007.
[6] J. Qiang, Z. Zhiwei, and P. Lan, ―Real-time nonintrusive monitoring and prediction of driver fatigue,‖ IEEE
Trans. Vehic. Technol., vol. 53, no. 4, pp. 1052–1068, Jul. 2004.
[7] Desney S. Tan and Anton Nijholt, ―Brain Computer Interfaces Applying our Minds to Human Computer Interaction Human Computer Interaction Series‖.
[8] Saeid Sanei and J.A.Chambers, ―EEG Signal Processing‖.
[9] A. Rechtschaffen and A. Kales, A manual of standardized terminology, techniques and scoring system for sleep of human subjects, U.S. Public health