HYPERION
INTERNATIONAL
JOURNAL
Hyperion International Journal of Econophysics & New Economy
Volume 2, Issue 1, 2009
ECONOPHYSICS Section
Ion Spânulescu, Victor Stoica and Ion Popescu, An econophysics model for the
currency exchange with commission ... 7
S. S. Mishra, Information and computation systems in supply chain networking of merchandise- materials with economic interpretations... 23
Vesna D. Jablanovic, A chaotic population GROWTH model and disability ... 31
Gheorghe Săvoiu, Some typical econophysics’ and sociophysics’ models ... 39
NEW ECONOMY Section Elena Pelinescu and Petre Caraiani, The financial crisis and the transmission mechanism in Romania... 57
Felicia Adriana Lupu and Adrian Gelu Lupu, Methods and models for evaluation the efficiency of investments in distribution for food proproducts companies.. 67
Ana Maria Grigore, Spiritual values – the path to moral capitalism... 79
Calcedonia Enache, Romania ... on its way to euro ... 89
Wolfgang Ecker-Lala, Applications in business intelligence... 103
AN ECONOPHYSICS MODEL
FOR THE CURRENCY EXCHANGE
WITH COMMISSION
Ion SPÂNULESCU∗, Victor A. STOICA* and Ion POPESCU∗∗
Abstract. In this paper an econophysics model for the currency exchange
operations with commission is proposed. With this purpose some analogies and similarities of the processes that take place in the frame of the electro-chemical system made from electrodes sunk into a solution of electrolytes and the process of the currency exchange and determination of the interna-tional currency purchasing power have been used. Some contact phenomena at the electrode/electrolyte separation surface, the physical principles of an electrochemical source operation and the determination of the sale attractiveness or the “potential” of the currency that is to be exchanged are also introduced and analyzed.
Keywords: econophysics, electrochemical sources, contact phenomena,
elec-trode potential, currency exchange with commission, official currency parity.
1. Introduction
In last decade the methods of econophysics – a science recently
appeared between the 20th and 21st centuries – have been largely applied in
order to model different economic processes, especially from the financial area [1-10], the investments [11-14], or the social phenomena [11-15].
In this work an econophysic model for the illustration of currency exhange and the settlement of the international currencies purchasing power, on the basis of the analogy between the physical processes that takes place in the electrochemical systems and currency exchange operations with commission is proposed.
In order to substantiate and for the illustration of that analogy, in the section 2 there are made some physical considerations upon the electrochemical processes that take place at the contact between different metals, assimilated with the international currencies: Dollars, Euro, Japa-nese Yen, Pounds etc., and watery solutions with electrolytes assimilated
with economic environment in which different exchange currencies with commissions are practiced.
In the frame of this new econophysics model, the currency exchange is assimilated with the ionic exchangeable process between a watery solution with metallic electrodes which is in contact with, so that the potential of the electrode from the electrode – electrolyte contact represents the sale attractiveness or the economic power of the purchasing currency, from the economic point of view.
In sections 3 and 4, on econophysics model for the currency exchange and for the international currency purchasing power, and the influence of the physical and economic factors upon the currency exchange parameters are introduced and analyzed.
Finally in section 5, the main conclusions are summarized.
2. Contact phenomena. Physical processes in electrochemical
systems made of electrodes and electrolytes solutions
2.1. Contact phenomena
Contact phenomena appear both between two solid bodies, which are two different conductors (or semiconductors), and to the contact between a metal (or semiconductor) and a watery solution in which certain substances (salts or acids), named electrolytes, have been put in. To the contact between two different substances appears a contact difference potential as the result of the difference between the work function of the electrons from metals (or semiconductors) of a different type brought into an intimate contact.
c
V
As it will be shown afterwards, such a potential “leap” appears also to the contact between a metal (or semiconductor) characterized by the work
function Wm and a solution with electrolytes with the work function Wl
(Fig. 1,b). In this case the leap (the potential difference) is named as elec-trode potential. In the present work the elecelec-trode potential from an electro-chemical system – assimilated with a circuit of a currency exchange – is assimilated with the “potential” of the exchangeable currency, or with the
sale attractiveness of that currency.
Electrolytes solutions (that contain electrolytes) are part of the
category of so-called conductors of 2nd type at which the running electrical
In the case of electrochemical piles (Volta cell, the Daniell’s cell etc.) or the phenomena of electrolysis, galvanization etc., there are usually used pairs of solid conductor electrodes, partially sunk in acid or alkaline solutions, and between the two electrodes there appears a potential difference given by the difference between the electrode potentials of the two electrodes [16].
2.2. The metal-electrolyte contact. The electrode potential
(the “potential” of currency or its sale attractiveness)
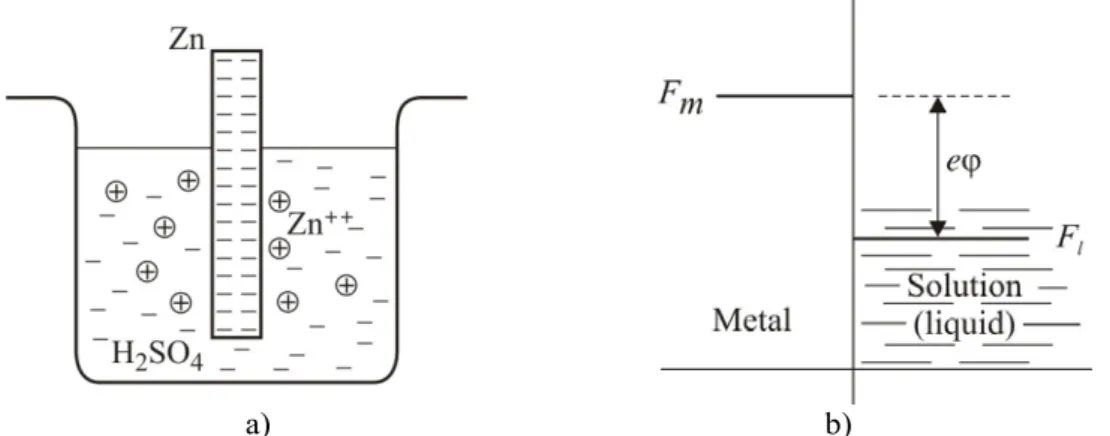
In our considerations, a foreign currency, that is under interaction with the financial economic environment, is assimilated with a metallic or semiconductor electrode placed in a system with electrolytes (watery solution) that represents the “economic environment” (Fig. 1,a).
As it has been mentioned, the difference of the contact potentials (currency sale attractiveness) and, respectively, of the potential difference (of the difference regarding the attractiveness of the exchanged currency) does not appear only at the contact between two solid bodies (it does not appear merely at the contact of two currencies), but also at the contact between a solid (a currency) and a liquid (an economic environment), between which certain chemical processes assimilated with processes of transformation or currencies exchange there are in progress (Fig. 1,b). For instance, if a zinc plate (assimilated with a hard currency: the dollar) sink in
a watery solution of sulfuric acid (H2SO4) (that means that the currency is
transformed in an investment, I, therefore, in an economic variable, (product
or service etc.) and under the action of the acid solution zinc starts being corroded and dissolved in the electrolyte (Fig. 1,a), therefore, the currency starts being consumed and transformed in fix funds (see also Fig. 3).
a) b)
In the case of the figure 1, from physically point of view, under the action of the acid solution, the zinc starts being corroded and dissolved in the solution with electrolyte (Fig. 1,a). In that solution do not pass neutral
atoms of Zn, but ions Zn++ only; therefore the solution shall be positively
charged and the zinc electrode shall remain negatively charged. Thus, between the electrode of Zn and the solution there appears a difference of
potential ε of which value is determined by the value of the “work
functions”:
ϕ =e
W (1)
that represents the difference between the chemical potential (the Fermi
level, Fm) of the ions from the metallic network (of the Zinc) and chemical
potential Fl of the ions from the solution (Fig. 1,b):
.
l m F
F
eϕ= − (2)
The sign of the electrode potential depends on the nature of the elec-trolytic solution and electrodes which can have a chemical attractiveness
higher or lower than the electrolytic solution, if the Fermi level, Fl (of the
solution) is higher or lower than the level Fm (of the metal).
In the case of the zinc, in normal temperature and pressure conditions,
for solutions of H2SO4 normally diluting, this potential is equal with
–0,50V. For other metals, the values of this potential differ from metal to metal, being able to take also positive values in accordance with the type of the metal, electronegative or electropositive, in relation to the electrolyte solution. For instance, for a Cu electrode in a sulfuric acid solution the electrode potential is equal with + 0,61V [16].
The electrode potential can be measured only in comparison with the potential of another (metallic electrode) one that is necessarily to be sunk into solution in order to have a closed electrical circuit. This is achieved using an electrochemical chain known as an electrical pile (power source), formed from the electrode of which potential must me measured and a comparison electrode. As comparison electrode has been selected, the normal hydrogen electrode for which, conventionally, a zero value for its normal potential is taken. Thus, the electrode potentials determined in report with the normal electrode of hydrogen represent
relative values, and they are displayed under this form in different tables
Table 1
The standard normal potentials for different electrodes in report with the standard potential of the hydrogen electrode (Source: [16])
Li/ Li+ –3,04 mV
K/ K+ –2,92 mV
Ca/ Ca2+ –2,87 mV
Na/ Na+ –2,71 mV
Mg/ Mg2+ –2,37 mV
Mn/ Mn2+ –1,18 mV
2H2O/ H2+ 2OH– –0,83 mV
Zn/ Zn2+ –0,76 mV
Cr/ Cr3+ –0,74 mV
Fe/ Fe2+ –0,56 mV
Fe/ Fe3+ –0,44 mV
Cd/ Cd2+ –0,40 mV
Ti/ Ti2+ –0,34 mV
Co/ Co2+ –0,28 mV
Ni/ Ni2+ –0,23 mV
Sn/Sn2+ –0,14 mV
Pb/ Pb2+ –0,13 mV
H2/ 2H+ ±0,00 mV
Cu/Cu+ +0,34 mV
2Hg/ Hg22+ +0,79 mV
Ag/ Ag+ +0,80 mV
Hg/ Hg2+ +0,85 mV
Pt/ Pt2+ +1,20 mV
Cl2/ 2Cl– +1,36 mV
Au/ Au+ +1,50 mV
F2/ 2F– +2,87 mV
In the case of a chemical source largely used as there is the Volta cell or the Daniell’s cell (Fig. 2,a) the two metallic electrodes are used, namely an electrode of Zn – which represents the anode, or the positive electrode – and a Cu electrode, which represents the cathode, whereto the positive ions from solution come.
The two electrodes are sunk into a watery solution of H2SO4 (the
electrolyte), forming the electrochemical chain (Fig. 2,b):
Zn H2SO4 (aqua) Cu (3)
in which the straight bars from (3) represent the separation surfaces of the two phases: solid and liquid.
The electromotive force which is generated by the pile in open circuits is given by [16]:
e =ε+ −ε− (4)
in which ε+ and ε– represent the potential leap (contact potentials) from
two electrodes, the positive one, of Cu, and the negative one, of Zn (Fig. 2,a) calculated in report with the standard potential (of the hydrogen electrode).
Taking into account the measured values for the electrode poten- tials of Cu and Zn (Fig. 2,c), the following value is given for the Volta battery voltage [16]:
a) b)
c)
Figure 2. a) The electrochemical system with two metallic electrodes; b) The
electrochemical chain representation; c) The scheme of an electrochemical pile.
3. The currency exchange operations modelling using
the physical processes from an electrochemical system
The currency exchange is the financial operation through which a currency is exchanged with another one at an exchange office or at banks, for a commission accepted by both partners: the beneficiary, respectively, the clerk of the bank or of the exchange office. The exchange takes place starting from the official parity rate of currency established by the National Central Bank.
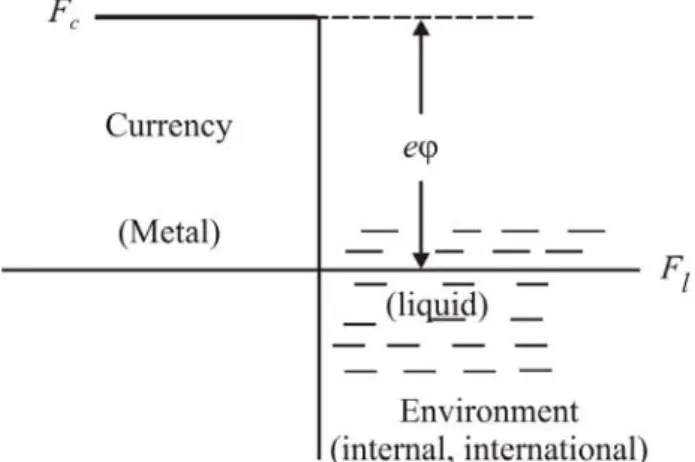
differrence (the sale attractiveness of the currency) and, respectively, the potential difference (the difference between the attractiveness of the currency that is to be exchanged into another currency) do not appear only in case of a contact between two solid bodies (that means between two different currency) but also at a contact between a solid one (international, national currency) and an electrolyte solution one (an economic envi-ronment), in the frame of which certain chemical processes, or trans-formation, are recorded. As it has already been mentioned in the previous section, if a Zn plate (equivalent with a dollars amount) is sunk into a
solution of sulfuric acid (H2SO4) (that is in an economic environment),
then that is transformed in an investment, I, that is an economic value
(quantity), and under the action of the acid solution (through the scroll of the investment process), the zinc (the amount of dollars) starts being corroded and dissolved in electrolyte (Fig. 1,a). Due to the fact that it has been corroded, the Zn electrode is consumed, so that the dollar amount being transformed in fix funds of which value is determined by the height
of the potential barrier, eϕ=Fm−Fl, that represents the investment
efficiency as a result of currency (dollars) utilization in the economic process (Fig. 3 and Fig. 1,b).
Figure 3. The evolution of the currency exchange operation.
As it has already been mentioned, the neutral Zn atoms (certain subdivisions of a currency) do not pass into solution, but only the positive
ions Zn++ pass (that means discrete subdivisions of dollar, so, cents) and
(the economic environment) appears a potential difference (a difference between the investment profitableness and the interest rate – that is profit,
p), respectively an electric field Er (investor-bank relations) orientated
from liquid (investment) toward electrode (the dollar borrowed amount reconstitution and interest one) [16].
The “contact” electric field (investor-bank relations) shall stop further crossing of the metal ions (cents) in the economic environment (the investment being closed). Thus, a dynamic equilibrium is achieved, when for a certain potential difference ε (the difference between the
investment profitableness and the interest rate – that is the profit, p), so
that, for a certain value of the “field” (the loan to be repaid and the left interest mass), the number of metal ions (cents) that pass into solution (into the economic environment) becomes equal with the ones that turn back to metal (loan repaying plus interests) and the dissolving is stopped (the loan plus the interest are paid). The value of this potential, named electro-chemical potential or electrode potential (assimilated with the international currency purchasing power, that means with its sale attractiveness) depends on the nature and properties of the metal (currency), of the solution (the economic environment which generates it) and of the initial concentration of the metal ions (the external debt of the currency issuing country) in solutions (the currency weight in the national economic Gross Domestic Product – GDP).
In the case of the zinc, in normal temperature and pressure conditions
(in conditions of prices normal stability), for solutions of H2SO4 normally
diluting (that means for normally developed economic environments), this potential (international currency purchasing power)is equal with –0,50V for the Zn electrode (see §.2.2 and (5) relation) and (conventionally) equal with 5% on a scale from 0% to 10%, for example, for the international currency purchasing power.
For other metals (currencies), the values of this potential (internatio-nal currency purchasing power) differ from metal (currency) to metal (currency), being able to take also positive values in accordance with the type of the metal (that certain currency), electronegative (when the curren-cy of a country is not in demand) or electropositive (when the currencurren-cy of a country is highly in demand), in relation to the electrolyte solution (international economy).
with + 0,61V, from the physical point of view (see §.2.2), but in the case of the currency exchange the international purchasing power is given by the
currency parity modification between moments t0 and t1, and between the
currency values v1 and v2, that means that the currency has a relative value,
reported to the comparison currency.
The difference between of the two potential electrodes (the difference between the purchasing powers of two currencies) from the interface of the two phases metal/ solution (currencies / international commerce), appears due to the fact that the chemical potential (the Fermi level) (that means the variation of the international prices) of the ions from the metallic network (of the currencies monetary subdivisions) differs from the chemical
potential of the ions in the solution, through the size eφ (Fig. 1,b and
Fig. 3). The ions (the subdivisions of the currency) from environment (intern or international) with a higher chemical potential (with the index of the higher prices) pass into the environment (intern or international) with a lower chemical potential (with the index of the lower prices).
In the case of figure 1,b, for the zinc electrode (dollar currency in the figure 2,b), the metal ions pass into the solution (the cents that pass into the internal market) and the metal (dollar) is negatively charged (it increases its purchasing power) in report with the solution (in report with the international or internal markets).
If pairs of metals-solutions are chosen (currencies – internal markets, pairs) so that the ions from the solution (the subdivisions of the currencies on the internal markets) are at the level of the higher chemical potential (it is on the markets with higher prices index), they shall leave the solution (internal markets) and deposit on the metal (that is the currency mass on the external markets is growing) and that is why the metal shall positively charged itself (the total currency mass grows) in report with the solution (on the international market). The metals (the currencies) with low chemical activity are part of this group (from the internal markets with low growths of the prices indexes) as there the metals with physical equivalent Au, Ag, Pt, Cu, Pa, Hg etc. or with the currencies: euro, pounds, dollar, Japanese yen, Australian dollar, rouble etc. [16]. Thus the sign of the electrode potential (the appreciation/ the depreciation of the currency) is caused of ions tendency whether to leave the metal or on the contrary, to pass from the solution on the metal, is determined by the tendency of the prices to depreciate the currency or to appreciate it [16].
purchasing power) is the consequence of a transfer reaction of the ions from the inner part of a phase into another one (that means that the purchasing power is the consequence of an index difference of the internal prices reported on the international market prices ones); On the other hand, as it has been shown, because the galvanic potential ε of a singular electrode cannot be measured, also the international purchasing power of a single currency cannot be measured. As the electrode potential may be determined making an ensemble as an electric pile from the electrode of which potential must be found, and a comparison electrode (Fig. 2,a,b,c); it
is the same situation for the international currency purchasing power that
can be determined making an ensemble of two currencies, one of which
international purchasing power must be found, out and one of comparison. As electrode of comparison (comparison currency) it has been convened that the normal hydrogen electrode (up to the present, the dollar currency), which the 0 value was given to (the value of 5 for dollar, in the convention made by us for currencies), as its normal potential (for its normal international currency purchasing power).
As it has been shown, the normal potentials determined in report with the normal electrode of hydrogen are not absolutely potentials, but
relative values, E0, that are also displayed in different tables similarly to Table 1 for the electrode potentials of some physical electrodes. In the same way there is concluded that the values of the international purchasing powers of the currencies in report with the dollar, are not international purchasing powers of the singular absolute values, but relative values, being also shown in different financial tables (similar to Table 1).
4. The currency exchange modelling through electrolysis
process and galvanization with a power generator
(an equivalent of a currency source)
The act of currency exchange can be assimilated also with the process of electrolysis, in the case when currency resources supplying, taken from a generator (currency source) similar to the electrolysis process. The electrolysis represents an exchange process (exchange currency)
during which the electric power that is supplied by an external source G
(Fig. 4,a) is transformed in chemical power that brings contributions to the electrochemical reactions [16].
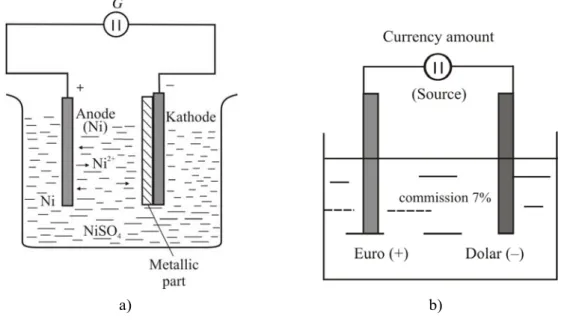
Central Bank). The ions (the flux of the currencies) must circulate free (in accordance with the request-offer report of curency), in the solution with electrolytes (the economic environment). The two electrodes (the curren-cies) must be tied through an electrolyte with salts (the commission) and a power generator (Central Banks, the issuing authority of the two currencies) assimilated with the stocks of euro and dollars (Fig. 4,b). In this case, the exchange currency operation results may be evaluated through the assimilation of this exchange with the exchange processes that takes place in a system in which the electrolysis takes place, that means in an electrolytic bath that may be with passive electrodes (for example Pt) for the electrolysis of water or of another solution, or with “soluble” anode used in the processes of mettalic covering (galvanization) like nickel coating or chromium plating etc.
In the case of nickel plating, in an electrolytic bath, Ni sulphate as electrolyte is used, the anode is a nikel plate, and to the cathode the metallic part (or piece) that must be nickel plated is attached (Fig. 4,a).
a) b)
Figure 4. Equivalent structures in the case of currency exchange modelling
as currency source (currency salvo).
Under the action of the electric power supplied by the power source
G, the Ni sulphate is dissociated in Ni2+ and SO , and the resulted ions
lead for the electrodes from the bath where the following chemical reactions are in process [16]:
−
2 4
To cathode:
Nickel is deposited (until the process ends); To anode:
Ni(plate) + SO = NiSO24− 4 + 2e–. (7)
Two electrons (2e–) are given in and the nickel sulphate NiSO
4 is recuperated and it passes in the solution of which concentration stays thus constant.
In the case of a currency exchange between two currencies (Euro and Dollar, for example) there may be noticed some considerations similar to the ones of galvanization (chromium and nickel plating etc.). Thus, if an electric power (a stock of currencies) is applied between two electrodes (the currencies of euro and dollars), the positive ions (eurocents) migrate to the cathode (the petitioner of euro), while the negative ions (the American cents) shift to the anode (the petitioner of dollars). The positive ions (eurocents) are named cations (euro) while the negative ions (the American cents) are named anions (dollars). The cations (euro) are able to capture electrons (a growth of the official quota), on the power of their valence (the official quota) similar with the relation (6) for the reaction from cathode where the metal deposit is achieved (Ni, in the case of the figure 4,a). The anions (the dollars) react oppositely (they depreciate); in case of contact (exchange) with the anode (euro) they shall give in their electrons (they suffer a diminution of the official quota) in order to take a steady position and become a stable element (a stable dollar) similar to the relation (7), for the reaction from the anode (Fig. 4). To the cathode (currency – that is the dollar) the cations (euro) are reduced (they diminish the exchanged quantity) and the anions (the dollars) oxidize (they depreciate). In accor-dance with the ions nature (eurocents or American cents), the resulted product (the exchange) can be released (the exchange takes place) or can be stored on the electrode (the exchange does not take place).
In conclusion, the galvanization of the metallic parts (the settlement of the official quota of the currencies units) settled against the corroding process (against monetary depreciation) is equivalent with the protection of an alterable metal (a volatile currency) against the corroding process (against depreciation) due to a deposit through the electrolysis (currency exchange) of an inalterable metal (a stable currency). The object (the currency) to be covered (to be stabilized) is connected on the negative pole of a generator (currency stock) and put in a electrolytic bath (Fig. 4), the electrochemical process (that means the currency exchange) carrying out the role of purification (“stabilizer”), as it is the case of galvanic “covering” of an electrode (or the part to be covered) (Fig. 4,a).
The determination of the official currency parity (O.C.P), taken by twos expresses how many unities from the Y currency may be bought with a unity from the Z currency. The calculation formula is the following (for X = euro, Y = RON and Z = dollar):
1 X€ = aYRON
1 X€ = bZ$
aYRON
OCPRON = --- = cYRON / 1Z$ (8)
bZ$
where: X, Y, Z are currencies, and a, b, c are the proportion of the
currencies.
In order to foresee the electrochemical reactions (the currencies quotations) the standard potential (the international currency purchasing power) is used. The standard potential for the currencies shall be determi-ned starting from the official currency parity, calculated by the formula (8). In the Table 1 there are displayed some examples of standard potentials of the chemical elements (equivalent with the international currency purchasing power starting from the currencies official quotations) at 25°C (in the area of monetary stability). Practically, the elements that form the electrodes (the currencies) are classified (quoted) in accordance with their
standard potential Eo (international currency purchasing power) like of the
for the currency exchange). The other elements (currencies) have a positive (higher) standard potential (a purchasing power) or a negative one (lower than euro).
In conclusion, the elements with negative standard potential (curren-cies with a purchasing power under euro) are more exposed to be oxidized
(to be depreciated) than the elements with a positive E0 (having a higher
purchasing power).
5. Conclusions
The currency exchange process with commission may be modeled on the basis of its analogy with the process of ionic exchange between a solution with electrolytes and metallic electrodes which are into contact with the solution within an electrochemical system of the type of power chemical source or electrolysis with metal deposit (galvanoplastics).
In the present work it is shown that the electrode potential Eo from the
electrode-electrolyte contact represents, from the economic point of view, the sale attractiveness of the currency (assimilated with the metallic electrode) – therefore with its international purchasing power.
Considering the currency euro as the reference electrode, a classi-fication of currencies can be achieved in accordance with the international currency purchasing power, similar to the classification of the electrode
potentials Eo of the chemical elements (metals) used as electrodes in the
electrochemical systems taken into report with the standard potential of the
hydrogen chosen as a reference element (with Eo = 0). As in the case of the
elements used as electrodes in electrochemistry, the currencies may have a positive potential (a higher purchasing power) or a negative one (with a
purchasing power lower) that a quntity of a Euro that can to be “oxidyzed”
or to suffer “reducing” reactions (that means it suffers depreciation), in
comparison with the currencies that have a positive potential Eo.
REFERENCES
[1] D. K. Faley, Statistical Equilibrium Theory of Markets. J. Econ. Theory, 62,
321-345 (1994).
[2] H. Levy, M. Levy, and S. Solomon, Microscopic Simulation of Financial Markets, Academic Press, San Diego (2000).
[4] Y. Liu et al., Statistical Properties of the Volatility of Price Fluctuation, Phys. Rev., E 60, 1390-1400 (1999).
[5] R. N. Mantegna and H. E. Stanley, An Introduction to Econophysics, Cambridge University Press, Cambridge (2000).
[6] R. N. Mantegna, Z. Palagyl and H. E. Stanley, Applications of Statistical Mecha-nics to Finance, Physica A 274, 216 (1999).
[7] D. Sornette, Why Stock Markets Crash – Critical Events in Complex Financial Systems, Princetown University Press, New Jersey (2003).
[8] A. A. Drăgulescu and V. M. Yakovenko, Statistical mechanics of money, Eur. Phys. J. B. 17, 723-729 (2000).
[9] I. Antoniou et al., Robust Methods for Stock Market Data Analysis. Physica A: Statistical Mechanics and its Application 336 (3-4), 538-548 (2004).
[10] V. M. Eguiluz and M. G. Zimmernann, Transmission of Information and Herd Behavior: An Application to Financial Markets, Phys. Rev. Lett., 85, 5659-5662
(2000).
[11] Anca Gheorghiu, I. Spânulescu, New Econophysics Approches and Models, The Hyperion Scientific Journal, 4, 73-91 (2004).
[12] I. Spânulescu, Anca Gheorghiu, Economic Amplifier – A New Econophysics Model, arXiv: 0707.3703 (2007).
[13] Anca Gheorghiu, I. Spânulescu, New Econophysics Approches and Models, (in Romanian), Victor Publishing House, Bucharest (2004).
[14] Anca Gheorghiu, Econophysics of Investments (in Romanian), Victor Publishing House, Bucharest (2007).
[15] Wang Yougui, WU Jinshan, DI. Zengru, Physics of Econophysics, in arXiv: cond-mat/ 0401025, v1, 4 Jan (2004).
INFORMATION AND COMPUTATION SYSTEMS
IN SUPPLY CHAIN NETWORKING
OF MERCHANDISE-MATERIALS WITH
ECONOMIC INTERPRETATIONS
S. S. MISHRA*
Abstract. Supply chain networking is a multi-objective oriented operations
strategy for achieving the organizational goals. Multiojectives include cost efficiency as a prime goal and organizational competitiveness, flexibility and responsiveness as other goals. But, for any quality conscious organization, cost efficiency and other variables are equally focused for an effective trade- off in between them. Information and computation systems are vehemently understood to very closely affect various operations of supply chain net-working of merchandise-materials right from manufacturing to distribution of such materials. In this paper, a fresh approach is made to develop a frame work and methodology of information and computation systems that in turn can augment and strengthen the effectiveness of supply chain networking in an economic manner.
The paper has been categorized in two sections. First section is devoted to the conceptual development and implementation of the information embedded supply chain networking in the business of merchandise-materials and second section is focused on the development of some of computation systems which can be used in the cost, revenue and profit analysis of supply chain networking. This research is presumably assumed to provide a better insight to professionals engaged in this field.
Keywords: supply chain networking, merchandise-materials, cost efficiency
SCN models.
1. Introduction
Presently, organizations are working hard for improving their organi-zational cost efficiency and competitiveness in a cut-throat competitive global market. Suppose that if market is electronically connected, what will
be competitive and responsive scenario in terms of their dynamism. Virtual organizations, outsourcing and electronic data interchange, enterprises resource planning, SAP, e-commerce, e-business and business-to-business procedural developments have revolutionized the marketing and business dynamics. All above activities involved in right from acquiring the raw materials, searching the suppliers, distributors, warehouses and distri-butions to satisfy the demands of consumers are closely associated with information system and networking of suppliers, warehouses and distri-butions of merchandise materials is designated as supply chain networking. Merchandise materials refer to man, machine and materials which can be bought and sold as per requirement of users in the markets. At the very outset, these materials are idle and at later stage, they are dynamic for reaching the market for the end users.
application. Armstrong and Hagel (1996) argue that there is beginning of an evolution in supply chain towards online business communities. For example, General Electric trading process network is an online business community that allows the company to transact about $1 billion dollar worth of business with their suppliers located all over the globe. Big three auto makers in the US are in the process of launching the automotive network exchange (ANX) to further understand the impending effects of electronic business communities. ANX will establish a standard method for parts suppliers to communicate with and obtain order information from the auto manufacturers (Graham and Hardaker, 2000). Supply chain networking emphasizes the overall and long-term benefit of all parties on the chain through co-operation and information sharing. This signifies the importance of application of IT in SCN. This is largely caused by variability of ordering (Yu et al., 2001). Information sharing between members of a supply chain using EDI technology should be increased to reduce uncertainty and enhance shipment performance of suppliers and greatly improve the performance of the supply chain system (Srinivasan et al., 1994). Companies need to invest large amount of money for redesigning internal organizational and technical processes, changing tradi-tional and fundamental product distribution channels and customer service procedure and training staff to achieve IT-enabled supply chain (SC) (Motwani et al., 2000). The following are some of the problems often cited in the literature both by the researchers and practitioners when developing an IT-integrated SC: lack of integration between IT and business model, lack of proper strategic planning, poor IT infrastructure, insufficient appli-cation of IT in virtual enterprise, and inadequate implementation knowledge of IT in SC. There is no comprehensive framework available on the application of IT for achieving an effective SC. Considering the importance of such a framework, an attempt has been made in this paper to develop this framework and suggestion to work IT as an powerful operating tools in supply chain networking. For maintaining the cost efficiency in particular and other efficiencies in general, we adopt the following key factors such as electronic data interchange, ecommerce and internet trading etc.
2. Economic Interpretations
effective supply networking to solve the problem of alignment between operations strategy and IT strategy. A strategic alignment model for a manufacturing information system that specifically addresses the requirements of leveraging the emerging developments in information technologies would be useful. We inculcate the new values of advance technologies within the sociology of technology, in which innovation is not simply a technical-rational process of solutions and it also involves economic, social and political processes in articulating interests, building alliances and struggling over outcomes. The market is the driving force for any changes in an organization and market factors such as customer requirements, competitors and price always force organizations the way they manage their operations. For example, companies select to for IT enabled SCN in order for companies to compete in a networked economy wherein we have to compete in a global market by multiple competitive performance objectives such as price, quality, flexibility, responsiveness and dependability. The economic reasons here is the cost reason. IT helps to improve the accurate information flow and in turn accurate decisions to support the business process in an effort to meet the changing market requirements.
3. Some SCN Models with Computation Systems
We discuss computational techniques and their modern economic interpretations of cost and profit analysis of certain Supply Chain Net-working Systems under following titles such as (Mishra and Yadav, 2008):
i. Model Introduction; ii. Computational approach;
iii. Applications with Economic Advantages.
Model I: Computational approach to profit optimization of a loss-Supply Chain Networking System
a) We have the following features of the model:
i. M/M/1/K of supply chain network with finite capacity K
ii. The inter arrival of merchandise-materials and supply rate
follows the exponential distribution;
iii. No reneging and balking;
iv. The arriving merchandise-materials go for their supply elsewhere
constitutes the case of loss of merchandise-materials in the supply chain system;
v. Total expected cost (TEC) of SCN;
vi. Total expected revenue (TER) of SCN;
vii. Total optimal profit (TOP) of SCN;
viii. Developing Computing algorithm;
ix. Fast converging N-R method;
x. Least computing time;
xi. Lesser memory space;
xii. Sensitivity analysis and its observations based on graphics have
added a significant value to this model.
b) Computing Algorithm
The following computing algorithm has been developed to compute the optimal service and total optimal expected profit of the system under consideration.
•
Step 1: begin;•
Step 2: input all variables;•
Step 3: compute all derived variables which are needed;•
Step 4: compute derivative of some required functions of derivedvariables;
•
Step 5: compute derivative of function of supply rate;•
Step 6: t ← initial guessed supply rate;•
Step 7: iterating initial guess of supply rate;•
Step 8: while (error = 0.0000000001);•
Step 9: compute optimal supply rate in nonlinear equation;•
Step 10: compute total optimal expected profit;•
Step 11: data output;•
Step 12: end.Model II: Cost and Profit Analysis of Markovian Supply Chain Networking System with Two Priority Classes: A Computational Approach
a) We have the following features fro this SCN:
i. A single server supply chain system with Poisson arrival and
exponential supply pattern; ii. First class has high priority;
iii. Second class has low priority for getting supply;
v. Two priority classes;
vi. A computing algorithm has been developed;
vii. Fast converging numerical method system of non linear
equations;
viii. The number of the first class MM are restricted to a finite num-
ber N ;
ix. λ1 and λ2 are the arrival rates for two classes; x. µ1 and µ2 be the supply rates for two classes;
xi. Traffic intensities are given as ρ1 =λ1/µ1 and ρ2 =λ2/µ2;
b) Total Cost Function:
We construct the following cost function to analyze the cost investment in the system,
T(C) = C1µ1 + C2 µ2 + ChLH + Cl LL
i. LH = expected lot size of high-priority class.
ii. LL = expected lot size of low-priority class.
iii. C1 = cost per supply per unit time associated with high-priority
class.
iv. C2 = cost per supply per unit time associated with low-priority
class.
v. Ch= holding cost per MM per unit time of high-priority class.
vi. Cl = holding cost per MM per unit time of low-priority class.
vii. µ1 = supply rate of high-priority class. viii. µ2 = supply rate of low-priority class.
c) Computing Algorithm:
The following computing algorithm has been developed to compute the optimal service rates and total optimal cost and profit of the system with two priority classes.
i. Step 1: begin
ii. Step 2: input all variables
iii. Step 3: compute derived variables
iv. Step 4: compute derivatives
v. Step 5: compute functions
vi. Step 6: t1← initial supply rate of HPC
vii. Step 7: t2← initial supply rate of LPC viii. Step 8: iterating initial supply rates
x. Step 10: compute optimal supply rates
xi. Step 11: compute total optimal cost
xii. Step 12: data output
xiii. Step 13: end.
4. Conclusion
As conclusions we found the following:
i. Cost analysis has a very important aspect of SCN;
ii. Realistic situations are sought;
iii. Profit along with cost analysis;
iv. For profit optimization is an important economic concept to deal
with any model of ecno-science and systems so that economic viability of the model can be maintained in the real life situations;
v. Minimize total cost and maximize profit;
vi. Concept of revenue along with cost;
vii. Useful in various fields of practical applications;
viii. Telecommunications and networking;
ix. Production and inventory management;
x. Marketing, market analysis and pricing etc.
REFERENCES
[1] Armstrong, A., Hagel III, J. (1996), The real value of online communities, Harvard Business Review (May/June), 134-140.
[2] Bradley, P. (1999), Managers look to supply chain to cut costs, Logistics Management and Distribution Report 38 (1), 21-22.
[3] Graham, G., Hardaker, G. (2000), Supply-chain management across the Internet, International Journal of Physical Distribution & Logistics Management 30 (3/4),
286-295.
[4] Lau, H. C. W., Lee, W. B. (2000), On a responsive supply chain information system, International Journal of Physical Distribution & Logistics 30 (7/8), 598-610.
[5] Motwani, J., Madan, M., Gunasekaran, A. (2000), Information technology in mana-ging supply chains, Logistics Information Management 13 (5), 320-327.
[6] Mishra S. S. and Yadav D. K. (2008), Cost and Profit analysis of M/Ek /1 queuing
system with removable service station, Bulgarian Journal of Applied Mathematical Sciences, Vol. 2, No. 56, 2777-2784.
[8] Philip, G., Pedersen, P. (1997), Inter-organizational information systems: Are organizations in Ireland deriving strategic benefits from EDI, International Journal of Information Management 17 (5), 337-357.
[9] Srinivasan, K., Kekre, S., Mukhopadhyay, T. (1994), Impact of electronic data, interchange technology on JIT shipments, Management Science 40, 1291-1304.
[10] Tan, K. C. (2001), A framework of supply chain management literature, European Journal of Purchasing & Supply Management 7, 39-48.
[11] Watson, R. T., Akelsen, S., Pitt, L. F. (1998), Building mountains in that at landscape of the World Wide Web, California Management Review, 36-56.
A CHAOTIC POPULATION
GROWTH MODEL AND DISABILITY
Vesna D. JABLANOVIC*
Abstract. Chaos theory, as a set of ideas, attempts to reveal structure in
aperiodic, unpredictable dynamic systems such as the fluctuation of populations. Although chaotic systems can be described by mathematical equations, chaos theory shows the difficulty of predicting their long-range behavior. In this sense, it is important to construct deterministic, nonlinear population dynamic growth model. Chaos embodies three important principles: (i) extreme sensitivity to initial conditions; (ii) cause and effect are not proportional; and (iii) nonlinearity. The basic aim of this paper is to provide a relatively simple chaotic population growth model that is capable of generating stable equilibria, cycles, or chaos depending on parameter values including the problem of disability.
A key hypothesis of this work is based on the idea that the coefficient
π =
f h m p
p
− plays a crucial role in explaining local stability of the
population, where f – the share of population which belongs to labour force; m – the coefficient of marginal productivity of disabled memebers of society; p – the real gross domestic product per capita; h – the share of labour force which belong to disable people. The estimated chaotic population model shows the stable and declining population growth in the EU-27 countries in the observed period.
Keywords: chaos, population growth, disability, EU-27.
1. Introduction
Chaos theory is used to prove that erratic and chaotic fluctuations can indeed arise in completely deterministic models. Chaos theory reveals structure in aperiodic, dynamic systems. The number of nonlinear business cycle models use chaos theory to explain complex motion of the economy. Chaotic systems exhibit a sensitive dependence on initial conditions: seemingly insignificant changes in the initial conditions produce large differences in outcomes. This is very different from stable dynamic
*
systems in which a small change in one variable produces a small and easily quantifiable systematic change.
Chaos theory started with Lorenz's (1963) discovery of complex dynamics arising from three nonlinear differential equations leading to turbulence in the weather system. Li and Yorke (1975) discovered that the simple logistic curve can exibit very complex behaviour. Further, May (1976) described chaos in population biology. Chaos theory has been applied in economics by Benhabib and Day (1981, 1982), Day (1982, 1983, 1997), Grandmont (1985), Goodwin (1990), Medio (1993, 1996), Medio, A. and Lines, M. (2004), Lorenz (1993), Shone, R. (1999) among many others [1÷20].
The basic aim of this paper is to provide a relatively simple chaotic population growth model that is capable of generating stable equilibria, cycles, or chaos depending on parameter values.
2. The chaotic population growth
model and disability
Irregular population movement can be analyzed in formal framework of the chaotic growth model:
D Y m
Δ Δ
= (1)
t t
S Y
p= (2)
Lt = f St (3)
Dt = h Lt (4)
Yt = Lt ½, (5)
where: Y – represents the real gross domestic product; L – labour force;
S – population; D – disabled memebers of society; f – the share of
By substitution one derives:
.
2 2
1 t t
t S mhf p p h m S mhf p p S − − − =
+ (6)
Further, it is assumed that the current value of population is restricted by its maximal value in its time series. This premise requires a modification of the growth law. Now, the population growth rate depends on the current size of the population, S, relative to its maximal size in its time series We introduce s as s = S/Sm. Thus s range between 0 and 1. Again we index s by t, i.e., write to refer to the size at time steps t = 0, 1, 2, 3, ... Now growth rate of the population is measured as:
. m S t s . 2 2
1 t t
t s f h m p p h m s mhf p p s − − − =
+ (7)
This model given by equation (7) is called the logistic model. For most choices of f, m, h and p there is no explicit solution for (7). Namely, knowing f, m, h and p and measuring s0 would not suffice to predict st for
any point in time, as was previously possible. This is at the heart of the presence of chaos in deterministic feedback processes. Lorenz (1963) discovered this effect – the lack of predictability in deterministic systems. Sensitive dependence on initial conditions is one of the central ingredients of what is called deterministic chaos.
This kind of difference equation (7) can lead to very interesting dynamic behavior, such as cycles that repeat themselves every two or more periods, and even chaos, in which there is no apparent regularity in the behavior of st . This difference equation (7) will posses a chaotic region.
Two properties of the chaotic solution are important: firstly, given a starting point s0 the solution is highly sensitive to variations of the
parameters f, m, h and p; secondly, given the parameters f, m, h and p, the solution is highly sensitive to variations of the initial point s0. In both cases
the two solutions are for the first few periods rather close to each other, but later on they behave in a chaotic manner.
3. Logistic equation
May. The logistic model was originally introduced as a demographic model by Pierre François Verhulst.
It is possible to show that iteration process for the logistic equation:
] 1 , 0 [ ], 4 , 0 [ ), 1 (
1 =π − π∈ ∈
+ t t t
t z z z
z , (8)
is equivalent to the iteration of growth model (7) when we use the identification:
and
t t mh p s
z = .
f h m p p − =
π (9)
Using (9) and (7) we obtain:
= ⎥ ⎦ ⎤ ⎢ ⎣ ⎡ − − − = = + + 2 2 1
1 t t t
t s f h m p p h m s f h m p p p h m s p h m z . 2 3 2 2 2 t t s f h m p p h m s f h m p p h m − − − =
Using (8) and (9) we obtain:
= − ⎟⎟ ⎠ ⎞ ⎜⎜ ⎝ ⎛ − = − π =
+1 t(1 t) t(1 t)
t mh ps mh p s
f h m p p z z z . 2 3 2 2 2 t t s f h m p p h m s f h m p p h m − − − =
Thus we have that iterating 2
2
1 t t
t s f h m p p h m s f h m p p s − − − =
+ is
really the same as iterating zt+1=πzt(1−zt) using zt =mh pst and
. f h m p p − =
π It is important because the dynamic properties of the
logistic equation (7) have been widely analyzed (Li and Yorke (1975), May (1976)).
It is obtained that:
• (i) For parameter values 0 <π< 1 all solutions will converge to z = 0;
• (iii) For 1 <π<2 all solutions monotnically increase to ;
/ ) 1 (π− π
=
z
• (iv) For 2 <π< 3 fluctuations will converge to z=(π−1)/π;
• (v) For 3 <π< 4 all solutions will continously fluctuate;
• (vi) For 3,57 <π< 4 the solution become “chaotic” wihch means that there exist totally aperiodic solution or periodic solutions with a very large, complicated period. This means that the path of zt fluctuates in an apparently random fashion over time, not
settling down into any regular pattern whatever.
4. Empirical evidence
The main aim of this paper is to analyze the population growth stability in the EU-27 countries in the period 1998-2009. by using the presented non-linear, logistic growth model (10):
(10)
2 1 t t
t s s
s + =α −β
where:
s –represents population, ,
f h m p
p
− =
α .
2
f h m p
p h m
− = β
Firstly, we transform data on population [Source: Eurostat Yearbook 2006-07] from 0 to 1, according to our supposition that actual value of population, S, is restricted by its highest value in the time-series, Sm. Further, we obtain time-series of s = S/Sm. Now, we estimate the model (10). The results are presented: (Source: Eurostat Yearbook 2006-07, European Commission):
• EU-27 1998-2009:
R = .99808 Variance explained: 99.616%
α β
Estimate .91761 –.08796
Std.Err. .02248 .02302
t(9) 40.82530 –3.82167
5. Conclusions
This paper suggests conclusion for the use of the chaotic population growth model in predicting the fluctuations of the population. The model (7) has to rely on specified parameters f, m, p, h and initial value of the population, s0. But even slight deviations from the values of parameters f,
m, p, h, and initial value of the population, s0, show the difficulty of
predicting a long-term population behaviour.
A key hypothesis of this work is based on the idea that the coefficient
π =
f h m p
p
− plays a crucial role in explaining local population stability,
where f represents the share of population which belongs to labour force; m – the coefficient of marginal productivity of disabled members of society; p – the real gross domestic product per capita; f – the share of population which belongs to labour force. An estimated values of the coefficient π =
f h m p
p
− = 0.91761 in the EU-27 countries is smaller than
1 in the observed period. This result confirms stable but declining population growth in the EU-27 countries in the observed period.
REFERENCES
[1] J. Benhabib, R. H. Day (1981), Rational Choice and Erratic Behaviour, Review of Economic Studies 48, 459-471.
[2] J. Benhabib, R. H. Day (1982), Characterization of Erratic Dynamics in the Over-lapping Generation Model, Journal of Economic Dynamics and Control 4, 37-55. [3] J. Benhabib, K. Nishimura (1985), Competitive Equilibrium Cycles, Journal of
Economic Theory 35, 284-306.
[4] R. H. Day (1982), Irregular Growth Cycles, American Economic Review 72, 406-414.
[5] R. H. Day (1983), The Emergence of Chaos from Classica Economic Growth, Quarterly Journal of Economics 98, 200-213.
[6] R. H. Day (1997), Complex Economic Dynamics Volume I: An introduction to dynamical systems and market mechanism, MIT Press, in: Discrete Dynamics in Nature and Society, Vol. 1, 177-178.
[7] *** Europe in figures, 2007, Eurostat Yearbook 2006-07, European Commission. [8] R. M. Goodwin (1990), Chaotic Economic Dynamics, Clarendon Press, Oxford. [9] J. M. Grandmont (1985), On Enodgenous Competitive Business Cycles,
Econome-trica 53, 994-1045.
[11] E. N. Lorenz (1963), Deterministic nonperiodic flow, Journal of Atmospheric Sciences 20, 130-141.
[12] H. W. Lorenz (1993), Nonlinear Dynamical Economics and Chaotic Motion, 2nd edition, Springer-Verlag, Heidelberg.
[13] R. M. May (1976), Mathematical Models with Very Complicated Dynamics, Nature 261, 459-467.
[14] A. Medio (1993), Chaotic Dynamics: Theory and Applications to Economics, Cambridge University Press, Cambridge.
[15] A. Medio (1996), Chaotic dynamics. Theory and applications to economics, Cambridge University Press, in: De Economist 144 (4), 695-698.
[16] A. Medio, M. Lines (2004), Nonlinear Dynamics. A primer, Cambridge University Press 2001, in: De Economist 152, 143-145.
[17] H. O. Peitgen, H. Jürgens, D. Saupe (1992), Chaos and Fractals-New Frontiers of Science, Springer-Verlag, New York.
[18] O. E. Rössler (1976), An equation for continuous chaos, Phys. Lett, 57A, 397-398. [19] R. Shone (1999), Economic Dynamics: Phase diagrams and their economic
appli-cation, in: De Economist 147, 113-115.
SOME TYPICAL ECONOPHYSICS’
AND SOCIOPHYSICS’ MODELS
Gheorghe SĂVOIU*
Abstract. Some typical Econophysics’ and Sociophysics’ models result from
this new sciences’ way of thinking or from the physicist’s methods used in other domains as Economics and Sociology. This paper describes the improvements of the quality in the classical research of Economics and Sociology through some of these new and still typical models and tries also to investigate why econophysicists’ and sociophysicists’ models are able to perform financial or sociological analysis, and which are their most interesting strengths and weaknesses. Econophysicists’ and Sociophysicists’ models seek to integrate the Physics’ methods and laws with classical Economics’ and Sociology’s theory and thinking, seeing this new domain of applied Physics as an unlimited one. Econophysics and Sociophysics replace conventional ways, with the new and broader views of Physics’ thinking. The author believes that an important scope and intention of this paper is to draw a repertory of some typical models for the use of Economics and Sociology. In addition to this main purpose, the paper could be a statistical evaluation of some not so typical phenomena as crises or recessions, which can be reordered along the new coordinates of contemporary Physics’ thinking and specific models.
Keywords: Statistical Physics, Econophysics’ model, Sociophysics‘ model,
power law, diffusion, weak and strong signals.
1. Introduction
Econophysics and Sociophysics describe applications of Physics to
different fields, similar to Astrophysics, Geophysics, and Biophysics. The specific fields or domains are in these distinctive cases Economics and Sociophysics.
Thus, Econophysics is an “interdisciplinary research field applying
methods of statistical Physics to problems in Economics and Finance” [1]. The contemporary way to define Econophysics is to do so in terms of the
ideas that it involves in effect physicists doing Economics with theories from Physics, this raises the question of how the two disciplines relate to each other and it explains interest rates and fluctuations of stock market prices, these theories draw analogies to earthquakes, turbulence, sand piles, fractals, radioactivity, energy states in nuclei, and the composition of elementary particles.
Sociophysics is a new insight into the applicability of much of
elementary statistical physics to the social sciences. Sociophysics means a
new insight followed by transferring and further developing ideas and concepts common to Physics, Biology, and Ecological Systems. First named Psychophysics, Sociophysics can be described as the sum of activities of searching for fundamental laws and principles that characterize human behaviour and result in collective social phenomena. Sociophysics tries to model the dynamics of social and economic indicators of a society and investigate how life extension will influence fertility rates, population growth and the distribution of wealth [2], religion, friendship and sex,
social network, traffic etc. Sociophysics has become an attractive field of
research over the last two decades, despite the controversies between sociophysicists and sociologists. Its relevant potential used for understan-ding the social phenomena always will win.
Econophysics and Sociophysics improve the quality of the classical research of Economics and Sociology through their original models. New models, already called typical after only five years, result from a new way of thinking or from the trans-disciplinary methods used in new domains.
2. The scientific research model
The expansion of contemporary science has multiplied their number to over 1,000 independent sciences, especially within borderline areas (e.g. econophysics, situated at the border between physics and economics, sociophysics – at the border between physics and sociology etc.). Science emerges when at least three elements are joined together: a distinctive theory, a segment of reality as a specific object, and a model interposed between theoretical investigation and its object of study. Sciences have their own characteristic models and laws, acquired mainly thanks to their inclination for measuring their object of study.
presentation laying special emphasis on the logical element of a visual nature have been, and are still, simplified alternatives to modelling.
In a relevant way, the model and modelling have been situated, through their initial practical uses, close to geometry, than any other scientific domain. The appearance of the term as such is linked to the year 1868, when the mathematician Eugenio Beltrami managed to construe an early Euclidian model for non-Euclidian geometry.
For the first time, he was turning the model and modelling into a concept, studying, by their agency, “a domain, a phenomenon, an object inaccessible to direct research”. The geometry-inspired model became “a coagulant factor” for scientific thinking, a continuous process of ponde-ring, represented, symbolized and conveyed, no less than the tetragrams were to Gottfried von Leibniz the inductive solution to the mechanic system of his own calculating mechanical device. At a higher level of elaboration, models are scientific representations, or representations of scientific theories. Paraphrasing Parmenides, the model that can be thought, and the one for which the thought exists are one and the same. Theoretical science, a permanent source of experimental suggestions, becomes at once experimenting and foreseeing, and along these lines the basic conditions of multi-dimensional modelling can be synthesized as follows:
– the first condition for a model is its direct relationship with thinking (“a bird is a machine functioning in accordance with the laws of mathematics, an instrument that man can reproduce with all its motions” –
to quote Leonardo da Vinci, in Macchine per volare);
– a second condition is the identification of the essential aspects, and formulating questions in a correct manner;
– the profoundness, the intensity, and the depth represent the third condition of representation through models (the oscillation between analogy and he convention-symbol);
– the efficiency of the transposition, or the translation of the theory into the reality of the world under study seems to be anther condition, the superior models becoming themselves objects of research and re-modelling [3].
exclusive answer to the question “what is a model” constitutes a difficult undertaking, and needs many-sided approaches. Below are some illustrative variants:
– in the option of physics, a model is a calculating instrument, with the help of which one can determine the answer to any question concerning the physical behaviour of the system in question, or else a precise pattern of a certain segment of the physical reality (two examples, which are today as well-known as to become banal, are the modelling of the inertial reference system, and the atomic model);
– in the vision specific to chemistry, the model becomes a structural concept that attempts to explain the properties found experimentally, or a support in deductively passing from the general to the specific, a knowing instrument that forecasts facts and “indicates the numbers” (as in the memorable example of Mendeleyev’ s table of elements, or the periodicity of chemical elements);
– in the approach of biology (genetics), a model is considered a natural modality – reproduced experimentally – of genetically differen-tiating the populations (the model of DNA being, in this respect, a commonly cited example, and a relevant point in case);
– in the perspective of mathematics, the model is superposed to a certain type of measuring methods, specific to mathematical research, with a view to explain, in an objective manner, the “manner n which the micro-components and their mutual interactions, either interpreted individually, or grouped in subsystems, generate and explain the whole of the system” (Octav Onicescu and the model of informational energy), or a “definition and non-contradictory description of a number of processes and phenomena”, of the theses, postulates and axioms, as well as their logical and mathematical correspondence;
– from a logical point of view, within the structure of the model, the causes equalize the effect (Anton Dumitriu);
– from a behaviourist standpoint, the model presupposes a number of participants gathered in a formal way, who “maximize their utility by starting from a stable set of preferences and accumulate an optimal amount of information in a variety of markets” (Becker’s model);
– in its statistical acceptation, the phase-directed sense of the concept of model is that of a link in an integrated process of knowing, and is made up of a hypothesis, a schematic representation of a process (phenomenon), the statistical testing, and the resuming of the process in a general theory;
– in keeping with modern sciences, the multidisciplinary model becomes the optimum instrument for solving a number of complex general problems, and modelling turns into a series of means meant to disclose the real nature of the problems, where the isolated vision does not allow one to formulate characteristic laws.
– the statistical & mathematical or statistical & physical type of modelling is a mathematical transcription of a number of simplified hypotheses about the state or evolution of a social-economic phenomenon, or physical system under the factorial influence of variables that are physical or can be assimilated to the physical ones (in the modern scientific vocabulary, a statistical model also designates the explanatory hypothesis – model: χ2,
F, t etc.).
The Econophysics’ or Sociophysics’ models turn to account the language and methods of mathematics, testing and statistical decision, the pattern of physics in assessing (quantum, thermodynamic, acoustic etc.) reality, as well as the real variables of the segment subject to research (money flow in the economy, human behaviour in sociology etc.).