A New Algorithm for Distributed Generator (DG) Placement and Sizing for
Distribution Systems
U.Krishna Chaithanya1, M.Sreenivasulu2, Sk.Jan Bhasha3 PG Student [EPS], Assistant Professor Associate Professor, Dept. of EEE, ASIT, Gudur, SPSR Nellore (D), Andhra Pradesh, India3
ABSTRACT— In today’s distribution grids the number of distributed generation units is increasing rapidly. Combined heat and power (CHP) plants and wind turbines are most often installed. Integration of these DG units into the distribution grid leads to planning as well as operational challenges. In this paper proposed a new algorithm for Distributed Generator (DG) placement and sizing for distribution systems based on a novel index. The index is developed considering stable node voltages referred as power stability index (PSI). A new analytical approach is adopted to visualize the impact of DG on system losses, voltage profile and voltage stability. The proposed algorithm is tested on 12-bus, modified 12- bus and 69-bus radial distribution networks. The test results are also compared and found to be in close agreement with the existing Golden Section Search (GSS) algorithm.
Index terms:FACTS, optimal location, Power flow,
UPFC.
1. INTRODUCTION:
Inderegulation of power system, Distribution Generation (DG) plays an important role in the present scenario. The increased power demand and to meet out the peak load demand in the distribution system, DGs are greatly utilized. By placing an optimal location with optimal size of DGs, the real and reactive power losses due to transmission are minimized and also peak load demand is appreciably shared by these DGs. this decade with the deregulation of the electricity market, the traditional concepts and practices of power systems are changed. The functions to find the optimal allocation of DG based on real and reactive power losses, line loading, voltage profile, short circuit level index and MVA (Mega Volt Ampere) intake by grid for different load models. Each load model has a significant impact on selecting size and location of the DG.
However there are several issues concerning the integration of DGs with existing power system networks; that needs to be addressed [3–5]. The integration of DG changes the system from passive to active networks, which affects the reliability and operation of a power system network[4]. Furthermore, the non-optimal placement of DG can result in an
increase of the system losses and thus making the voltage profile lower than the allowable limit[6]. Since utilities are already facing technical and non-technical issues, they cannot tolerate such additional issues. Hence an optimum placement of DG is needed in order to minimize overall system losses and therefore improve voltage profiles.
Optimization based algorithms have also been proposed by different authors. In [7], the author used the loss sensitivity equation todetermine the optimum size of DG and the exact loss equation todetermine the optimum location of DG based on minimum losses In [8], the authors presented analytical
approach to determine the optimal location for the DG with anminimization for distribution and transmissionetworks.In[9], the author presented the loss sensitivity factorbased onequivalent current injection using two Bus-Injection toBranch-Current(BIBC) and Branch-Current to Bus-Voltage (BCBV) matrix. Asimple search algorithm is proposed in[10]for optimal sizing andplacement of DG for a network system In[11], ACS (Ant Colony Search Algorithm) is used here to find the optimal placement of DG and re-closers based on system reliability. Particle Swarm Optimization algorithm is used in [12, 13] for optimum placement considering the minimum electricity cost for consumers. In [14], authors have presented the dynamic based programming approach to find the best location for DG with maximum profit as an objective function. Genetic Algorithm (GA) based methods are proposed in[15-17]
for optimal sizing and placement of DG, considering different objective functions. GA-Fuzzy based optimal placement of DG is discussed in [2], considering multi-objective functions including system losses, system loading as well as the profit for DISCOs (Distribution Companies). In [18], the author has presented the combine GA and PSO based approach for optimal location and capacity of DG, considering multi-objective constraints like voltage stability, losses and improved voltage regulations. GAs based methods are slow in computation and convergence particularly useful when multi-objective conditions are considered.
voltage-sensitive bus in the distribution system whichcould results in voltage instability in the system. DG is placed on the identified sensitive bus and the size of DG on that bus is increased gradually till the objective function (voltage constraints) is achieved. The proposed algorithm is also working on the same objective function for DG allocation. The developed index is used to identify the most critical bus in the system that can lead to system voltage instability when load increase above certain limit. The DG is placed at the identified bus. The search algorithm is used for estimating the size of DG considering minimum network losses. Overall, this proposed method is simpler and requires less computational time for determining the optimum placement and size of DG as compared to classical search algorithms .
2.1 IMPACT OF DG PLACEMENT-NEW APPROCH:
The following factors are considered in the placement and sizing of DG.
1. Reduction in line losses.
2. Improvement in voltage profile and stability.
Fig. 1a. A two bus network.
From the phasor diagram, we can write:
= − ( 1)
If we reduce the IZ component in the Eq. (1), the receiving end voltage can be improved. There are three ways to reduce the IZ components.
1.Provide active power support to the system locally using renewable energy or distributed resources or FACTS (in the present case we are considering the impact of DG only).
2.Provide reactive power support to the system locally using sta-tic condensers or FACTS.
3.Use of Anti Z element, which is only possible through series capacitance
Fig. 2a shows the active power sup-port (_PG) to the
system locally. The phasor diagram is shown inFig. 2b, which shows that the introduction of DG will reduce the active line component of the current from I to I|to I|| (I > I|> I||) as the DG size will increase. This will result in lesser Ir and Ix drop .
. Fig. 3a shows the scenario when we provide
reactive power to the system. This will reduce the
reactive current component from I to I|to I||(I||< I|< I) shown in phasor dia-gramFig. 3b, which will results in lesser Ir and Ix drop.
Fig. 1b. Phasor diagram of a simple two bus network.
Fig. 2a. Active power support
.
Fig. 2b. Phasor diagram for active power support
Fig. 3a. Reactive power support
Fig. 3b. Phasor diagram for reactive power support.
The losses that occurs in the line is given by
− = ( + ) (2)
where Peis the active power loss; Qethe reactive
power loss
The line current, given by:
= ∠ - ∠
(3)
[ ∠ − ∠ ] = ( − )( + ) (4)
From Eq.(2)and Eq.(3), we can conclude that
1.The line resistance and reactance play a very crucial role for voltage stability.
2.The line losses (or current) should be reduced for stable and improved voltages, which is only possible by providing active and reactive power support to the system Therefore the most suitable site and size of DG should be selected from where the maximum benefits could be achieved.
In [20], the author used the following mathematical formula-tion which needs to be considered in DG placement.
Minimize total active powe losses PL
{ = ∑ | | } (5)
Subject to the following generation and voltage constraints:
0 ≤ ≤ ∑ (6)
| | ≤ | | ≤ | | = 1, 2, … … ,
(7)
where n is the no. of lines; m the no. of buses; Pdgthe
distributed generation power; and Pload is the total
connected load.
The main constraints as defined in Eqs. (6–7) are to restrain the voltages at each bus along the radial system within the acceptable range and the total active power support should not exceed the system load.
3.PROPOSED CONCEPT:
The main factor in maintaining the voltage between two nodes is the drop in the line connecting the two nodes, commonly known as voltage regulation. Ideally voltage regulation should be zero, but there are drops due to resistance and reactance of a line. In transmission lines, resistance is much less than the reactance of the transmission lines (r _ x); while in overhead distribution sys-tem, reactance is much less than the resistance of the line (x _ r). There is no anti- resistance element which could improve the volt-age regulation. The series capacitor is commonly connected in long transmission lines having high reactance than a distribution net-work, in order to improve the voltage profile and increasing the system efficiency. However by supporting the active and reactive power demands locally could significantly reduced the voltage drop in the line by reduction in line current and losses and thus im-proves the system efficiency.
3.1Procedure of DG placement Index:
Consider a simple two bus network without and with DG shown in Figs.1a and2a, with their phasor diagram also presented in Figs.1b and2b.
From Fig. 1 we can write
= + = ∗ (8) =
− (9)
Where
= ∗ (10)
From fig 2a and 3a
=( ) (∗ ) (11)
Substitute Irfrom Eq.(11)into Eq.(9)and separate into
real and imaginary parts will give:
− =| || |∗ cos( − + ) −| | cos ( ) (12)
− =
| || |
∗ sin( − + ) −
| | sin( )
(13)
Rearranging eq (12) give
| | =| || | ( )( )+ ( ( ))= 0 (14)
Where
= −
The Eq.(14)is a quadratic equation. For stable node voltages, Eq.(14)should have real roots, i.e. discriminant B2_ 4AC > 0, which results in the proposed index referred as Power Stability Index (PSI) given by Eq.(15)
=[| | ( ( )]) ≤ 1 (15)
The PSI value is calculated for each line in the given network and sorted from the highest to the lowest value. For the i - j line having the highest value of PSI, the DG should be placed at j-bus. For multi DG placement, the location of the second DG will be based on the effect of first DG on PSI. PSI
The DG will be placed at the end of the line having the highest value of PSI.
3.2 Maximum sizing of DG:
selected. In the present case, the step size is maintained 1% of total load. However much smaller size could also be used, but the computation will take much longer time.
3.3 Proposed Algorithm:
For a radial distribution network, load flow analysis is carried out and PSI value is computed for each line using PSI equation. For i _ j line having the highest value of PSI, the DG will be placed at jth bus. The search algorithm is used for finding the optimum size of DG at optimum location based on a minimum total power loss, with constraints. The complete flow chart for DG allocation and sizing is represented inFigure. 4.
Figure.4: Flow chart of Proposed Algorithm.
4.SIMULATION AND RESULTS:
The proposed algorithm for DG placement and sizing is presented. For verification, the proposed algorithm is applied on 12-bus, modified 12-bus and 69-bus radial distribution networks. A computer program has been
written in MATLAB and run on Core 2 Duo 3.07 GHz processor. Shirmohammadi theoremis used to carry out the load flow analysis. As conventional load flows are not suitable for radial distribution systems because they got diverges, due to high X/R ratio which results in singularity of Jacobian matrix.
4.1 Test systems:
The test system of 12-bus and 69-busradial distribution test systems are shown inFigure 5a and 5brespectively. In modified 12-bus system, the active load on each bus is multiplied by 5 for better visualization of results, as the actual value of load is very small.
Figure.5a: Single line diagram of 12-bus radial network.
Figure.5b: Single line diagram of 69-bus radial network.
4.2 DG Placement based PSI:
Fig 6a. PSI value for each line for 12-bus Radial Distribution System
Fig. 6b PSI value for each line for modified 12-bus Radial Distribution System
Fig. 6c PSI value for each line for 69-bus Radial Distribution System
Fig. 7a: Effect of QGon system losses of 12-bus
Fig 7b: Effect of QGon system losses of modified
12-bus system
Fig. 7c Effect of QGon system losses of 69-bus system
Fig 8a.Effect of DG on system voltage profile of 12-bus system (DG size = 0.2349 MW @ 12-bus 9th)
Fig. 8c :Effect of DG on system voltage profile of 69-bus system (DG size = 1.8580 MW @ 69-bus 61st) 4.3 Overall Findings:
From the analysis of the simulation results presented in Section 4,we can conclude the following due to DG placement.
1. The voltage profile has improved 2. Line losses have reduced.
3. The overall system capacity has increased.
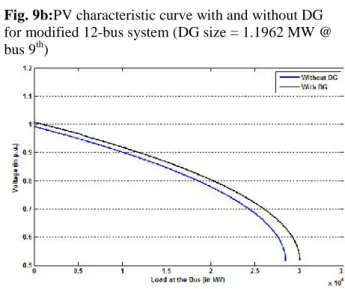
The most optimumlocation of each system and the nose curve (PV curve) isplotted for 12-bus, modified 12-bus and 69-bus systems respectively. The loading has been done at the 7th bus, 7th bus and 54th bus for 12-bus, modified 12-bus and 69-bus systems respectively. Figs. 9a, 9b and 9c demonstrate that the system capacity has increased due to the installation of DG at the best location and of optimum size.
Fig. 9a PV characteristic curve with and without DG for 12-bus system (DG size = 0.2349 MW @ bus 9th)
Fig. 9b:PV characteristic curve with and without DG for modified 12-bus system (DG size = 1.1962 MW @ bus 9th)
Fig. 9c :PV characteristic curve with and without DG for 69-bus system (DG size = 1.8580 MW @ bus 61st)
Table1: Application of proposed algorithm on radial distribution networks.
Table2:Comparison of base case to proposed algorithm on radial distribution networks
From Tables1 and 2, it could be observed that:
The proposed method results are in close agreement with GSS algorithm
The computation time has been decreased (53.6%, 52.39%, 58.45% respectively with the 12-bus, modified 12-bus and 69-bus).
A new algorithm is also proposed for DG location and sizing. The DG allocation and sizing is based on a novel Power Stability Index (PSI) index to determine the most volt-age sensitive bus and minimum total power losses. Using the pro-posed algorithm optimum DG allocation and correct sizing results in an improved voltage profile and minimizes the burden of system losses.
6.REFERENCES:
[1] Jenkins N, Ekanayake J, Strbac G. Distributed generation – IET Factfiles; 2010. http://www.theiet.org/factfiles/energy/distributed-generation.cfm[accessed 10.08.11].
[2] Energy Networks Association (UK).
<http://2010.energynetworks.org/distributed-generation> [accessed 10.08.11].
[3] Hadjsaid N, Canard JF, Dumas F. Dispersed generation impact on distribution networks. IEEE ComputAppl Power 1999;12:22–8.
[4] Koeppel. G. Distributed generation-literature review and outline of the Swiss station: Internal Report, ETH Zurich; November 2003
[5] Tuitemwong K, Premrudeepreechacharn S. Expert system for protection coordination of distribution system with distributed generators. Int J Electr Power 2011;33:466–71.
[6] Griffin T, Tomosovic K, Secrest D, Law A. Placement of dispersed generations systems for reduced losses. In: 33rd International conference on sciences. Hawaii; 2000.
[7] Acharya N, Mahat P, Mithulananthan N. An analytical approach for DG allocation in primary distribution network. Int J Electr Power. 2006;28(10):669–78.
[8] Caisheng W, Nehrir MH. Analytical approaches for optimal placement of distributed generation sources in power systems. IEEE Trans Power Syst. 2004;19(4):2068–76.
[9] Gözel T, Hocaoglu MH. An analytical method for the sizing and siting ofdistributed generators in radial systems. Electr Power Syst Res2009;79(6):912– 8.
[10] Ghosh S, Ghoshal SP, Ghosh SA. Optimal sizing and placement of distributedgeneration in a network system. Int J Electr Power 2010;32(8):849–56.
[11] Lingfeng W, Singh C. Reliability-constrained optimum placement of reclosersand distributed generators in distribution networks using an ant colonysystem algorithm. IEEE Trans Syst, Man Cyber, Part C: Appl Rev2008;38:757–64.
[12] Kuersuk W, Ongsakul W. Optimal placement of distributed generation usingparticle swarm optimization. In: Australian universities power engineeringconference (AUPEC’ 06); 2006.
[13] Moshtagh J, Jalali A, Karimizadeh K. Optimum placement and sizing of DGusing binary PSO algorithm to achieve the minimum electricity cost forconsumers. Int Rev ElectrEng-I 2010;5(6):2873–81.
[14] Khalesi N, Rezaei N, Haghifam MR. DG allocation with application of dynamicprogramming for loss reduction and reliability improvement. Int J Electr Power2011;33:288–95.
[15] Borges CLT, Falcão DM. Optimal distributed generation allocation forreliability, losses, and voltage improvement. Int J Electr Power2006;28(6):413–20.
[16] Kim K-H, Lee Y-J, Rhee B, Lee K, You S-K. Dispersed generator placementusing fuzzy-GA in distribution systems. In: Proceeding of IEEE powerengineering society summer meeting. Chicago; July 2002. p. 1148–53.
[17] Abou El-Ela AA, Allam SM, Shatla MM. Maximal optimal benefits of distributedgeneration using genetic algorithms. Electr Power Syst Res 2010;80:869–77.
[18] Moradi MH, Abedini M. A combination of genetic algorithm and particleswarm optimization for optimal DG location and sizing in distributionsystems. Int J Electr Power Energy Syst 2012;34:66–74.
[19] Hedayati H, Nabaviniaki SA, Akbarimajd A. A method for placement of DGunits in distribution networks. IEEE Trans Power Deliver 2008;23(3):; 1620–8
Mr.U.Krishna chaithanya was born in Andhra Pradesh, India. He received the B.Tech degree in Electrical and Electronics Engineering from N.B.K.R INSTITUTE OF SCIENCE AND TECHNOLOGY ,Vidyanagar in 2012 and pursuing M.Tech degree in Electical Power Systems from ASIT,Gudur,JTNU,Anantapur,AndhraPradesh, India His areas of interest in the field of power systems and electric Drives.Email:[email protected]
Mr.M.Sreenivasulu was born in Andhra Pradesh, India. He received the B.Tech degree in Electrical and Electronics Engineering from Audisankara College of Engineering And Technology, Gudur, A.P. in 2010. After the completion of M.Tech degree in Computer Aided power systems from Vikrama Simhapuri University,Nellore in 2012, presently he is working as Asst.Professor Dept.EEE, Audisankara Institute of Technology-Gudur, Nellore, Andhrapradesh, India.His areas of interest in power systems and electrical mechines .Email: [email protected]