13
STUDY REGARDING THE ESTABLISHMENT OF THE
RELATIONSHIPS BETWEEN THE MAIN QUALITY INDICES OF SPRING
BARLEY
AXINTI NICOLETA, CIOROMELE GABRIELA ALINA
Keywords: spring barley, yield, quality indices
ABSTRACT
This paper aims to give an analysis regarding the establishment of the relationships between the main quality indices of spring barley. The research was conducted on four spring barley varieties (Annabell, Thuringia, Cristalia and Tunika) grown on two types of soil (typical chernozem and calcaric aluviosoil) in the Vădeni area, Brăila County, in 2008-2010.
INTRODUCTION
Barley can be used for multiple purposes: as human food, as animal food and in the industry (as raw material in the making of beer and in the industry of alcohol, dextrin, glucose, etc.) (1,2,3). The actual quality of barley and spring barley is a result of the interaction between sorl, growing technology and environmental conditions (4).
MATERIAL AND METHOD
The research was conducted between 2008 and 2010 in Vădeni area, Brăila county, on four varieties of spring barley (Annabell, Thuringia, Cristalia and Tunika) grown on two different soil types (typical chernozem and calcaric aluviosoil). For the analysis of the association degree of the studied quality indices on the four spring barley varieties (Annabell, Thuringia, Cristalia and Tunika) we performed the calculation of the correlation quotient (r) and the regression analysis for the most important attributes (5).
RESULTS AND DISCUSSIONS
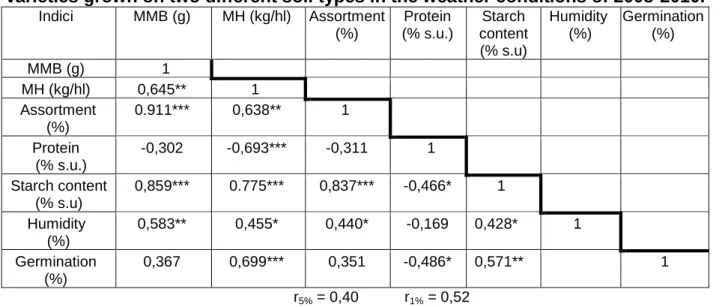
The results regarding the correlation quotients between the quality indices that were studied on the four spring barley varieties grown in Vadeni area, Braila county, in 2008-2010 are presented in table 1.
As it can be observed, the obtained correlation quotients show the existance of strong and significant links between the studied quality indices.
Table 1
The correlation quotients between the quality indices of the spring barley varieties grown on two different soil types in the weather conditions of 2008-2010.
Indici MMB (g) MH (kg/hl) Assortment (%) Protein (% s.u.) Starch content (% s.u) Humidity (%) Germination (%)
MMB (g) 1
MH (kg/hl) 0,645** 1 Assortment
(%)
0.911*** 0,638** 1
Protein (% s.u.)
-0,302 -0,693*** -0,311 1
Starch content (% s.u)
0,859*** 0.775*** 0,837*** -0,466* 1
Humidity (%)
0,583** 0,455* 0,440* -0,169 0,428* 1
Germination (%)
0,367 0,699*** 0,351 -0,486* 0,571** 0,159 1
14
The analysis of the results in table 1 shows that the mass of 1000 grains (MMB) is positively correlated with the hectolitric mass (r = 0.645***), the assortment (r = 0.911***), the starch content (r = 0.859***) and the humidity (r=0.583**). The hectolitric mass is positively correlated with the starch content in the first place (r = 0.775***) and then with the assortment (r=0.638**) and the germination (r = 0.699***). Likewise, the assortment was positively correlated with the humidity (r = 0.440*) and the starch content (r = 0.837***). A positive correlation that was statistically significant was also obtained between the starch content and germination. From the registered negative correlations, the following stand out: between the protein content and hectolitric mass (r = 0.693***) and the starch contents (r = -0.466), protein and germination (r = -0.486*).
For a more precise examination of the correlations that were found between the quality indices of the studied varieties, we performed the regression analysis for the most important attributes.
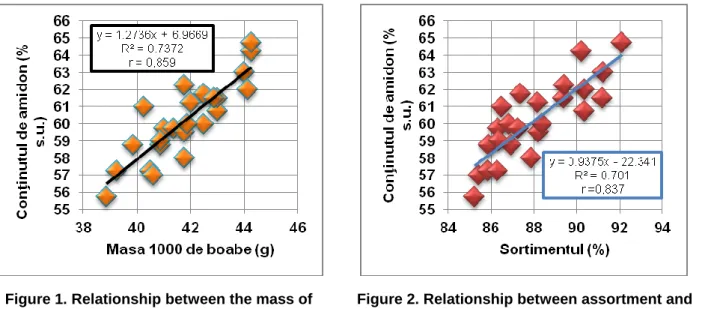
Figure 1. Relationship between the mass of 1000 grains and starch content
Figure 2. Relationship between assortment and starch content
The relationship between the starch content and the mass of 1000 grains is presented in figure 1. The correlation quotient with the value r = 0.859, indicates the existance of a significantly possitive relationship between the two quality indices. This relatioship is described by a regression line with an ascendent slope (b =1.22), which shows that there is a strog relationship between the starch content and the mass of 1000 grains. The determination quotient (R2 = 0.7029) shows that in the case of the four studied genotypes, the variation of starch contents happens, in proportion of 70%, due to the variation of the mass of 1000 grains.
Figure 2 shows the relationship between the starch contents and assortment. The correlation quotient with the value r = 0.837 indicates the existance of a very significant positive relationship. This is also confirmed by the configuration of the points cloud from the graphic representation. The relationship between these qualitative parameters is described by a regression line with an ascendent slope (b = 0.94), which shows the fact that there is a link between these indices. The determination quotient (R2 = 0.701) indicates that, in the case of the four studied varieties, 70% of the starch content variatien can be attributed to the variation of the assortment.
15
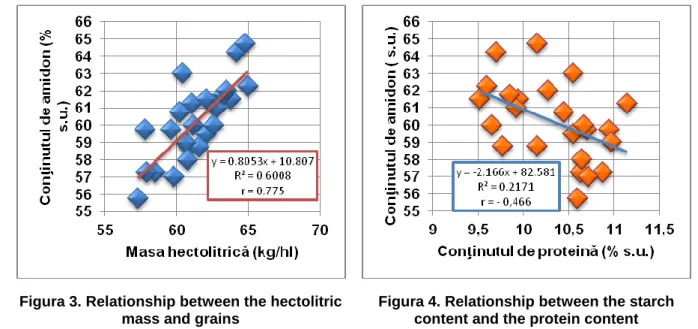
hectolitric mass has a value of r = 0.775 which represents a very significant positive relationship between the two quality indices. The determination quotient (R2 = 0.6008) indicates that the variation of the starch content is determined in proportion of 60% by the variation of the hectolitric mass.
Figura 3. Relationship between the hectolitric mass and grains
Figura 4. Relationship between the starch content and the protein content
Figure 4 presents the relationship between the starch content and the protein content. The correlation quotient with the value r = -0.466 indicates the existance of distinctly significant negative relationship. The relationship is described by a descendent regression line with the slope b = -2.166, expressing a strong relationship between the starch content and protein content. The determination quotient (R2 = 0.2171), shows that 21% of the variation of starch is influenced by the protein content.
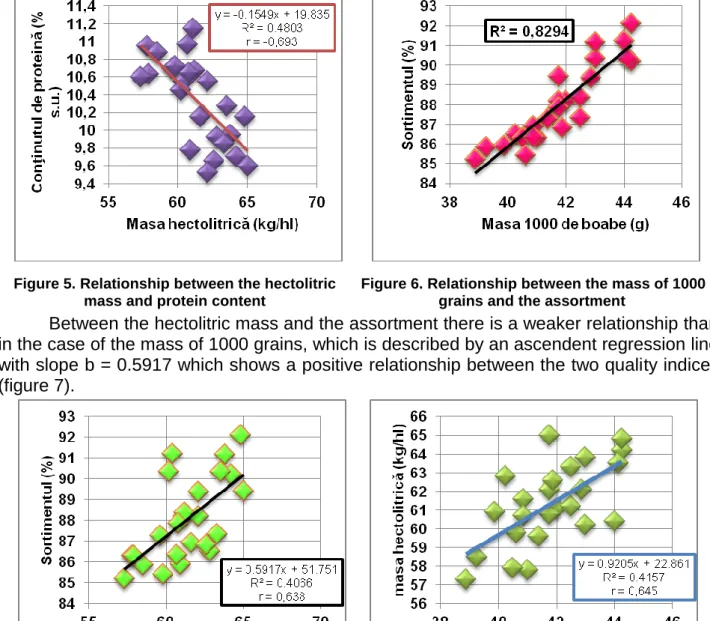
The relationship between the hectolitric mass and the protein content is presented in figure 5.
The correlation quotient between the hectolitric mass and the protein content (r = -0.693) shows a very significant negative relationship between the two studied quality indices. The relationship is described by a descendent regression line with slope b = -0.15 which shows that there is a negative, very significant link between the two quality indices of the studied spring barley varieties. The determination quotient (R2 = 0.4803), shows that 48% of the variation of protein contents depend on the hectolitric mass of the grains.
16
Figure 5. Relationship between the hectolitric mass and protein content
Figure 6. Relationship between the mass of 1000 grains and the assortment
Between the hectolitric mass and the assortment there is a weaker relationship than in the case of the mass of 1000 grains, which is described by an ascendent regression line with slope b = 0.5917 which shows a positive relationship between the two quality indices (figure 7).
Figure 7. Relationship between the hectolitric mass and the assortment
Figure 8. Relationship between the mass of 1000 grains and the hectolitric mass
The relationship between the mass of 1000 grains and the hectolitric mass is shown in figure 8. This relationship is described by a regression line with an ascendent slope (b = 0.9205) which proves that the hectolitric mass is directly proportional with the mass of 1000 grains. The correlation quotient (r = 0.645) indicates a very significant positive relationship between the two quality indices. The determination quotient (R2 = 0.4157) indicates that the variation of the hectolitric mass is influenced, in proportion of 41%, by the variation of the mass of 1000 grains.
17
Figure 9. Relationship between grain humidity and the mass of 1000 grains
Figure 10. Relationship between the hectolitric mass and germination
The relationship between the hectolitric mass and germination is presented in figure 10. The relationship between these two parameters is described by an ascending regression line with slope b = 0.444 which suggests, like in the case of the mass of 1000 grains, there is a link between the grain size and the germination capacity. The correlation quotient (r = 0.699) indicates the existance of a very significant positive relationship. The determination quotient (R2 = 0.4889) shows that 48% of the germination capacity’s variation is influenced by the hectolitric mass.
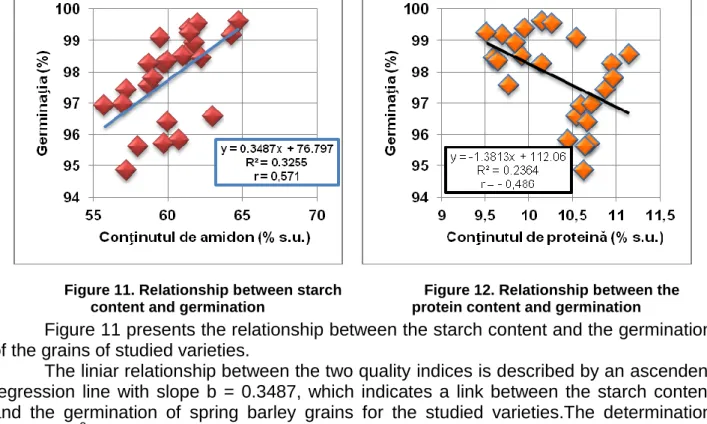
Figure 11. Relationship between starch content and germination
Figure 12. Relationship between the protein content and germination
Figure 11 presents the relationship between the starch content and the germination of the grains of studied varieties.
The liniar relationship between the two quality indices is described by an ascendent regression line with slope b = 0.3487, which indicates a link between the starch content and the germination of spring barley grains for the studied varieties.The determination quotient (R2 = 0.3255) shows that 32% of the germination capacity’s variation is influenced by the starch content.
18
CONCLUSIONS
1. The starch content of the grains was favourably influenced by all the analysed parameters, correlating positively (strongly or very strongly) and statistically assured with the mass of 1000 grains, hectolitric mass, assortment, humidity and germination with the exception of the protein content of the grains.
2. The assortment was favourably influenced, positively correlating, by the mass of 1000 grains, hectolitric mass and grain humidity.
3. Out of the correlation quotients with a negative value, the relationship between the protein content and the starch content stands out (r = -0.466*);
4. The protein content of the grains had a general tendency to negatively influence the other analyzed elements.
5. The germination capacity was favourably influenced, positively correlating with the starch content of the grains and the hectolitric mass. The germination capacity has been negatively correlating with the protein content, this fact having statistical coverage.
6. The obtained results are supported by the aspect of the correlograms obtained for each data series separately.
BIBLIOGRAPHY
1.Axinte M., 2006 - Fitotehnie, Ed. Ion Ionescu de la Brad, Iași;
2.Bilteanu Gh., 2003 - Fitotehnie, vol. I, Ed. Ceres, Bucuresti, p.183-210.
3.Drăghici L. și colab.,1975 - Orzul, Ed. Academiei Republicii Socialiste România, Bucureşti, p.68-69.
4.Axinti Nicoleta, Dumitru Manuela, 2007 - Study about some kinds of spring two-row barley cultivated in the plain of Braila between 2004 -2006 referring to the main indexes of quality being important for the malt production, Lucrǎri ştiinţifice seria Horticulturǎ, Anul L
(50), Editura "Ion Ionescu de la Brad" Iași, p. 835-841.