Vol.3 No.5 October 2016: 24-30 Article history:
Accepted 10 July 2016 Published online 10 July 2016
Journal of Soft Computing and Decision
Support Systems
A Multi-Criteria Collaborative Filtering Recommender System Using Clustering
and Regression Techniques
Mehrbakhsh Nilashi a,b,*, Mohammad Dalvi-Esfahani a, Morteza Zamani Roudbaraki b, T. Ramayah c, Othman Ibrahim a a Faculty of Computing, Universiti Teknologi Malaysia, Malaysia
b
Department of Computer Engineering, Lahijan Branch, Islamic Azad University, Lahijan, Iran c Department for Operations Management Section at the School of Management, USM, Malaysia
* Corresponding author email address: [email protected]
Abstract
Traditional Collaborative Filtering (CF) recommender systems recommend the items to users based on their single ratings which are used to match similar users. In multi-criteria CF recommender systems, however, multi-criteria ratings are used instead of single ratings which can significantly improve the accuracy of traditional CF algorithms. This research proposes a new recommendation method using Classification and Regression Tree (CART) and Expectation Maximization (EM) for accuracy improvement of multi-criteria recommender systems. We also apply Principal Component Analysis (PCA) for dimensionality reduction and to address multi-collinearity induced from the interdependencies among criteria in multi-criteria CF datasets. Experimental results on Yahoo! Movies and TripAdvisor datasets demonstrated that the proposed method significantly improves recommendation accuracy of multi-criteria CF.
Keywords: Multi-criteria recommender systems, Accuracy, CART, Collaborative Filtering
1. Introduction
During the last decade the amount of information available online increased exponentially and information overload problem has become one of the major challenges faced by Information Retrieval (IR) and Information Filtering (IF) systems. Recommender systems are one solution to the information overload problem. They support the online customer in his/her decision making and buying process (Bagherifard et al., 2013; Nilashi et al., 2013; Nilashi et al., 2014a; Nilashi et al., 2014b; Vahid et al., 2016). Recommender systems based on Collaborative Filtering (CF) are particularly popular and used by large online retailers (Nilashi et al., 2015a; Nilashi et al., 2015b; Farokhi et al., 2016).
The ratings provided by users for items are the key input to CF recommender systems. They present information regarding the quality of the item along with the preference of the user who shared the rating. Principally, the large numbers of recommender systems are developed for single-valued ratings. For example they consider single rating for each user and item that indicates how much the item is liked by the user in system. However, another idea is multiple components (criteria) that sometimes recommender systems are design by them. For example, the Zagat system considers rates of restaurants on four components for its customer’s servings as food, decor,
services and cost. Correspondingly, in a Yahoo! movies recommender system, four criteria such as Acting, Visual Effects, Direction, and Story could be rated by users. The objective of a CF algorithm is to recommend new products or to estimate the utility of a certain product for a specific user depending on the customer’s past likings and the views of other like-minded users. There are two tasks that a CF can perform, leading to two unique kinds of result. The first task is the rating prediction process which is predicting the rating that a given unseen product will have for the target user. Recommendation task as a second task in CF provides top-N recommendation contains of unseen relevant items for the target user.
CF algorithms can be divided into two categories: memory-based algorithms and model based algorithms (Nilashi et al., 2013; Adomavicius and Tuzhilin, 2005; Deshpande and Karypis, 2004). Memory-based (also called neighborhood-based) algorithms are also known as lazy recommendation algorithms, because they defer the actual computational effort of predicting a user’s interest in an item to the moment a user requests a set of recommendations. The training phase of a memory-based algorithm consists of simply storing all the user ratings into memory. The idea of memory-based methods is that the rating predictions for a user directly depend on his/her similar users’ ratings on similar items. Since the entire rating database is kept in memory, new ratings can
immediately be taken into account as they become available (Symeonidis et al. 2008). The major drawback with memory based CF techniques is as already noted that they tend to scale very poorly, larger rating databases require more memory and more calculations which slow down the recommendation process. There are two variants of memory-based recommendation and both are based on the K-Nearest Neighbor (K-NN) algorithm from the field of machine learning: user-based filtering and item-based filtering. User-based CF has been the most popular and commonly used (memory-based) CF strategy (Konstan et al., 1997). It is based on the premise that similar users will like similar items. A user profile is collected and maintained for each user which records the items that he has consumed over time, and usually a corresponding set of ratings that judge how much he liked or disliked each item. In this manner, a model of the user’s preferences for different types of items is constructed. Sometimes other types of information pertaining to the user, such as demographical information (Pazzani 1999) may also be collected in the user profile. One of the core challenges for user-based CF is the accurate identification of similarities between users based on their shared preferences.
Item-based CF was first proposed by (Sarwar et al., 2001) as an alternative style of CF that avoids the scalability bottleneck associated with the traditional user-based algorithm. The bottleneck arises from the search for neighbors in a population of users that is continuously growing. The authors argued that in an electronic commerce environment the set of items is often more static than the set of users which changes quite often. In item-based CF, similarities are calculated between items rather than between users, the intuition being that a user will be interested in items which are similar to items he has liked in the past. Two of the most popular approaches to computing similarities between users and items are the Pearson correlation coefficient and cosine-based coefficients. However, one of the problems in the recommender systems especially CF is known as the sparsity problem. Thus, these approaches make poor computation similarity when rating information is insufficient and with considering this problem, system produces the poor recommendation (Park and Chang, 2009). Furthermore, memory based CF approaches suffer from the scalability problem. Therefore, scaling up theses system on real datasets is one of the main challenges that many methods have been developed to overcome it (Tsai and Hung, 2012).
Compared with memory based algorithms, model-based algorithms usually scale better in terms of their resource requirements (memory and computing time) and do not require keeping actual user profiles for predictions (Georgiou and Tsapatsoulis, 2010). Model-based methods, such as Bayesian networks and clustering models (Bilge and Polat, 2013), address the problem from a probabilistic perspective to find the best item for a given user profile, and need only keep the resulting model in memory while the algorithm is running. Model-based CF, for example the work of Breese et al. (1998), can often offer significant
advantages over memory-based algorithms in terms of efficiency but have not offered the same level of accuracy. It adopts an eager learning strategy, taking a probabilistic approach to predicting or recommending content, where a model of the data, i.e. the users, items and their ratings for those items, is pre-computed (Rennie and Srebro, 2005). Indeed Breese et al. (1998) found that their model-based algorithms were four times faster than their memory-based algorithms at generating recommendations in terms of runtime.
2. Related Work
In case of multi-criteria CF, few researches has been conducted to develop the similarity calculation of the traditional memory-based CF approach to investigate multi-criteria rating (Tang and McCalla 2009; Manouselis and Costopoulou 2007; Adomavicius and Kwon 2007) that the similarities between users are estimated through aggregating traditional similarities from individual criteria or applying multidimensional distance metrics. In order to develop the idea of Adomavicius and Kwon (2007), Sahoo et al. (2011, 2006) extended the Flexible Mixture Model (FMM) developed by Si and Jin (2003) to multi-criteria recommender systems. The aim of their paper was to exploit context information about the user as well as multi-criteria ratings in the recommendation process. Li et al. (2008) presented a multi-criteria rating approach to improve personalized services in mobile commerce using Multi-linear SVD (MSVD). The aim of their paper was to exploit context information about the user as well as multi-criteria ratings in the recommendation process. Liu et al. (2011) presented a multi-criteria recommendation approach which is based on the clustering of users. Their idea is that for each user one of the criteria is “dominant” and users are grouped according to their criteria preferences. They applied linear least squares regression, assign each user to one cluster, and evaluate different schemes for the generation of predictions. They evaluated methods on hotel domain dataset with five criteria, Value, Location, Rooms, Service, and Cleanliness. Jannach et al. (2012) developed the accuracy of multi-criteria CF by proposing a method using SVR for automatically detecting the existing relationships between detailed item ratings and the overall ratings. In addition, the learning process of SV regression models was per item and user and lastly combined the individual predictions in a weighted approach. Nilashi et al. (2015a) developed a multi-criteria CF method using incremental SVR and clustering techniques. They evaluated the recommendation method on Yahoo!Movie dataset.
Hence, in comparison with research efforts found in the literature for multi-criteria CF, our work has the following differences. In this research:
A hybrid recommendation method using clustering and regression techniques is proposed for improving the predictive accuracy of multi-criteria CF.
We use EM for data clustering and CART for regression task.
PCA is applied for dimensionality reduction and to address multi-collinearity induced from the interdependencies among criteria in multi-criteria CF datasets.
Two datasets (Yahoo!Movie and TripAdvisor) are used for proposed method evaluation.
The remainder of this paper is organized as follows: In Section 3, multi-criteria CF is presented. Section 4 provides the methods. Section 5 presents the recommendation method evaluation and finally, conclusions and future work are presented in Section 6.
3. Multi-criteria collaborative filtering
Adomavicius and Kwon (2007) stated that single-rating CF recommenders are indicated as systems that attempt to estimate a rating function R that has the form user×item→R0 for predicting a rating for any given user-item pair. R0 is totally ordered set, typically composed of real-valued numbers inside a certain range. They further disclosed that, in multi-criteria recommender systems, in comparison, the rating function R0 gets the form user×item→R0×R1×…× Rk. Therefore, an overall rating R0 must be predicted in addition to the k additional criteria ratings. The overall rating shows how well the user likes the item overall, and the criteria ratings provide the insight and explain which aspects of the item he or she likes.
Multi-Criteria CF recommender systems predict the overall rating for an item based on past ratings regarding both the item overall and individual criteria, and recommend to the user the item with the best overall score. Thus, the algorithm for a Multi-Criteria CF recommender system can be extended from a single-rating recommender system.
In Multi-Criteria CF problem, there are m users, n items and k criteria in addition to the overall rating. Users have provided a number of explicit ratings for items; a general rating R0 must be predicted in addition to k additional criteria ratings (R1,,Rk). It can be configured to push new items to users in two ways, either by producing a Top-N list of recommendations for a given target, or by predicting the target user’s likely utility (or rating) for a particular unseen item. We will refer to these as the recommendation task and the rating prediction task in Multi-Criteria CF, respectively.
Recommendation is a list of N products,
Tp Tp TpN
TP 1, 2,, , that the active user will like the most. The recommended list usually consists of the
products not already purchased by the active customer. This output interface of multi-criteria CF algorithms is also known as Top-N recommendation. Multi-Criteria CF algorithms represent the entire mnk user-item-criteria data as a tensor of ratings, A. Each entry ai,j in tensor A represents the preference score (ratings) of the ith user on the jth item as overall preference in addition to criteria ratings in the 3rd dimension. Each overall and criteria rating is within a numerical scale and it can as well be 0, indicating that the user has not yet rated that product.
4. Methods
4.1 PCA
Principal Component Analysis (PCA) is a tool for data compression and information extraction (Nilashi et al., 2015a). In some situations, there are many correlated or redundant data which must be compressed in a manner to retain the essential information. Among the widely used multivariate statistical methods, PCA is a powerful tool for analyzing such data because of its ability to handle large numbers of highly correlated, noisy and redundant variables. Using PCA, a number of related variables are transformed to a set of uncorrelated variables. It is concerned with explaining the variance-covariance structure of a set of variables through few linear combinations of these variables. Its general objectives are data reduction and interpretation.
By using initial analysis of the data in multi-criteria experimental dataset, an overlap of information can be found that affect overall rating predictions. In addition, there exists significant correlation among the input variables which are used as inputs of multi-criteria CF to build an inferential model. However, the data can be compressed to retain the essential information and make the input variables uncorrelated.
In the field of recommender systems, PCA has for example been applied by Goldberg et al. (2001) in the Jester joke recommender. In their approach, PCA was performed in an offline phase and they applied clustering on the resulting projection of the data in a two-dimensional space. Our approach is different from their work. We applied PCA after the initial clustering process individually on each cluster and determined a suitable number of Principal Components (PCs) to retain for each cluster. Then, as inputs in CART, we used the PCs for overall ratings prediction. Following this approach, it allowed us to achieve a highly accurate and up-to-date recommendations with lower computation time in predicting the overall ratings prediction.
From the experimental dataset, if we consider seven variables in the matrix , the procedure of dimensionality reduction for overcoming the multi-collinearity can be defined in two steps as follows:
PCs selection from PCA.
The selected number of PCs along with the desired output f (overall rating) are employed in developing the inferential models.
4.2 Clustering using EM algorithm
It is well known that the k-means algorithm is an instance of Expectation Maximization (EM) algorithm which is a general algorithm of density estimation. This algorithm is based on distance. Gaussian mixture model with EM algorithm is a powerful approach for clustering. EM algorithm is model based iterative algorithm for solving the clustering problem where the data is incomplete or considered incomplete. EM algorithm is an optimization algorithm for constructing statistical models of the data (Mitra et al., 2003). In this algorithm each and every data instance belongs to each and every cluster with a certain probability. EM algorithm starts with initial estimates and iterates to find the maximum likelihood estimates for the parameters. The quality of EM algorithm becomes very good when using huge dataset. It has been also demonstrated that EM is a good clustering method in terms of computation time and accuracy (Jung et al., 2014). In addition, in this study EM is chosen to cluster data for the following reasons among others (Ordonez and Omiecinski, 2002). (1) It has a strong statistical basis, (2) It is linear in database size, (3) It is robust to noisy data, (4) It can accept the desired number of clusters as input, (5) It can handle high dimensionality, and (6) It converges fast given a good initialization.
Given a dataset { }N1 i i
x the task of assigning a cluster for each instance in the dataset, is the goal that we aspire for. Let there be
N
data points in the dataset and let us assume that the number of clusters is k. Let the index of the cluster be modeled as a random variablez
j
and let its probability be given by a multinomial distributionsatisfying
j
1
, such that1
( ) j, , 1,... . . ... k 1
p z j j j k s t (1)
It is assumed that p x z( | j) ~N( j, jIj) is a
Gaussian distribution. Ij denotes the identity matrix of
order
j
. The unknown parameters of the model namely themean
j, variance
j=diag (
1,
2,...,
j) and thedistribution function
jare estimated.1
{ , , }k
j j j j
,1 1
( | ) ( ( | , ) ( | ) ( ( | , ) ,
k k
j
z j
p x p x z p z p x z j
(2)where z is an unknown hidden variable. The total log likelihood of all data is given by:
2
2 1
1
|| ||
( , ) log exp .
2
N k
i j
j j
i i
x
l D
(3)The parameter values that maximize the likelihood function l( , )
D are the ones that are chosen. Here D denotes the data. This optimization is complicated and to solve this some of the unknowns are assumed to be known, while estimating the others and vice versa. For each class, the conditional expectation ofz
j
given the data and the parameters1
( | , )
( | , )
( | , ) ( | )
( | )
( | , ) j
j j
j j
k
i i i
i
w p z j x
N x p x z j p z j
p x
N x
(4)
Since each point x contributes to wj in some proportion, for particular xi we have
1
( | , )
. ( | , )
j i j j
ij k
i i i i
i N x w
N x
(5)In Algorithm 1, the EM algorithm is described. From the EM algorithm, it can be seen that EM is mainly divided into two main steps which are step and M-step. In the E-step of EM algorithm, EM proceeds by estimating to which component each data point belongs. In M-step, EM proceeds re-estimating the parameters on the basis of the estimation in E-step. Hence, after each iteration of EM, we are guaranteed that the re-estimated parameters give at least as high a log-likelihood as the previous parameter values. In the last step of EM, we should check for convergence. In addition, E-step and M-step need to be repeated until some convergence criterion is met which in EM this can be performed based on convergence of the parameters or on the log likelihood function. It should be noted that in our study the convergence was reached after 13 iterations.
4.3 Classification and Regression Trees
Classification and Regression Trees (CART), introduced by Breiman et al. (1984), is a method to model a response variable (y) which can be either categorical (classification trees) or numeric (regression trees) as a function of explanatory variables, x. The relationship between y and x is constructed by repeatedly splitting the explanatory variable(s) x according to rules to form a binary tree T and evaluating the model for the subset of data defined by each split. The hypothesis space of decision/regression trees is the set of piecewise constant functions h (.) defined on the input space by:
1 1
2 2
if
if
( ) ,
if
L L
h a R
h a R
h a
h a R
where Ri, …, RL is a recursive partition of the input space into T regions and h is the constant prediction associated to each region Ri (a class or a number).
In order to represent the structure of the recursive partition and how it is defined in terms of the input attributes, a decision tree structure is used. Each interior node of such a tree is labeled with a test defined as a function of the attribute values and each terminal node defines a region R. To find the region associated to a point a, it is sufficient to propagate it into the tree according to test issues until it reaches a terminal node. Each region Ri is thus described by a sequence of tests and the whole tree simply translates into a set of "IF ... THEN ..." rules.
In this research, inducing regression trees is performed on all clusters of datasets. The construction is applied in the two distinct steps. In the first step, while in the growing phase, when establishing top down method, the tree is constructed from splitting the nodes in a recursive manner. In the second step, while in the pruning phase, when establishing the bottom up method, the tree by eliminating the irrelevant branches is pruned i.e. by removing the subsequent nodes, a node to a leaf is transformed. This is done during of the second step where it tried to choose the best performing tree. It should be noted that, with the growing set and pruning set, the aim of regression tree is to search and find the optimal tree on the pruning set.
Algorithm 1 EM Algorithm.
Initialize: Initialize means and variances of the model
(0) (0) (0)
{ j , , j }
j
.Step 1. Expectation: Using the estimates of
( ) ( ) ( ) ( )
{ , t , },
t t t
j j j
parameters compute the estimate of wij( ) ( ) ( ) ( ) ( ) ( ) 1 ( | , ) ( | , ) ( | , ) t t
j i i
t t
ij i k t t
m i i
m
p x z j
w p z j x
p x z k
Step 2. Maximization: Using estimates of
w
ij( )i , update the estimates of the model parameters( )
( )
( )
( )
( )
( 1) 1
1
2
( 1) 1
1 ( 1) 1 || || 1 t t t t t N ij i t i j N ij i N
ij i i
t i j N ij i N t i ij i w x w w x w w N
Step 3. Check for convergence: This can be performed based on convergence of the parameters or on the log likelihood function. If the convergence criterion is not satisfied return to Step 1.
5. Recommendation Method Evaluation
Yahoo Movies: The rating data was taken from the Yahoo Movies website. All the movies were treated as single-rating dataset made available from Yahoo! Research. Around the Yahoo Movies platform, in this case users can rate movies in 4 dimensions which include, Story, Acting, Direction, Visuals, as well as assign a general rating. A 13-level rating scale (from A+ to F) can be used. The 4 characteristics considered for movies are: c1=Acting, c2=Directing, c3=Story and c4=Visual. In this case, for measuring the overall values with qualitative scale 1 to 13 were considered in which F is identifying the worst assessment grade along with A+ proclaiming the most popular value. For analyzing reasons, in this research the letters of any criteria and overall ratings should be changed to numbers, in order that 1 corresponded with the worst value, formerly implies as F and 13 to cost effective, A+. Additionally, the user global perception (overall rating) provided by user was considered values with qualitative scale 1 to 13 for each movie. Data cleaning which basically is next after the data gathering stage which basically is to get rid of any situation with a minimum of one or even more unavailable values. This introduced 15% shrinkage within the overall data set. A filter is subsequently used to reduce the users with under five ranked movies was applied, in order to be sure that a sufficient group of examined movies for each user. Consequently, the resulting experimental data set had 8047 users and in 6032 various movies. The entire quantity of ratings was 65534 and 98% users had rated about 10 movies normally. The averages of evaluation ratings by users were 9.96, 9.67, 9.76, 9.90 and 9.72 for the Acting, Directing, Story, and Visual respectively.
TripAdvisor: TripAdvisor represents the world largest and most successful social networking and community site in tourism (Nilashi et al., 2015b). The platform facilitates the reviewing of hotels around the world and brings together individuals in discussion forums and provides users with independent travel reviews and comments. In TripAdvisor website users can rate a hotel according to 7 different dimensions: Value aspect, Rooms aspect, Location aspect, Cleanliness aspect, Check in/front desk aspect, Service aspect and Business Service aspect. In addition, users provide overall ratings on hotels. Ratings ranges from 0 to 5 stars, and -1 indicates this aspect rating is missing in the original html file. In this research the dataset of TripAdvisor includes 28500 ratings.
To evaluate the accuracy of the proposed method, we conduct a set of experiments. We determine the precision and recall of the Top-N list for recommender system. The recommenders’ prediction accuracy is measured by Root Mean Squared Error (RMSE), which is a widely used metric for evaluating the statistical accuracy of recommendation algorithms, given by
, | | | | 1 , 2
j iou aij pij
where = { (ui,oj)|uihad rated oj in the probe set }. A lower value of RMSE indicates a higher accuracy of the recommendation system.
Table 1 presents the RMSE and coverage obtained from proposed approach on Yahoo!Movie and TripAdvisor datasets.
We also evaluated the recommendation quality using coverage measures. Coverage measures the percentage of items for which a CF system can provide a prediction, or that ever appear in a recommendation list.
To compare the proposed method with some stat-of-the-art approaches in multi-criteria CF, we employed precision metric, which is a metric that represents the probability that an item recommended as relevant is truly relevant. It is defined as the ratio of items correctly predicted as relevant among all the items selected:
FR TR
TR
Precision (8)
where TR is the number of true relevant predictions, i.e., the number of items recommended as relevant that are really relevant, and FR is the number of false relevant predictions, i.e., the number of items recommended as relevant that are non-relevant.
We also evaluated our approach on the Yahoo!Movies and TripAdvisor datasets using an additional set of metrics. The MAE is determined as the average absolute deviation between predicted ratings and true ratings shown in Eq. (9).
N i
i u i u
N act pred act
pred MAE
1
, , )
,
( (9)
where N is the number of items on which a user u has expressed an opinion.
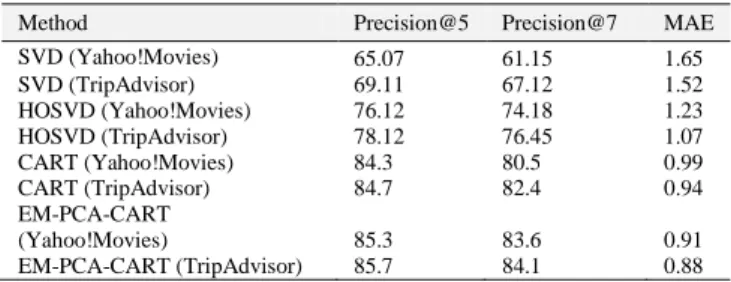
In Table 2, we report Precision@5 and Precision@7 values as well as the Mean Absolute Error (MAE) for MAE of all implemented methods.
From the results, we can find that the precision at Top-5 and Top-7 of the proposed method outperforms SVD and HOSVD methods. From the results, it can be also found that the proposed method outperforms the methods which solely use CART.
Table 1
Coverage and RMSE
Method RMSE Coverage
SVD (Yahoo!Movies) 0.773 0.71 SVD (TripAdvisor) 0.736 0.82 HOSVD (Yahoo!Movies) 0.614 1 HOSVD (TripAdvisor) 0.594 1 CART (Yahoo!Movies) 0.565 1 CART (TripAdvisor) 0.536 1 EM-PCA-CART (Yahoo!Movies) 0.507 1 EM-PCA-CART (TripAdvisor) 0.483 1
Table 2
MAE, precision at Top-5 and Top-7
Method Precision@5 Precision@7 MAE SVD (Yahoo!Movies) 65.07 61.15 1.65 SVD (TripAdvisor) 69.11 67.12 1.52 HOSVD (Yahoo!Movies) 76.12 74.18 1.23 HOSVD (TripAdvisor) 78.12 76.45 1.07 CART (Yahoo!Movies) 84.3 80.5 0.99 CART (TripAdvisor) 84.7 82.4 0.94 EM-PCA-CART
(Yahoo!Movies) 85.3 83.6 0.91 EM-PCA-CART (TripAdvisor) 85.7 84.1 0.88
6. Conclusion
In this paper, a new recommendation method was proposed using regression and clustering techniques to improve the predictive accuracy of the multi-criteria CF. The proposed method was developed based on EM and CART for items recommendations to users. We analyzed the predictive accuracy of proposed methods in the domain of movie recommendation in a real-world dataset provided by Yahoo!Movies and TripAdvisor datasets. The methods were evaluated using MAE, Precision@5 and Precision@7 using precision metric. Our experiments confirmed that the proposed recommendation method significantly improves predictive accuracy of multi-criteria CF measured by standard accuracy metrics. For the future work, we plan to investigate clustering ensemble techniques with dynamic process for scalability issue in the context of multi-criteria CF. We will focus on further improvement of the multi-criteria CF recommendation accuracy and scalability for by incorporating incremental approaches.
References
Adomavicius G, Kwon Y (2007) New recommendation techniques for multicriteria rating systems. Intelligent Systems, IEEE 22 (3):48-55
Adomavicius, G., & Tuzhilin, A. (2005). Toward the next generation of recommender systems: A survey of the state-of-the-art and possible extensions. IEEE transactions on knowledge and data engineering, 17(6), 734-749.
Bagherifard, K. B., Nilashi, M., & Salim, N. (2013). Recommender system based on semantic similarity. International Journal of Electrical and Computer Engineering, 3(6), 751.
Bilge, A., & Polat, H. (2013). A comparison of clustering-based privacy-preserving collaborative filtering schemes. Applied Soft Computing, 13(5), 2478-2489.
Breese, J. S., Heckerman, D., & Kadie, C. (1998, July). Empirical analysis of predictive algorithms for collaborative filtering. In Proceedings of the Fourteenth conference on Uncertainty in artificial intelligence (pp. 43-52). Morgan Kaufmann Publishers Inc..
Breiman, L., Friedman, J., Stone, C. J., & Olshen, R. A. (1984).Classification and regression trees. CRC press. Deshpande, M., & Karypis, G. (2004). Item-based top-n
recommendation algorithms. ACM Transactions on Information Systems (TOIS), 22(1), 143-177.
Farokhi, N., Vahid, M., Nilashi, M., & Ibrahim, O. (2016). A Multi-Criteria Recommender System for Tourism Using Fuzzy Approach. Journal of Soft Computing and Decision Support Systems, 3(4), 19-29.
scalability of recommender systems by clustering using genetic algorithms. In International conference on artificial neural networks (pp. 442-449). Springer Berlin Heidelberg.
Goldberg, K., Roeder, T., Gupta, D., & Perkins, C. (2001). Eigentaste: A constant time collaborative filtering algorithm. Information Retrieval, 4(2), 133-151.
Jannach D, Karakaya Z, Gedikli F Accuracy improvements for multi-criteria recommender systems. In: Proceedings of the 13th ACM Conference on Electronic Commerce, 2012. ACM, pp 674-689
Jung, Y. G., Kang, M. S., & Heo, J. (2014). Clustering performance comparison using K-means and expectation maximization algorithms. Biotechnology & Biotechnological Equipment, 28(sup1), S44-S48.
Konstan, J. A., Miller, B. N., Maltz, D., Herlocker, J. L., Gordon, L. R., & Riedl, J. (1997). GroupLens: applying collaborative filtering to Usenet news.Communications of the ACM, 40(3), 77-87.
Li Q, Wang C, Geng G Improving personalized services in mobile commerce by a novel multicriteria rating approach. In: Proceeding of the 17th international conference on World Wide Web, 2008. pp 1235-1236
Liu L, Mehandjiev N, Xu D-L Multi-criteria service recommendation based on user criteria preferences. In: Proceedings of the fifth ACM conference on Recommender systems, 2011. ACM, pp 77-84
Manouselis N, Costopoulou C (2007) Experimental analysis of design choices in multiattribute utility collaborative filtering. International Journal of Pattern Recognition and Artificial Intelligence 21 (02):311-331
Mitra, P., Pal, S. K., & Siddiqi, M. A. (2003). Non-convex clustering using expectation maximization algorithm with rough set initialization. Pattern Recognition Letters, 24(6), 863-873.
Nilashi, M., Bagherifard, K., Ibrahim, O., Alizadeh, H., Nojeem, L. A., & Roozegar, N. (2013). Collaborative filtering recommender systems. Research Journal of Applied Sciences, Engineering and Technology, 5, 4168-4182.
Nilashi, M., bin Ibrahim, O., & Ithnin, N. (2014a). Hybrid recommendation approaches for multi-criteria collaborative filtering. Expert Systems with Applications, 41(8), 3879-3900. Nilashi, M., bin Ibrahim, O., & Ithnin, N. (2014b). Multi-criteria
collaborative filtering with high accuracy using higher order singular value decomposition and Neuro-Fuzzy system. Knowledge-Based Systems, 60, 82-101.
Nilashi, M., Ibrahim, O. B., Ithnin, N., & Zakaria, R. (2015b). A multi-criteria recommendation system using dimensionality reduction and Neuro-Fuzzy techniques. Soft Computing, 19(11), 3173-3207.
Nilashi, M., Jannach, D., bin Ibrahim, O., & Ithnin, N. (2015a). Clustering-and regression-based multi-criteria collaborative filtering with incremental updates. Information Sciences, 293, 235-250.
Ordonez, C., & Omiecinski, E. (2002, November). FREM: fast and robust EM clustering for large data sets. In Proceedings of the eleventh international conference on Information and knowledge management (pp. 590-599). ACM.
Park, Y. J., & Chang, K. N. (2009). Individual and group behavior-based customer profile model for personalized product recommendation. Expert Systems with Applications, 36(2), 1932-1939.
Pazzani, M. J. (1999). A framework for collaborative, content-based and demographic filtering. Artificial Intelligence Review, 13(5-6), 393-408.
Rennie, J. D., & Srebro, N. (2005, August). Fast maximum margin matrix factorization for collaborative prediction. In Proceedings of the 22nd international conference on Machine learning (pp. 713-719). ACM.
Sahoo N, Krishnan, R., Duncan, G., & Callan, J. (2011). Research
Note—The Halo Effect in Multicomponent Ratings and Its Implications for Recommender Systems: The Case of Yahoo! Movies. Information Systems Research, 23(1), 231-246. Sahoo N, Krishnan, R., Duncan, G., & Callan, J. P. (2006).
Collaborative filtering with multi-component rating for recommender systems. In Proceedings of the Sixteenth Workshop on Information Technologies and Systems. Sarwar, B., Karypis, G., Konstan, J., & Riedl, J. (2001, April).
Item-based collaborative filtering recommendation algorithms. In Proceedings of the 10th international conference on World Wide Web (pp. 285-295). ACM.
Symeonidis, P., Nanopoulos, A., & Manolopoulos, Y. (2008, October). Tag recommendations based on tensor dimensionality reduction. In Proceedings of the 2008 ACM conference on Recommender systems (pp. 43-50). ACM. Chicago
Tsai, C. F., & Hung, C. (2012). Cluster ensembles in collaborative filtering recommendation. Applied Soft Computing, 12(4), 1417-1425.