Investigation of Dispersive Kinetics in the Time-dependent Photoluminescence of Dye-sensitized Nanoparticle Films
Ian James McNeil
A dissertation submitted to the faculty of the University of North Carolina at Chapel Hill in partial fulfillment of the requirements for the degree of Doctor of Philosophy in the
Department of Chemistry.
Chapel Hill 2013
Approved by:
John Papanikolas
Christopher Fecko
Andrew Moran
Edward Samulski
iii ABSTRACT
Ian James McNeil: Investigation of Dispersive Kinetics in the Time-dependent Photoluminescence of Dye-sensitized Nanoparticle Films
(Under the direction of Christopher Fecko)
Mesoporous titanium dioxide nanoparticle films sensitized with ruthenium polypyridal chromophores provide the main architectural framework of dye-sensitized solar cells. The design of these systems is based on the interfacial photoinduced charge separation that occurs when an excited chromophore transfers an electron to acceptor states within the semiconductor material. This process is also called electron injection. If electron injection cannot occur, the excited chromophore can relax through the emission of a photon. Therefore, observing the time-dependent photoluminescence decay of these systems can provide insight on the efficiency of the electron transfer process.
This dissertation investigates the dependence of the time-dependent photoluminescence decay on various factors using time-correlated single photon counting techniques with a home-built two-photon laser scanning setup. Interestingly, the time-dependent photoluminescence follows power-law kinetics when electron injection is most efficient. Power-law kinetics are a specific type of dispersive kinetics and several other dispersive kinetic models are also examined in this work.
iv
however, is there an observed unquenched, purely emissive population. It is suggested that cross-surface energy transfer provides an alternative route for excited state relaxation.
v
vi
ACKNOWLEDGEMENTS
There have been many people who have encouraged and assisted me throughout my life and I am grateful for such a large support network. Specifically my friends and family from the 4-H program have been there for me whenever I needed encouragement, advice, or someone to share my accomplishments. So many hardships were overcome by the heartening words of a 4-H friend.
While most people remember high school educators as the ones who ignited the spark of learning, I was blessed to have an exceptional elementary school education. All of my teachers at Glade Creek Elementary- from kindergarten to 6th grade- saw my potential and provided me with a strong foundation for future learning. They continue to be invested in my success even to this day. However, my specific science interests were developed at Bridgewater College under the guidance of Dr. Kenneth Overway. His organized teaching skills and passion for science along with his earnest concern for his students fostered an environment where discovering scientific research was an enriching process.
vii
scientific literature. But most of all, I appreciate his concern for me as a human being. Throughout my graduate studies, he pushed me to be a greater scientist but never at the sake of my well-being and happiness.
I owe much gratitude to the other members of the Fecko group. Lori Dorward and Asima Chakraborty took me under their wings my first few years and made my transition to graduate school an easy one. Working with Matthew Daddysman and Michael Tycon has been an honor and I have learned much- both about science and life in general- through daily interactions with them.
I must also thank the many gifted scientists who were my fellow teammates in the various teams I’ve been involved with within the Energy Frontier Research Center. The
viii
TABLE OF CONENTS
LIST OF TABLES ... xii
LIST OF FIGURES ... xiii
LIST OF ABBREVIATIONS ... xvii
CHAPTER 1. Introduction...1
1.1. Motivation for developing solar energy technologies ... 1
1.2. Dye-Sensitized Solar Cells ... 3
1.3. The importance and relationship of the semiconductor and the dye ... 4
1.4. Excited state decay kinetics and dispersive kinetics ... 6
1.5. Interfacial charge transfer kinetics ... 8
1.6. Layout of Dissertation ... 9
REFERENCES ... 11
CHAPTER 2. Materials and Methods ...14
2.1. Time-correlated single photon counting (TCSPC) laser scanning setup ... 14
2.2. Electrochemical measurements ... 19
2.3. Sample Preparations ... 20
2.4. Data Fitting procedure ... 21
REFERENCES ... 23
CHAPTER 3 . Power-Law Kinetics in the Photoluminescence of Dye-Sensitized Nanoparticle Films: Implications for Electron Injection and Charge Transport ...24
3.1. Introduction ... 24
3.2. Material and Methods... 26
3.2. A. Optical setup for TCSPC measurements ...26
ix
3.2. C. Modification of optical setup for TCSPC with sub-nanosecond time
resolution...28
3.2. D. Modification of optical setup for TCSPC with laser-scanning excitation ...29
3.2. E. TCSPC data analysis ...29
3.2. F. Sample preparation ...30
3.2. G. Photoluminescence quantum yield measurements ...31
3.3. Results ... 32
3.3.A. Time-dependent photoluminescence of RuP bound to nanocrystalline TiO2 exhibits a power-law decay ...32
3.3.B. Power-law decay occurs at high H+ or Li+ concentrations in water or acetonitrile....33
3.3.C. Chromophore photoluminescence also exhibits power-law decay after one-photon excitation...37
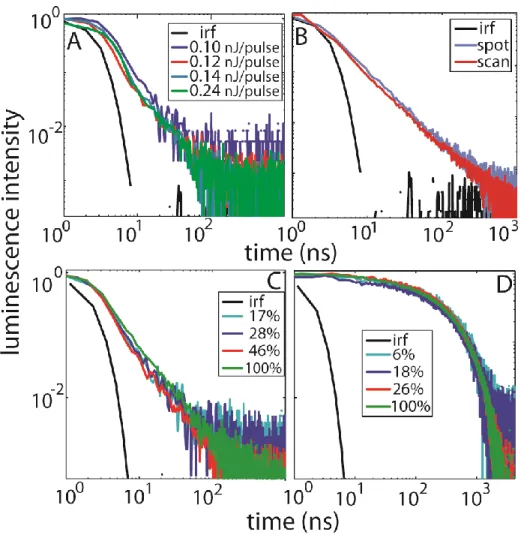
3.3.D. Time-dependent emission is independent of power, not due to local charge accumulation, and is unaffected by dye loading ...41
3.3.E. Distribution of photoluminescence decay time constants broadens in addition to decreasing with increasing electrolyte concentration ...44
3.3. F. Absolute photoluminescence quantum yield measurements on TiO2 ...49
3.4. Discussion ... 53
3.4.A. Necessity of two-photon excitation scheme. ...53
3.4.B. Origin of highly dispersive kinetics ...54
3.4. C. Implications for DSPECs ...59
3.5. Conclusion ... 60
REFERENCES ... 62
CHAPTER 4. Investigation of factors that affect the distribution of excited state lifetimes of dye-sensitized nanoparticle films ...69
4.1. Introduction ... 69
4.2. Materials and Methods: ... 71
x
4.2.B. Optical Setup for Spectroelectrochemical Measurements ...73
4.2.C. TCSPC Data Analysis ...73
4.2.D. Sample Preparation ...76
4.3. Results ... 77
4.3.A. Chemical additives influence the distribution of excited state lifetimes ...77
4.3.B. Applied bias influences distribution of excited state lifetimes ...83
4.3.C. The characteristic excited state lifetime and the amount of dispersion in the distribution are correlated ...84
4.4. Discussion ... 91
4.4.A. Expanding parameter space to explore the entire realm of injection kinetics ...91
4.4.B. Exploring dispersive kinetics through the addition of potential determining ions...91
4.4.C. Influencing the dispersive kinetics by raising the Fermi level with applied bias ...93
4.4.D. Significance of the correlated characteristic excited state lifetime and amount of dispersion in the distribution ...96
4.5. Conclusion ... 98
REFERENCES ... 100
CHAPTER 5. Influence of Cross-Surface energy transfer on time-dependent photoluminescence of sensitized nanocrystalline semiconductor films. ...108
5.1. Introduction: ... 108
5.2. Experimental section ... 111
5.3. Results ... 113
5.3.A. Load dependence in moderate injection regime ...113
5.3.B. Analysis of the time-dependent emission spectral shift...115
5.3.C Franck-Condon analysis of time-dependent emission spectra ...118
xi
Appendix 1. Calculations for number of excited dyes per nanoparticle per pulse ... 131
Appendix 2. Dispersive kinetics models ... 132
Appendix 2.A. Homogeneous first-order injection kinetics ...132
Appendix 2.B. Albery model...133
Appendix 2.C. Kohlrausch-Williams-Watts (KWW) model ...134
Appendix 2.D. Power-Law model ...135
Appendix 3. Fitting procedure for Chapter 5. ... 136
xii
LIST OF TABLES
Table 3.1: Best fit dispersive kinetic model parameters for aqueous measurements ... 47
Table 3.2: Best fit dispersive kinetic model parameters for measurements in
acetonitrile...48
Table 4.1: Best fit stretched exponential model parameters for chemical additive
experiments ... 81
Table 4.2: Best fit stretched exponential model parameters for electrochemical
experiments ... 87
xiii
LIST OF FIGURES
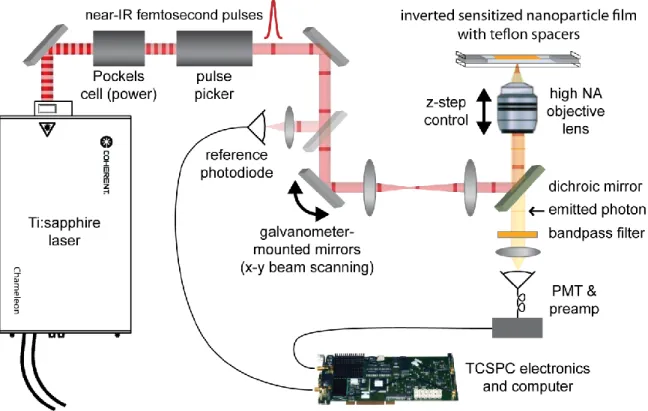
Figure 2.1: Two-photon laser scanning TCSPC setup ... 16
Figure 3.1: Time-dependent photoluminescence decay curves for RuP sensitized TiO2 and ZrO2 plotted on a linear scale (A), a semilogarithmic scale (B), and a double logarithmic scale (C). The semilog plot demonstrates that emission of the sensitized ZrO2 film decays with an exponential time dependence. The emission from sensitized TiO2 film is quenched due to electron injection. The double logarithmic plot
demonstrates that emission of the sensitzed TiO2 film decays with a power-law time dependence ... 34
Figure 3.2: Lowering the conduction band energy of TiO2 leads to a power-law decay. The pH dependence of the emission decay in water is plotted on a semilogarithmic (A) and double logarithmic scale (B). The emission’s lithium ion concentration dependence in acetonitrile is plotted similarly (C,D). The plots of 0 M, 0.1 mM, and 1mM Li+ are nearly indistinguishable. Both scenarios demonstrate that as the conduction band energy level is lowered, the emission smoothly transitions to a dispersive exponential decay to a power-law decay. Comparing the decay of the sensitized TiO2 film in both the pH 1 in acetonitrile to 1.0 M Li+ in acetonitrile (E) show that this behavior is independent of solution. The combined effect of added lithium ions in an acidic pH 1 aqueous solution shows no further influence on the decay profile (F) ... 36
Figure 3.3: Time-dependent emission of TiO2-RuP in pH1 aqueous solution with
increased time resolution from replacing the digital delay with a cable delay showing that the emission from earlier times still follows power-law kinetics. ... 38
Figure 3.4: Emission decay is not dependent on excitation scheme. One-photon and two-photon excitation of the same sensitized TiO2 film showed similar decays in
acetonitrile (A). However in water, the two excitation schemes show different lifetimes plotted on a semilogarithmic plot (B) and double logarithmic plot (C). The long time component from the one-photon excited film in water was determined to be due to freely diffusing dye molecules that dissociated from the surface. ... 40
xiv
loadings calculated from absorbance measurements and relative to data obtained from overnight soaking. ... 42
Figure 3.6: Basis of kinetic models used to fit time-dependent photoluminescence decay data. The simple exponential model has a well defined barrier height G† (A). The Albery Model assumes a Gaussian distribution of barrier heights (B). The KWW model is comparable to the Albery model, but with an asymmetric distribution (C). The power-law model has a most probable value that falls off exponentially (D). ... 45
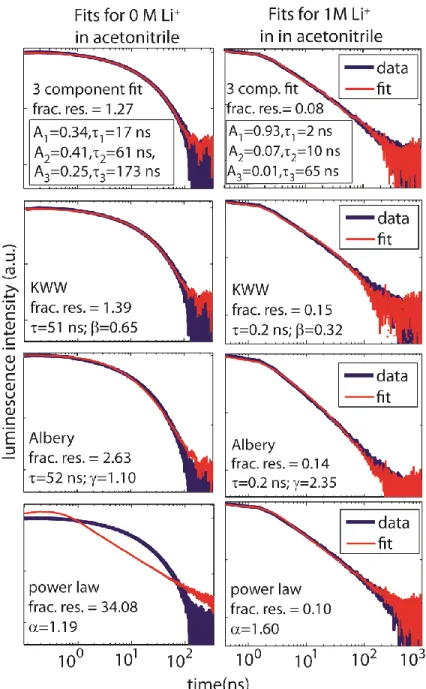
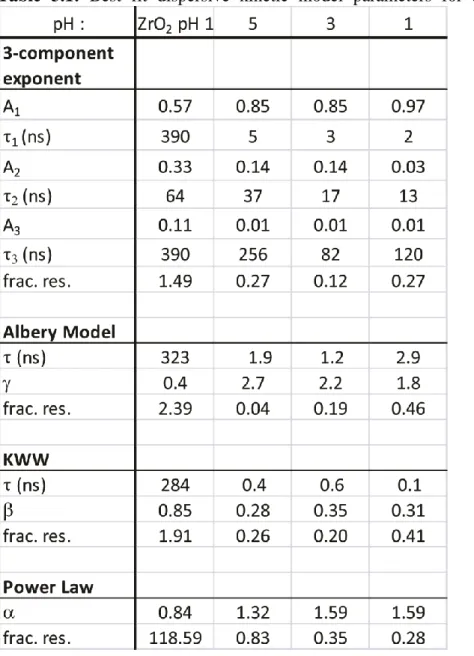
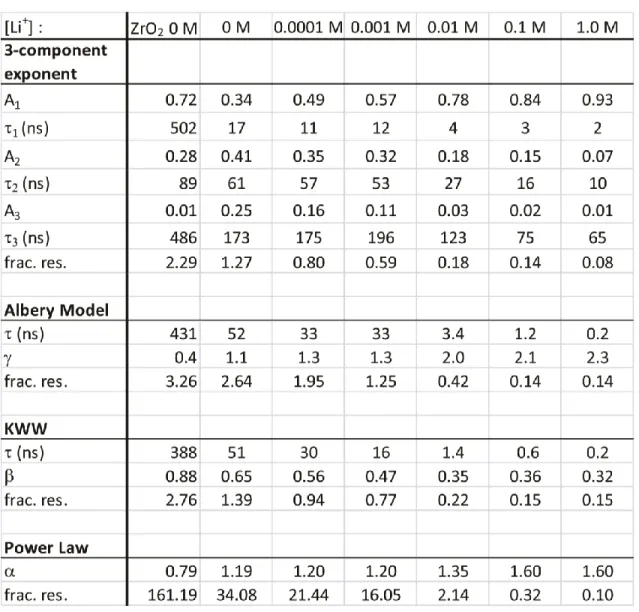
Figure 3.7: Fits for data of TiO2 film in acetonitrile for 0 M (left column) and 1.0 M (right column) Li+ with the four models: tri-exponential, KWW, Albery, and a power law The first three models fit the data well, while the power-law model only fits the data from the highest ionic concentration. Fractional residuals (frac. res.) determine goodness of fit according to Eq. 3.1; the fitting functions and parameters are defined in the Appendix 2. ...46
Figure 3.8: Shifting the conduction band energy increases the electron injection rate but also causes a change in the distribution of rates. Using the parameters of the best fits, the distribution of tau values for each Li+ concentration in acetonitrile are plotted (A). The shaded area represents times that are within the instrument response. As the Li+
concentration increases the maximum of the KWW distribution shifts to lower times (B) and the width of the distribution increases, as evident by the decrease in the stretching parameter (C). ... 50
Figure 3.9: Absolute and relative photoluminescence emission quantum yield measurements of TiO2-RuP and ZrO2-RuP films in acetonitrile. The relative measurements, taken due to the quenched emission on TiO2, compare well with the absolute value and possess less error. The emission is quenched 5-fold on TiO2
compared to ZrO2 and is further quenched 10-fold in a 1.0 M Li+ solution. ... 52
Figure 4.1: Cyclic voltammagram of an unsensitized TiO2 film in 100mM TBA with a ferrocene internal standard. The redox potential of ferrocene with respect to our
Ag/AgNO3 reference electrode is 82 mV. ... 75
Figure 4.2: Concentration dependence of chemical additives on the time-dependent photoluminescence of RuP-sensitized TiO2 films. (A and B) The addition of lithium quenches emission; power law decay in time is observed for the highest lithium
xv
Figure 4.3: Analysis of the concentration dependence of chemical additives on the time-dependent photoluminescence of RuP-sensitized TiO2 films. (A and B)
Photoluminescence decay curves in Figure 4.1 were fit with a stretched exponential providing two concentration-dependent parameters: the characteristic excited state lifetime, , and the stretching parameter, . (C) The distribution of excited state lifetimes determined by Laplace transform of the stretched exponential fits as described in the text. ... 82
Figure 4.4: Photoelectrochemical measurements on RuP-sensitized TiO2 nanoparticle film. (A) Cyclic voltamagram of the sensitized TiO2 nanoparticle film in 100mM TBA (sensitized TiO2 working electrode, Ag/AgNO3 reference, and Pt counter) showing the redox couple of the ruthenium chromophore at high positive potentials and the reduction of TiO2 at highly negative potentials. (B and C) The time-resolved photoluminescence is unaffected by a positive bias up to 800 mV in either a 100mM Li+ solution (B) or a 100 mM TBA solution (C). ... 85
Figure 4.5: Time-resolved photoluminescence of RuP-sensitized TiO2 films under negative bias in 100 mM Li+ (A and B) and 100m M TBA (C) acetonitrile solutions (Ag/AgNO3 reference and Pt counter). ... 86
Figure 4.6: Analysis of the effects of applied electric bias on the time-dependent photoluminescence of RuP-sensitized TiO2 films. (A and B) Photoluminescence decay curves in Figures 4.2 and 4.3 were fit with a stretched exponential to determine the characteristic excited state lifetime, , and the stretching parameter, . (C) The
distribution of excited state lifetimes determined by Laplace transform of the stretched exponential fits. ... 88
Figure 4.7: Scatter plots of best-fit and values demonstrate that the values of these parameters are correlated for both the addition of chemical additives (A) and application of electric potentials (B). The correlation coefficients are 0.93 and 0.92 respectively. A direct comparison of scatter plots obtained for chemical additive experiments and
electrochemical measurements, which exhibit a nearly identical relationship (C). ... 90
xvi
Figure 5.1: (A and B) Load Dependence of RuP on a TiO2 nanoparticle film in neat acetonitrile suggests evidence for cross-surface energy transfer. Relative coverage was determined by measuring the absorbance at 450 nm. An overnight sensitization
procedure was assumed to be a 100% coverage. (C) The time-dependent emission of the most dilute loading is nearly identical to the exponential decay of free (unbound) RuP in acetonitrile solution. ... 114
Figure 5.2: Spectral Mapping of the time-dependent emission of RuP on a ZrO2
nanoparticle film in neat acetonitrile (A and B) and 100mM Li+ in acetonitrile (C and D) provides further evidence or cross-surface energy transfer or injection from high energy sites into deep trap states. (A and C) Normalized TCSPC curves show the quenching of the emission from higher wavelengths. (B and D) The integrated count of normalized TCSPC curves are corrected to match the emission profile of RuP on ZrO2. ... 117
Figure 5.3: Spectral Mapping of RuP on TiO2 in neat acetonitrile (A and B) and in a 100mM Li+ acetonitrile solution (C-F) also shows influence from cross-surface energy transfer. (A and C) The normalized TCSPC curves show the quenching of the higher energy emission. (B and D) The integrated count of the normalized TCPSC curves were corrected to match the emission profile of RuP on TiO2. (E and F) The normalized and corrected plots for RuP on TiO2, plotted on a semilogarithmic plot show power-law behavior for every emission wavelength. ... 120
Figure 5.4: Fits from Eq 5.2. of the time-dependent emission profile of RuP on ZrO2 (A -D) and TiO2 (E-F) in neat acetonitrile (A,B,E,F) and 100mM Li+ acetonitrile (C,D,G,H) show how the emission profile changes over time. (A,C,E,G) Non-normalized cuves show Emax shifting towards lower wavelengths over time in all cases. (B,D,F,H) Normalized cuves also show the shifting Emax, but also indicates a widening of the
emission profile for the TiO2 in neat acetonitrile case (F). ... 121
Figure 5.5: The shift in Emax over time for RuP on ZrO2 (A and B) and TiO2 (C and D) are fit with a single exponential recovery with an offset. Note the time axis in panel (D) is different from the others. The recovery on ZrO2 in both neat acetonitrile (A) and 100mM Li+ acetonitrile (B) show slow recovery (204 ns and 308 ns respectively). The recovery on TiO2 in neat acetonitrile (C) shows a shorter recovery (93 ns) while the recovery on TiO2 in 100mM Li+ acetonitrile (D) shows the quickest recovery (30ns). . 122
xvii
LIST OF ABBREVIATIONS ADC analog to digital converter
BBO -barium borate
BET back electron transfer
CFD constant-fraction discriminator
DSPEC dye-sensitized photoelectrosynthetic cell DSSC dye-sensitized solar cell
FTO fluorine doped tin oxide frac. res. fractional residual FWHM full-width at half max GaAsP Gallium Arsenite Phosphate HOMO highest occupied molecular orbital KDP potassium dyhydrogen phosphate KWW Kohlrausch William Watts
LUMO lowest occupied molecular orbital NA numerical apperature
PMT photomultipling tube
RuP [(Ru(bpy)2(4,4’-(PO3H2)2bpy)]2+ TA transient absorption
TAC time to amplitude converter TBA tetrabutylammonium tBp 4-tert-butylpyridine
xviii
LIST OF SYMBOLS
A absorptivity
A amplitude
disorder parameter
stretching parameter
c(t) time-dependent concentration of excited state cA(t) time-dependent concentration for Albery Model ckww(t) time dependent concentration for KWW model cPL(t) time-dependent concentration for power-law model D* dye excited state
D+ oxidized dye
E Energy
E*dye excited state energy level of the chromophore f(E,EF) Fermi occupation at Energy E
G† activation barrier
Go† minimum activation barrier
gamma distributrion
g(E) density of TiO2 states
gA(k) log-normal rate constant distribution gkww(k) Levy stable distribution function
gPL(k) distribution of rate constants for power-law model
magnitude of the energetic dispersion
xix k’ observed rate of excited state decay
kB Boltzmann constant kem rate of photon emission kinj rate of electron injection kinjection rate of electron injection knr nonradiative rate constant ko barrierless rate constant kr radiative rate constant
kwwt rate constant from KWW model
I intensity
JSC short circuit current
La excitation wavelength count in sample-free solvent
reorganizational energy for electron injection
pA(x) normalized distribution Pb indirect emission intensity Pc direct emission intenisty pPL(x) exponential distribution
quantum yield
R gas constant
r Pearson product moment correlation coefficient
t time
characteristic lifetime
xx
range of characteristic times
<> average characteristic time
CHAPTER 1. Introduction 1.1. Motivation for developing solar energy technologies
Due to the increased global demand of energy coupled with the concern of increased carbon dioxide concentrations in our atmosphere from the burning of fossil fuels, solar energy is a desirable resource that has yet to be efficiently utilized. It was estimated that earth consumed 15 TW of energy in 2008, and it has been projected that earth’s energy consumption will double by 2050.1,2
This energy gap can be overcome by tapping into the immense energy (89,300 TW) that reaches the earth from the sun.2 However, currently solar technologies only make up a small percentage of the sources of energy that we consume.3
Some current solar technologies utilize the photoelectric effect to convert sunlight into electricity. The energy from a photon from the sun is used to excite an electron in a semiconductor material that can be extracted and used for electricity. The most familiar solar cell technology is the crystalline silicon solar cell. The ultrapure crystalline silicon in these solar cells absorbs photons from the sun and conducts the excited electrons for use as electricity. The problem with this technology is that the ultrapure crystalline silicon is expensive to produce and the lifetime of these delicate cells is not long enough to compensate for the cost.4
2
technologies, organic photovoltaics, as well as dye-sensitized solar cells.5-7 While these technologies have lower efficiencies than the crystalline solar cell devises, their low costs will hopefully be able to compensate. While this achievement has yet to occur, they have become increasingly more efficient over the past few decades.8 Further research to improve the efficiencies of these devices may finally allow for solar technologies to economically compete with other energy sources.
This work focuses on one of these alternative approaches, the dye-sensitized solar cell, and aims at characterizing the different kinetic process that occur in transforming light into electricity. These different kinetic processes must occur in timescales in conjunction with one other. The process of directing an electron towards an electrode must be quicker than the detrimental processes that lead to the decay of the excited state. Therefore, it is beneficial to understand what kinetically drives these processes and how environmental factors influence the timescales of these events.
3 1.2. Dye-Sensitized Solar Cells
The semiconductor most often used in current solar harvesting devices is ultrapure crystalline silicon which is very expensive to produce. There is an interest to incorporate other, cheaper semiconductors. One of these semiconductors is titanium dioxide (TiO2), which is a cheap and abundant material often used as a white pigment in many every day materials. However, TiO2 has a wider bandgap than crystalline silicon and therefore only absorbs in the UV of the solar spectrum. To solve this problem, a sensitizer dye can be attached to the surface of the semiconductor where the
responsibilities of light absorption and charge transport are separately delegated to the dye and semiconductor respectively. In the simplistic model, an excited chromophore will transfer or “inject” an electron into the conduction band of the semiconductor.
However, since strong coupling is required between the dye molecule and the
semiconductor, only a monolayer of dye can be bound.14 This limits the amount of light that can be absorbed.
The solution that O’Reagan and Graetzel proposed to increase the amount of light
4
oxidized chromophore back to its ground state after it has been oxidized by electron transfer. The oxidized triiodide diffuses to the counter electrode where it is reduced back to iodide, which completes the circuit of the device. Therefore a DSSC is a completely regenerative device that, in theory, could be used indefinitely to transform solar energy into electricity.
1.3. The importance and relationship of the semiconductor and the dye
One of the main components of a DSSC is the semiconductor nanoparticle film. The semiconductor most often used in DSSC is TiO2 but others have been used including ZnO, SnO2, and Nb2O5.7 Semiconductors are used for solar harvesting devices due to the bandgap that exists between the valence band and conduction band. The electrons of a single atom possess a highest occupied molecular orbital (HOMO) and a lowest unoccupied molecular orbital (LUMO). If multiple atoms are in close proximity and interact with each other, the orbitals for each electron will split slightly so that with many atoms there exists a band of HOMOs called the valence band where electrons are tightly held to a specific atom, and a band of LUMOs called the conduction band where
5
energy is required to excite an electron into the conduction band and therefore determines the amount of energy an electron in the conduction band possesses that can be used for work. This is why TiO2 is an ideal candidate for use in solar harvesting devices because not only is it cheap and abundant, but it also has a wide bandgap of about 3.2 eV.
This wide bandgap however, poses a problem when you consider the solar spectrum. An ideal solar device should be able to absorb a majority of the solar spectrum. The amount of the solar spectrum a material can absorb is dependent on the bandgap. As mentioned earlier, the bandgap is the amount of energy needed to excite an electron from the valence band into the conduction band. If the light does not have enough energy to overcome this barrier, then that light is not absorbed. Therefore the bandgap determines the minimum energy, or maximum wavelength, that can be absorbed by the material. With TiO2’s 3.2 eV bandgap, it can absorb light with a wavelength of 387 nm or lower. This is a small portion of the solar spectrum. Most of the solar spectrum spans across the visible and even extends into the infrared.
6
The qualities of a good dye include efficient absorption over the solar spectrum, possessing an excited state above the conduction band of the metal oxide, long lived excited states, and photostability on the semiconductor surface. Much work has been done to improve the ability of the chromophore to absorb the solar spectrum. This has led to the development of the so-called “black” dye which is a polypyridal ruthenium chromophore that has a wide spectral response and is able to absorb far into the red visible spectrum.15 The series of polypyridal ruthenium chromophores have excited states above the conduction band edge of TiO2, making them viable for electron injection, but they also possess long lived excited states due to quick intersystem crossing from an intial singlet to long-lived triplet excited states. This increases the efficiency of devices because the longer the dye stays excited, the more probable the electron transfer will occur before the chromophore relaxes back to the ground state. Lastly the chromophore must be stably bound to the semicondoctor. The initial dye in Graetzel’s DSSC used a
carboxylate anchoring group. However it was shown that photodecomposition through loss of the carboxylated bipy-ligand occurred within only a few minutes of light
exposure.16 It has recently been shown that use of a phosphonated linker increases the chromophores photostability, especially in aqueous conditions.17 With all of these considerations in mind, the chromophore used in the experiments presented in this dissertation is a polypyridal ruthenium chromophore with a phosophonated bpy ligand (hereafter referred to as RuP).
1.4. Excited state decay kinetics and dispersive kinetics
7
does not occur, the time-dependent excited state chromophore population, c(t), relaxes through the emission of a photon following first order decay kinetics.
(1.1) where kem is the rate of photon emission. This process occurs with a well defined
lifetime, , given by
(1.2)
However when bound to the semiconductor with a conduction band edge lower than the excited state, the chromophore can also relax through electron injection. This nonradiative process competes with the emissive relaxation pathway and quenches the emission. Assuming injection also follows first-order kinetics with a well-defined rate (kinj), as it would if injection occurred directly from the excited chromophore into the conduction band, the excited state population would decay with an observed rate, k’, following eq. 1.3.
’ (1.3)
This current model for electron injection into semiconductors is based on theories proposed by Marcus and Gerischer.18,19 This model typically assumes that the chromophores are
strongly coupled to an energetic continuum of acceptor states in the conduction band of the
semiconductor. Marcus theory assumes a parabolic function with respect to the reaction
coordinate that is associated with the reorganization energy of the solvent surrounding the excited
chromophore. If the donor is strongly coupled to a sufficiently broad energetic continuum of
delocalized semiconductor acceptor states, a subset of these states will intersect with the
minimum of the donor parabola. In other words, there would be no barrier to electron transfer
from the chromophore to a subset of delocalized acceptor states in the continuum and the rate of
8
would inject with the same rate, the excited state would decay with monoexponential decay
kinetics.
As is predicted by the Marcus-Gerischer model and illustrated in equation 1.3, the excited state decay that occurs from the quenched emission due to electron injection should follow first order decay kinetics; however it will be shown later that the decay of these quenched systems is nonexponential. This discrepancy is likely due to the fact that there exist, within the bandgap, energetic trap sites caused by defects on the nanoparticle surface. The results presented in this dissertation support a model where injection occurs into these sub-bandgap sites, rather than the conduction band itself.
Instead of a single well-defined lifetime, the excited state population of our samples decays with a distribution of lifetimes. Kinetics that occur with a distribution of lifetimes are known as dispersive kinetics. It is desirable to know the shape of this distribution. While the real distribution may take an arbitrary form, it may be approximated by a well-defined functional form. The parameters that describe this functional form include the characteristic lifetime and the width of the distribution. The characteristic lifetime is the value where it is equally likely that a value within the distribution is greater than or less than the characteristic value.20 The width is a parameter that defines the extent of the dispersion in the measurement values.
Understanding the shape of the distribution provides physical information on why the distribution exists. Several models that define these parameters have been developed to describe dispersive kinetics and will be discussed in detail in Chapter 3.
1.5. Interfacial charge transfer kinetics
9
conduction band. Electron transfer can only happen if the conduction band edge falls below (away from vacuum) the excited state of the chromophore, and is faster the larger this difference. Various chemical additives have been used to adjust this difference by taking advantage of the Nernstian dependence of the TiO2 conduction band edge on effective pH.9,10,21-27 It has been shown that protons in acidic aqueous solutions shift the conduction band edge away from vacuum and lithium ions in acetonitrile solutions have similar effects. This is assumed to be due to electron accumulation caused by the presence of these small cations.28 While this increases the short circuit current (JSC), the lower conduction band edge also reduces the open circuit potential (VOC) which limits the overall device efficiency.29 Conversely, the molecule 4-tert-butylpyridine (tBp) binds to the surface of the semiconductor and has the opposite effect on this electron
accumulation and raises the conduction band edge. This raises the VOC but lowers
JSC.23,24,30 A careful compromise must be made to position the conduction band edge low enough to kinetically drive electron injection, but high enough to maximize the VOC allowing for optimal device performance. A demonstration of how the kinetics of interfacial charge transfer are influenced by the presence of these chemical additives will be discussed in Chapter 4 of this dissertation.
1.6. Layout of Dissertation
To help guide the reader through the material discussed in this dissertation, a brief overview will now be presented. The introductory chapter has provided the background and context for the work that is presented in the later chapters. In Chapter 2 I present detailed descriptions of the methods I used in the experiments performed and a
10
The next three chapters will present the results of the studies on the
time-dependent photoluminescence of the dye-sensitized nanoparticle film systems. Chapter 3 will present a study where the time-dependent photoluminescence decay possesses power law decay kinetics when electron injection is highly favored. Power-law decay kinetics are a type of dispersive kinetic model and this chapter will compare this kinetic model to other dispersive kinetic models. Chapter 4 will extend this study and
11 REFERENCES
1. Anonymous BP Statistical Review of World Energy June 2009. 2009.
2. Tsao, J.; Lewis, N.; Crabtree, G. Solar FAQ. US Department of Energy 2006.
3. Energy Information Administration. U.S. Department of Energy Renewable Energy Consumption and Electricity Preliminary Statistics 2008. 2009.
4. Allhoff, F.; Lin, P., Eds.; In Nanotechnology & Society: Current and Emerging Ethical Issues; Springer: New York, NY, 2008; , pp 299.
5. Aberle, A. G. Thin-film solar cells. Thin Solid Films 2009, 517, 4706-4710.
6. Kippelen, B.; Bredas, J. Organic photovoltaics. Energy Environ. Sci. 2009, 2, 251-261.
7. Hagfeldt, A.; Boschloo, G.; Sun, L.; Kloo, L.; Pettersson, H. Dye-Sensitized Solar Cells. Chem. Rev. 2010, 110, 6595-6663.
8. Anonymous Best Research-Cell Efficiencies.
http://www.nrel.gov/ncpv/images/efficiency_chart.jpg (accessed 05/27, 2013).
9. Koops, S. E.; O'Reagan, B. C.; Barnes, P. R. F.; Durrant, J. R. Parameters Influencing the Efficiency of Electron Injection in Dye-Sensitized Solar Cells. J. Am. Chem. Soc. 2009, 131, 4808-4818.
10. Bai, Y.; Zhang, J.; Wang, Y.; Zhang, M.; Wang, P. Lithium-Modulated Conduction Band Edge Shifts and Charge-Transfer Dynamics in Dye-Sensitized Solar Cells Based on Dicyanamide Ionic Liquid. Langmuir 2011, 27, 4749-4755.
12
12. Heimer, T. A.; Meyer, G. J. Luminescence of charge transfer sensitizers anchored to metal oxide nanoparticles. Journal of Luminescence 1996, 70, 468-478.
13. Kelly, C. A.; Farzad, F.; Thompson, D. W.; Meyer, G. J. Excited-State Deactivation of Ruthenium(II) Polypyridyl Chromophores Bound to Nanocrystalline TiO2 Mesopourous Thin Films. Langmuir 1999, 3, 731-737.
14. O'Regan, B.; Gratzel, M. A low-cost, high efficiency solar cell based on dye-sensitized colloidal TiO2 films. Nature 1991, 353, 737-740.
15. Nazeeruddin, M. K.; Pechy, P.; Renouard, T.; Zakeeruddin, S. M.; Humphry-Baker, R.; Comte, P.; Liska, P.; Cevey, L.; Costa, E.; Shklover, V.; Spiccia, L.; Deacon, G. B.; Bignozzi, C. A.; Gratzel, M. Engineering of Efficient Panchromatic Sensitizers for Nanocrystalline TiO2-Based Solar Cells. JACS 2001, 123, 1613-1624.
16. Grunwald, R.; Tributsch, H. Mechanisms of Instability in Ru-Based Sensitization Solar Cells. J. Phys. Chem. B 1997, 101, 2564-2575.
17. Hanson, K.; Brennaman, M. K.; Luo, H.; Glasson, C. R. K.; Concepcion, J. J.; Song, W.; Meyer, T. J. Photostability of Phosphonate-Derivatized, RuII Polypyridyl Complexes on Metal Oxide Surfaces. ACS Appl. Mater. Interfaces 2012, ASAP. 18. Gerischer, H. Electrochemical techniques for the study of photosensitization.
J. Photochem. and Photobiol. 1972, 16, 243-260.
19. Marcus, R. A. On the Theory of Electron-Transfer Reactions. VI. Unified Treatment for Homogeneous and Electrode Reactions. J. Chem. Phys. 1965, 43, 679-701. 20. Hughes, M. A.; Curry, R. J.; Hewak, D. W. Spectroscopy of titanium-doped gallium
13
21. Matylitsky, V. V.; Lenz, M. O.; Wachtveitl, J. Observation of pH-Dependent Back-Electron-Transfer Dynamics in Alizarin/TiO2 Adsorbates: Importance of Trap States. J. Phys. Chem. B 2006, 110, 8372-8379.
22. Shi, C.; Dai, S.; Wang, K.; Pan, X.; Kong, F.; Hu, L. The adsorption of 4-ter-butylpyridine on the nanocrystalline TiO2 and Raman spectra of dye-sensitized solar cells in situ. Vib. Spectrosc. 2005, 39, 99-105.
23. Watson, D. F.; Meyer, G. J. Cation effects in nanocrystalline solar cells. Coord. Chem. Rev. 2004, 248, 1391-1406.
24. Xhang, S.; Yang, X.; Zhang, K.; Chen, H.; Yanagida, M.; Han, L. Effects of 4-tert -butylpyridine on the quasi-Fermi levels of TiO2 films in the presence of different cations in dye-sensitized solar cells. Physical Chemistry Chemical Physics 2011, 13, 19310-19313.
25. Jennings, J. R.; Wang, Q. Influence of Lithium Ion Concentration on Electron Injection, Transport, and Recombination in Dye-Sensitized Solar Cells. J. Phys. Chem. C 2010, 114, 1715-1724.
26. Kambe, S.; Nakade, S.; Kitamura, T.; Wada, Y.; Yanagida, S. Influence of the Electrolytes on Electron Transport in Mesoporous TiO2-Electrolyte Systems. J. Phys. Chem. B 2002, 106, 2967-2972.
14
28. Ardo, S.; Meyer, G. J. Photodriven Heterogeneous charge transfer with transition-metal compounds anchored to TiO2 semiconductor surfaces. Chem. Soc. Rev. 2009, 38.
29. Nakade, S.; Kanzaki, T.; Kubo, W.; Kitamura, T.; Wada, Y.; Yanagida, S. Role of Electrolytes on Charge Recombination in Dye-Sensitized TiO2 Solar Cell (1): The Case of Solar Cells Using the I-/I3- Redox Couple. J. Phys. Chem. B 2005, 109, 3480-3487.
CHAPTER 2. Materials and Methods
2.1. Time-correlated single photon counting (TCSPC) laser scanning setup
To study interfacial charge transfer kinetics we used time-correlated single photon counting (TCSPC) to measure the excited state lifetime of photoexcited chromophores bound to nanoparticle films.1 Since electron injection quenches the emission of excited chromophores, by studying the time-dependent photoluminescent decay of the sensitized films, we can learn how different parameters influence the interfacial kinetics. TCSPC works by creating a histogram of the time it takes for a sample to emit a photon after it has been excited. It utilizes a pulsed excitation source that is split into two channels: one that is directed to a photodiode that sends a signal to the TCSPC electronics as a timing reference, and a second channel that is directed to excite the sample. The emission from the sample is detected by a photomultiplier tube (PMT) which sends a second timing signal to the TCSPC electronics. Since this whole process occurs on the microsecond timescale, this process can be repeated millions of times to develop a histogram that can be fit by different kinetic models.
15
be achieved at the focus of an objective lens. The small diffraction limited excitation volume provides spatial resolution on the order of hundreds of nanometers. The specific benefits of this spatial resolution will be discussed in Chapter 3.
A diagram of the two-photon TCSPC set up is shown in Figure 2.1. The excitation source used in our experiments is a Coherent Chameleon Ultra II Ti:sapphire laser. The output of this laser can be tuned between 680 nm to 1080 nm and produces ultrashort pulses (200 fs pulse duration). Since RuP has an absorption maximum at around 450 nm, the laser can be tuned to 900 nm to achieve maximum two-photon excitation. The initial output of our laser is approximately four Watts- a gross excess of the power needed in our experiments. Therefore we use an electro-optic modulator to reduce the power to approximately 10 mW measured at the sample position. This leads to pulse energies of ~0.12 nJ, and with our measured excitation beam radius of 206 nm (measured at the focus of the objective lens as described below), this gives a maximum energy density of 4.5 kW/cm2. Only a fraction of the chromophores will be excited by two-photon absorption. The calculations used to determine the number of excited chromophores per nanoparticle per pulse can be found in Appendix 1. Achieving less than one excited chromophore per nanoparticle per pulse prevents any unwanted second order decay processes, such as triplet-triplet anhialation, which would also influence our photoluminescence decay.3 Furthermore, the light that is not absorbed simply passes through the sample which decreases photodegradation of our sample.
16
17
solution of about 5 s. To ensure that we allow for complete relaxation of all
chromophores between subsequent excitation pulses, we used a second high-bandwidth electro-optic modulater (Con Optics 350-160) to reduce the repetition rate to 50 kHz. This electro-optic modulator works by allowing only one pulse to pass through every 20
s while suppressing all other pulses.
18
dependent upon the timing between the two pulses. The output of the TAC is then sent to an Analog-to-Digital Converter (ADC) which assigns a digital readout to the photon detection time. As the excitation process is repeated, the ADC allows for a histogram of photon detection times to be constructed.
Since such low powers are used, many pulse cycles do not result in an excited chromophore and do not emit a photon. To prevent starting a barren TAC through a complete cycle, the reversed start-stop method is used. Here the TAC is started only by the detection of a photon from the PMT and stopped by the subsequent timing pulse from the fast photodiode. A higher amplitude results from a shorter photon arrival time.
In order for the timing pulse from the fast photodiode to arrive at the TCSPC electronics after the detection of the photon by the PMT, the signal from the photodiode must either be delayed physically by passing the signal through increasing lengths of cable or electronically through the use of a digital delay. Since 1 ns corresponds to 20 cm
of cable length and the lifetime of the chromophore is on the order of 5 s, this would require 100 meters of cable. Rather than incorporating 100 meters of cable into our setup, the signal was delayed using a digital delay generator (Standord Reseach Systems DG535). The instrument response of the entire TCSPC system was limited by the
response of this digital delay generator, which led to a full width at half max (FWHM) of about 3.6 ns.
19
mirror galvanometers that provide x,y positioning of the laser. The beam is then directed into an inverted microscope and focused onto the sample by a 60x, 1.2NA water
immersion objective lens (Olympus UPLSAPO 60XW). The back aperture of the lens is slightly overfilled to create a diffraction-limited focal spot. The epifluorescence is then collected through the same objective lens and directed towards the PMT for detection. 2.2. Electrochemical measurements
A working solar cell device in sunlight will have a slightly higher electric potential due to the injected electrons into the conduction band of the semiconductor. Therefore it is also imperative to study the effects of applied potential on the interfacial charge transfer kinetics. To do this, the sintered nanoparticle film is synthesized on a conductive glass surface. After sensitization with the RuP dye, this film can be
incorporated as the working electrode into a three-electrode electrochemical cell. In this setup a Wavenow potentiostat (Pine Research Instrumentation AKCABLE3) maintains a constant potential on the working electrode relative to a reference electrode. There are many different types of reference electrodes that are appropriate for different solvents. Since our experiments were mainly performed in acetonitrile, we used a Ag/AgNO3 reference electrode. Finally, the third electrode used in this setup is a platinum wire for the counter electrode.
20
flow across the reference electrode resulting a shift in that reaction’s potential. Therefore
our reference would no longer be constant. To correct for this, a third electrode is incorporated called a counter electrode. This electrode is an inert electrode, in our case a platinum wire, and current passes through this electrode rather than the reference
electrode. In summary, the potentiostat applies a potential between the working and reference electrode and measures the current between the working and counter electrodes. 2.3. Sample Preparations
This dissertation presents studies performed on sensitized metal oxide nanoparticle films. Most studies utilized TiO2 nanoparticle films in order to study interfacial charge transfer kinetics. As a control, ZrO2 films were used since the high conduction band edge of this semiconductor prevents electron injection. These films are deposited on an FTO substrate by the sol-gel process4,5 and consist of nanoparticles that
are 20 nm in diameter. The thickness of these films are 7 m for the TiO2 film and 3 m
for the ZrO2 film. The benefit of these films is that they are optically transparent.
For the sensitization process, the films are immersed in 150 m [(Ru(bpy)2(4,4’-(PO3H2)2bpy)]2+ 6 (RuP) in 0.1 M perchloric acid solution (pH 1) for at least three hours. This is the time it takes for a complete monolayer of dye to adsorb to the surface which was determined by tracking the absorbance at 450 nm. After three hours, no further time in the sensitizing solution resulted in increased absorption. For convenience, films were most often left to sensitize overnight. To remove any dye aggregates from the surface, the sensitized films were then immersed in methanol for at least three hours.
21
spacers. This chamber is filled with the electrolyte solution containing various concentrations of the specified chemical additive. All chemical additive experiments were performed under ambient conditions. Electrochemical studies were performed with the nanopartcile film incorporated as the working electrode in a three-electrode cell. To remove any elecrochemical influence from dissolved oxygen in our solutions, the samples were sealed and deoxygenated by bubbling argon gas through the system for 40 minutes.
2.4. Data Fitting procedure
The data that we collect from our TCSPC measurements are histograms of the time it takes for a photon to be emitted after the reference photodiode identifies the arrival of the excitation pulse. For most experiments, the entire collection window is five thousand nanoseconds and with 4096 channels, each data point is a binned number of events that occur in a 1.22 ns window. In one experiment a shorter collection window of 500 nanoseconds is used to increase the time resolution so that each data point is binned into a 0.12 ns window. The time axis is corrected to identify time zero as the time the sample was excited rather than the time the photodiode observes the excitation pulse. Since the peak of the histogram would shift depending on the amplitude of the histogram, time zero is identified from a threshold in the leading edge of the peak determined from a constant fraction of the peak amplitude. All data is corrected to the same constant
fraction threshold of thirty percent of the peak amplitude; this threshold was determined from the instrument response function.
22
measured instrument response function before fitting. Due to the long lived excited state of the
RuP chromophore, we observed emission from a wide range of timescales, from the nanoseconds
to microseconds. Initial fits that reduced the sum of the unweighted residuals did not adequately
fit the long-time tails of emission decays due to the low value of the data at these times. To
adequately reproduce data that spans a wide range of amplitudes, we applied a fitting function
that minimized the sum of the fractional residual (frac. res.) weighted by Poisson signal-to-noise
ratio (shot noise due to counting a discrete number of photons) at each time point:
i data i data i fit i data i data i data i
fit ) ( )
( res.
frac. (2.1)
23 REFERENCES
1. Becker, W. The bh TCSPC handbook; Becker & Hickl GmbH: 2008; , pp 466.
2. Lakowicz, J. R. Nonlinear and two-photon-induced fluorescence; Topics in Fluorescence Spectroscopy; Springer Publishing Company: New York, 1997; Vol. 5, pp 544.
3. Kelly, C. A.; Farzad, F.; Thompson, D. W.; Meyer, G. J. Excited-State Deactivation of Ruthenium(II) Polypyridyl Chromophores Bound to Nanocrystalline TiO2 Mesoporous Thin Films. Langmuir 1999, 3, 731-737.
4. Lee, S. A.; Abrams, N. M.; Hoertz, P. G.; Barber, G. D.; Halaoui, L. I.; Mallouk, T. E. Coupling of Titania Inverse Opals to Nanocrystalline Titania Layers in Dye-Sensitized Solar Cells. J. Phys. Chem. B 2008, 112, 14415-14421.
5. Song, W.; Glasson, C. R. K.; Luo, H.; Hanson, K.; Brennaman, M. K.; Concepcion, J. J.; Meyer, T. J. Photoinduced Stepwise Oxidative Activation of a Chromophore-Assembly on TiO2. J. Phys. Chem. Lett. 2011, 2, 1808-1813.
CHAPTER 3 . Power-Law Kinetics in the Photoluminescence of Dye-Sensitized Nanoparticle Films: Implications for Electron Injection and Charge Transport Reprinted with permission from “Power-Law Kinetics in the Photoluminescence of
Dye-Sensitized Nanoparticle Films: Implications for Electron Injection and Charge Transport” by Ian J. McNeil, Dennis L. Ashford, Hanlin Luo, and Christopher J. Fecko in The Journal of Physical Chemistry C 2012 116 (30), 15888-15899. Copyright 2012 American
Chemical Society 3.1. Introduction
The need to develop clean, renewable energy sources has become even more pressing with increasing energy consumption in developing countries and mounting environmental concerns. The dye-sensitized solar cell (DSSC) introduced by O’Regan and Graetzel has the potential to address these concerns by inexpensively harvesting solar energy.1 Their design is based on photoinduced charge separation at the interface of a mesoporous nanocrystalline TiO2 film sensitized with a ruthenium-based chromophore. While DSSCs are relatively inexpensive to produce, further efficiency improvements are needed in order to be commercially competitive with current energy sources. Similar improvements may also enable the development of dye-sensitized photoelectrosynthesis cells (DSPECs) that use light to directly split water into hydrogen and oxygen.2
25
chromophores bound to TiO2 is a nonradiative process that considerably reduces
emission. Spectroscopic techniques with subpicosecond time resolution, such as transient absorption with visible to near-IR light and time-resolved terahertz spectroscopy, have indicated that electron injection occurs on timescales from 10 fs - 10 ps.3-5 Based on the more than four orders of magnitude difference in rate constants, conventional kinetic arguments would predict complete chromophore emission quenching. Indeed,
chromophores on metal oxide semiconductors with a conduction band energy that allows for electron injection are strongly quenched, but previous studies have repeatedly
measured residual chromophore emission.6-11 The origin of this residual emission is not well understood. Although the energy lost via this radiative mechanism is very small, uncovering its origin may provide important information about the underlying physics that limits DSSC and DSPEC efficiencies.
Our study investigates the time-dependent photoluminescence decay of a
phosphonate-derivatized Ru(II) polypyridyl complex bound to nanocrystalline TiO2 and ZrO2 films using time-correlated single photon counting (TCSPC). Most of our
26
As compared with previous dye-sensitized TiO2 quenching studies, we have observed that the time-dependent chromophore photoluminescence exhibits a power-law decay in time. This behavior occurs in both aqueous and acetonitrile electrolytes, and it persists over three orders of magnitude in time (sub-nanosecond to microseconds). Power-law distributions may be a consequence of various physical origins,14 and in this case may provide useful information for solar cell devices, so we have investigated the kinetics further. By measuring the time-dependent residual emission of the same films immersed in varying electrolyte concentrations, we show that the power-law decay results only under conditions that favor electron injection and seems to be a limiting behavior of the dispersive kinetics observed at lower cation concentrations. To explain these observations, we propose a model in which excited state electrons are injected into localized trap states within the semiconductor. We consider the implications of this model on the performance of nanocrystalline solar cell devices.
3.2. Material and Methods
3.2. A. Optical setup for TCSPC measurements
27
Olympus IX-81 inverted microscope through a dedicated laser port. The beam was focused onto the sample by a 60X, 1.2NA water immersion objective (Olympus UPLSAPO 60XW); the back aperture of this lens was slightly overfilled to create a diffraction-limited focal spot. Epifluorescence collected by the objective was separated from the excitation beam by a long-pass dichroic filter (Chroma 670DCXXRU). Full suppression of the IR light was accomplished with a short-pass dichroic (Semrock FF01-680/SP) and a bandpass filter (Chroma HQ630/100m-2P). The optically filtered
fluorescence is detected by a GaAsP photomultiplier tube (Hamamatsu H7422P-40mod) whose output was sent to a custom designed preamplifier that has a high-bandwidth amplified output channel.
The pulse repetition rate of the laser output was reduced to 50 kHz by the high-bandwidth electro-optic modulator, which allows for complete relaxation of all the dye molecules to prevent excitation of an already excited chromophore, and samples were excited with infrared pulse energies of ~0.12 nJ unless specified otherwise. With our measured excitation beam radius of 206 nm, this gives a maximum energy density of 4.5 kW/cm2, although it is important to note that with two-photon excitation only a small fraction of the incident light is absorbed. A cover slip placed in the laser beam path was used to direct a small fraction of the excitation light to a fast photodiode for use as a timing-reference. For most experiments this timing signal was sent to a digital delay
generator (Stanford Research Systems DG535) delaying the signal by 4.8 sec. This
28
The instrument response function (full width at half maximum, FWHM ~3.6 ns) was measured by collecting the second-harmonic signal generated by potassium dihydrogen phosphate (KDP) crystals placed at the sample position. This time-resolution was limited by the digital delay generator.
3.2. B. Modification of optical setup for TCSPC with one-photon excitation
For experiments that use one-photon excitation, the Ti:sapphire laser output tuned to 900nm was focused into a 1 mm length BBO crystal cut for type I phase matching, and by frequency doubling creates 450 nm pulses for optimal linear excitation of the
chromophore. The residual fundamental was rejected with dichroic mirrors, before directing the beam into the same microscope for sample excitation and detection. One-photon excitation experiments used visible pulse energies of ~0.012 pJ at a 50 kHz repetition rate providing an energy density of 1.0 W/cm2. Under these conditions, an average of 0.5 dye molecules are excited per nanoparticle as a result of each laser pulse (see Appendix 1).
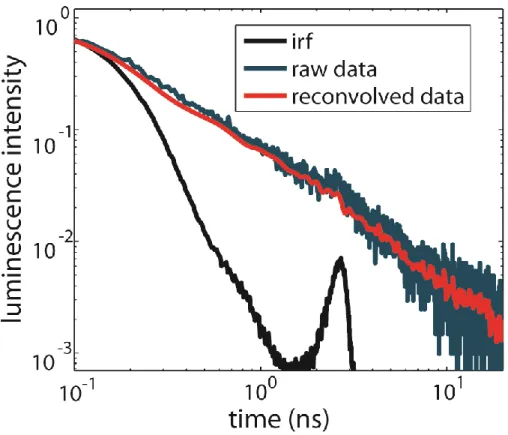
3.2. C. Modification of optical setup for TCSPC with sub-nanosecond time resolution
29
main peak) due to an imperfection in the PMT. To remove this instrument imperfection, the instrument response was deconvolved from the raw data and then a Gaussian fit of the main peak of the instrument response was reconvolved with the data.
3.2. D. Modification of optical setup for TCSPC with laser-scanning excitation Most of the experiments were performed by exciting the same diffraction limited spot for the entire data averaging time (1-4 minutes). To examine the influence of long-term charge accumulation, laser-scanning experiments were performed in which the diffraction-limited focal spot (FWHM ~300 nm) is raster scanned across the field of view
at a rate of 55 nm/sec by galvanometer-mounted mirrors placed in a plane conjugate to
the objective back aperture. This method provides 1 m or about 3 beam diameters between subsequent excitation pulses (at the 50 kHz repetition rate). The entire two-dimensional field is scanned at 4 Hz, so that a given region of the film is repeatedly excited every 250 ms.
3.2. E. TCSPC data analysis
30
applied a fitting function that minimized the sum of the fractional residual (frac. res.) weighted by Poisson signal-to-noise ratio (shot noise due to counting a discrete number of photons) at each time point:
i data i data i fit i data i data i data i
fit ) ( )
( res.
frac. (3.1)
A small constant approximately equal to the pre-pulse noise floor (typically ~10-3) was
added to the denominator to prevent division by zero. Also since baseline noise varies
symmetrically about zero, absolute values of the data are used to eliminate negative
values.
3.2. F. Sample preparation
The TiO217 and ZrO218 nanoparticle films of about 7 micron and 3 micron thickness respectively, consist of nanoparticles that are 20 nm in diameter deposited on
an FTO substrate by the sol-gel process. They are sensitized by immersion in 150 M [(Ru(bpy)2(4,4’-(PO3H2)2bpy)]2+ (hereafter referred to as RuP) in 0.1 M perchloric acid solution (pH 1) overnight then soaked in methanol overnight to remove any possible aggregates.19 To study films immersed in various electrolyte solutions, a temporary chamber is created between a glass coverslip and the sensitized nanoparticle film using Teflon spacers. This chamber is filled with either an aqueous perchloric acid or
acetonitrile solution. The pH is adjusted by the addition of perchloric acid, while the lithium ion concentration is adjusted by the addition of lithium perchlorate. All
31
3.2. G. Photoluminescence quantum yield measurements
Photoluminescence quantum yield measurements were obtained using an integrating sphere incorporated into a spectrofluorometer (FLSP 920, Edinburgh
Instruments). The sensitized film was placed at a 45° angle inside a 1cm quartz cuvette which was filled with an acetonitrile solution. To calculate the absolute quantum yield, both direct and indirect measurements were obtained to account for emission from scattered light. For direct measurements, the excitation beam is directed into the
integrating sphere and aimed directly onto the sample. The indirect measurement directs the beam to the side of the sample in order to quantify the amount of emission occurring from scattered light within the integrating sphere. The direct and indirect methods are used to measure both the absorbance and the emission. The absorbance is measured by observing the loss of signal at the excitation wavelength, from 435-455 nm, compared to that of the sample-free solvent (La). The absorptivity (A) is calculated to be 1 minus the ratio of the direct and indirect absorbance measurements. The emission intensity for both the direct (Pc) and indirect (Pb) method was detected from 550-850 nm. These
measurements are used to calculate the absolute photoluminescence quantum yield
(by equation 3.2.20
A a L c A)P ( c
P
1
Φ (3.2)
32
Due to the reduced emission of the sensitized TiO2 film immersed in the
electrolyte solution, the signal-to-noise of some emission measurements using a narrow excitation bandwidth was poor. To enable an accurate determination of the quantum yield, we recorded relative emission measurements for each sample by expanding the excitation bandwidth to 15 nm for only the emission measurements. These relative emission measurements were renormalized by a scaling factor determined by the ratio of the integrated relative to direct emission measurements for the sensitized ZrO2 sample. 3.3. Results
3.3.A. Time-dependent photoluminescence of RuP bound to nanocrystalline TiO2
exhibits a power-law decay
We used a two-photon microscopy setup with TCSPC capabilities to investigate the time-dependent residual luminescence of surface-bound chromophores on metal oxide films immersed in a pH 1 aqueous solution (Figure 3.1). The advantage of using a microscope set up with a high numerical aperture objective lens is that it yields a high dynamic range in our signal. Nanocrystalline metal oxide films were deposited using a sol-gel procedure, and then sensitized by immersion in pH 1 perchloric acid solution with a phosphonate-derivatized Ru(II) polypyridyl complex, RuP. Two-photon absorption of ultrashort 900 nm pulses was employed to obtain selective excitation of surface bound chromophores.
33
rigid media effect caused by constraints imposed by the surface.21 The difference
between the emission from ZrO2-RuP compared to TiO2-RuP results from the conduction band edge of ZrO2 being higher in energy than the chromophore excited state, while the conduction band of TiO2 is sufficiently low enough to permit electron injection, thus quenching the emission.
The time-dependent chromophore emission on TiO2 films is typically fit to multi-exponential or modified multi-exponential functions. Motivated by the nearly universal emission intermittency (blinking) behavior of single-molecules and quantum dots that exhibit a power-law distribution of on- and off-times, we decided to examine the time-dependent emission decay of the chromophore on a double logarithmic plot before fitting the data.22 Indeed, the time-dependent emission of TiO2-RuP appears as a straight line on a double logarithmic plot (Figure 3.1 C), indicating the emission obeys a power-law decay in time. This behavior is qualitatively distinct from the nearly exponential decay of the chromophore on ZrO2. Subsequent control experiments established that no emission is detected from unsensitized films under identical conditions, thus supporting the conclusion that the detected luminescence arises purely from RuP.
3.3.B. Power-law decay occurs at high H+ or Li+ concentrations in water or acetonitrile.
34
Figure 3.1: Time-dependent photoluminescence decay curves for RuP sensitized TiO2
and ZrO2 plotted on a linear scale (A), a semilogarithmic scale (B), and a double
logarithmic scale (C). The semilog plot demonstrates that emission of the sensitized
ZrO2 film decays with an exponential time dependence. The emission from sensitized
TiO2 film is quenched due to electron injection. The double logarithmic plot
demonstrates that emission of the sensitzed TiO2 film decays with a power-law time
35
hydrogen ion concentration (i.e. a Nernstian dependence on pH).23 Therefore, we compared the emission of the same film immersed in aqueous solutions of various pH values (Figure 3.2 A and B). In the pH 1 solution, in which the TiO2 acceptor states are shifted to the lowest energy, the emission follows a power-law decay. As the pH is increased, the emission decay timescale becomes slower. In addition, since the time-dependent photoluminescence decay plots do not follow a straight line on either a double or single logarithmic plot, these curves do not exhibit either a power-law decay or an exponential decay. Rather they require another dispersive kinetic model. The range of pH values that could be examined was limited by the stability of the chromophore-TiO2 phosphonate linkage, which becomes hydrolytically unstable in neutral and basic
36
Figure 3.2: Lowering the conduction band energy of TiO2 leads to a power-law decay.
The pH dependence of the emission decay in water is plotted on a semilogarithmic (A)
and double logarithmic scale (B). The emission’s lithium ion concentration dependence
in acetonitrile is plotted similarly (C,D). The plots of 0 M, 0.1 mM, and 1mM Li+ are
nearly indistinguishable. Both scenarios demonstrate that as the conduction band energy
level is lowered, the emission smoothly transitions to a dispersive exponential decay to a
power-law decay. Comparing the decay of the sensitized TiO2 film in both the pH 1 in
acetonitrile to 1.0 M Li+ in acetonitrile (E) show that this behavior is independent of
solution. The combined effect of added lithium ions in an acidic pH 1 aqueous solution
37
solution. We also examined the combined effect of Li+ on a low pH aqueous solution (Figure 3.2 F), and found that the emission still follows a power-law decay.
The time resolution of TCSPC measurements, usually limited by the PMT transient-time spread, is typically much shorter than a nanosecond. However, the time resolution of data presented to this point is limited by the timing jitter of the digital delay generator that is required to achieve long observation times at low repetition rates. By performing experiments using a long coaxial cable rather than the digital delay to delay our timing signal, we reduced the FWHM of our instrument response from ~3.6 ns to ~260 ps, though this modification limits the maximum observation time to 30 ns. Using this modified setup, we measured the time-dependent emission of a dye-sensitized TiO2 film in pH1 aqueous solution (Figure 3.3) to determine if the emission exhibits a power-law decay on sub-nanosecond timescales. The raw data was corrected for a secondary peak in the instrument response function, which is a common issue in TCSPC systems, by deconvolving the instrument response from our data and reconvolving a Gaussian fit of the main peak of the instrument response into the data. This reconvolved data
confirms that the emission at this shorter time scale is consistent with a power-law decay. 3.3.C. Chromophore photoluminescence also exhibits power-law decay after one-photon excitation.
The normal function of solar cells requires one-photon chromophore excitation and most previous experiments have probed emission following one-photon excitation, so it is important to determine if the decay profile is influenced by the excitation
mechanism. While the initial excited states resulting from one- and two-photon
38
Figure 3.3: Time-dependent emission of TiO2-RuP in pH1 aqueous solution with
increased time resolution from replacing the digital delay with a cable delay showing that
39
40
Figure 3.4: Emission decay is not dependent on excitation scheme. One-photon and
two-photon excitation of the same sensitized TiO2 film showed similar decays in
acetonitrile (A). However in water, the two excitation schemes show different lifetimes
plotted on a semilogarithmic plot (B) and double logarithmic plot (C). The long time
component from the one-photon excited film in water was determined to be due to freely