EVALUATING STRATEGIES FOR RESTORING PARROTFISH POPULATIONS IN BELIZE
Courtney Ellen Cox
A dissertation submitted to the faculty at the University of North Carolina at Chapel Hill in partial fulfillment of the requirements for the degree of Doctor of Philosophy in the
Department of Biology.
Chapel Hill 2014
ABSTRACT
Courtney Ellen Cox: Evaluating Strategies for Restoring Parrotfish Populations in Belize (Under the direction of John F. Bruno)
Parrotfish populations have declined throughout the Caribbean due to overfishing. Functional loss of these key grazers has contributed to a shift in reef community structure from coral to algal dominance. Marine protected areas (MPAs) and a national ban on the harvesting of herbivorous fishes are two management strategies implemented in Belize to recover parrotfish populations. Restricting or eliminating fishing is thought to promote high biomass of herbivorous fish that suppress macroalgae facilitating coral recruitment and population recovery. The success of these strategies not only depends on reduced fishing pressure, but also on the connectivity between parrotfish populations.
My doctoral dissertation research examined the effectiveness of the MPA network in Belize and the ban on herbivorous fish harvesting in restoring fish communities and coral reef assemblages. From 2009 to 2013, I quantified the density and biomass of reef fishes, coral cover, and macroalgal cover at 16 reefs in Belize, including 8 protected sites and 8 unprotected sites. I then tested the effects of MPAs and the ban on herbivorous fish
harvesting on coral reef community structure, projected parrotfish population recovery, and assessed connectivity between parrotfish populations in Belize and Honduras using nine
nuclear microsatellite loci. Over the five year monitoring period, density or biomass
ACKNOWLEDGEMENTS
I would like to thank my doctoral advisor, John Bruno, for the opportunity to pursue my PhD and his continued support. John is truly an inspiration to me and I feel privileged to have worked with him over the past five years. I would also like to thank my doctoral committee members, Corbin Jones, John Wares, Karl Castillo, and Peter White, for their guidance in the lab and in the field.
I want to give a special thanks to Corbin Jones for allowing me to join his lab and
training me in molecular techniques. Also, a special thanks to Nathan Truelove and Steve
Box at the Smithsonian Marine Institute for their invaluable collaboration, guidance for
microsatellite development, and the use of the Smithsonian molecular laboratory.
Completing this degree would never have happened without the support of my incredible lab mates that have become family to me. Lindsey Carr, Abel Valdivia, Rachel Gittman, Serena Hackerott, Emily Darling, and Ivana Vu helped me through field
catastrophes, statistical nightmares, and painful manuscript writing. They have been my sounding board and at many times a much needed voice of reason. I sincerely thank all of them for their friendship and encouragement that kept me going.
imperative for my understanding of local culture and the challenges of conservation. These people include Annelise Hagan (Southern Environmental Association), James Foley (Toledo Institute for Development and Environment), Melanie McField (Healthy Reefs for Healthy People), Diana Vasquez and Steve Canty (Centro de Estudios Marinos Honduras), Giaco Palavicini (Roatan Marine Park), Ian Drysdale (Healthy Reefs Initiative), Jenyy Myton (Coral Reef Alliance), Ana Quinonez (Bay Islands Conservation Association Utila), Oscar Maradiaga, Anais Monroy, the Belize Fisheries Department, Instituto Nacional de
Conservación y Desarrollo Forestal, and Áreas Protegidas y Vida Silvestre who provided field and laboratory assistance, logistical support and necessary research permits.
Finally, I want to thank my mom and dad for always believing in me and encouraging
me to chase my dreams. Since I can remember, they have been telling me that I can
accomplish anything I set my mind to and without them I would not be who or where I am
TABLE OF CONTENTS
LIST OF TABLES ... X
LIST OF FIGURES ... XI
CHAPTER 1: GENETIC TESTING REVEALS SOME MISLABELING BUT GENERAL COMPLIANCE WITH A BAN ON HERBIVOROUS FISH
HARVESTING IN BELIZE ...13
Introduction ... 13
Methods ... 15
Sample and data collection ... 15
DNA Extraction and PCR Amplification ... 16
DNA Sequencing and Sequence Alignment ... 16
Phylogenetic Analysis ... 17
Statistical Analyses ... 17
Results ... 17
Discussion ... 22
Conclusions and Recommendations ... 28
CHAPTER 2: NATIONAL FISHING BAN PROMOTES RECOVERY OF PARROTFISH POPULATIONS ON CARIBBEAN CORAL REEFS ...29
Introduction ... 29
Methods ... 32
Stage-Structured Model ... 34
Population Projection ... 36
Results ... 37
Discussion ... 42
CHAPTER 3: ESTABLISHMENT OF MARINE PROTECTED AREAS ALONE DOES NOT RESTORE CORAL REEF COMMUNITIES ...46
Introduction ... 46
Methods ... 50
Study locations ... 50
Fish surveys ... 51
Benthic surveys ... 53
Covariates ... 53
Data Analysis ... 54
Results ... 55
Discussion ... 57
CHAPTER 4: GENETIC POPULATION STRUCTURE REVEALS CONNECTIVIT OF PARROTFISH POPULATIONS IN THE SOUTHERN MESOAMERICAN BARRIER REEF ...69
Introduction ... 69
Methods ... 72
Sample Collection and Genomic DNA Isolation ... 72
Amplification, Genotyping and Data Analysis ... 74
Results ... 77
Discussion ... 84
APPENDIX B ...91
APPENDIX C ...99
LIST OF TABLES
Table 1.1: Summary of Fish Mislabeling by Town. ... 21
Table 1.2: Summary of Fish Mislabeling by Vendor. ... 22
Table 1.3: Summary of Fish Mislabeling by Sampling Period. ... 23
Table 1.4: Town Tourism and Population Statistics ... 24
Table 2.1: Life History Traits for Stoplight Parrotfish, Sparisoma viride ... 35
Table 3.1: Monitoring Site Details... 52
Table 3.2: Mean value and standard error(SE) of each response variable by protection level and enforcement level. p-value represents results of linear mixed effects models. ... 56
Table 3.3: Top linear mixed-effects models testing the effects of 15 covariates on four response variables ... 59
Table 4.1: Summary of 9 polymorphic nuclear microsatellite loci in Sparisoma viride. ... 75
Table 4.2: Results of Hardy-Wienburg Equilibrium analysis. ... 79
Table 4.3: Summary Statistics. Sample size (N); average allelic richness (Na); expected and observed heterozygosity (HE, HO); and inbreeding coefficient (FIS) for the 7 sampling locations included in this study. ... 80
LIST OF FIGURES
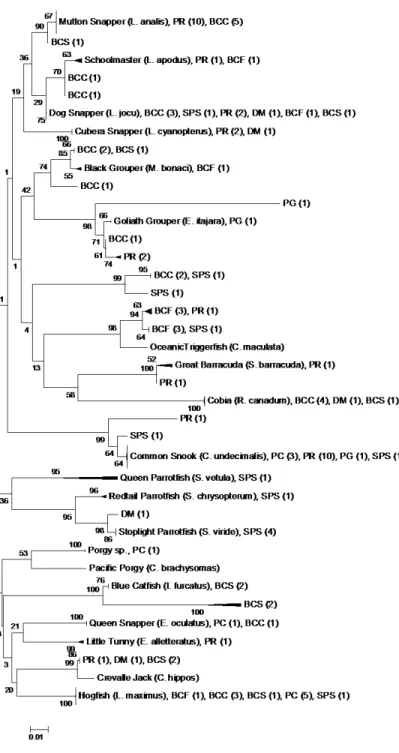
Figure 1.1: Evolutionary relationships of samples ... 18 Figure 1.2: Proportion of Mislabeling by market label... 19 Figure 1.3: Species composition of samples labeled as snapper, grouper, and
snapper/grouper... 20 Figure 2.1: Mean density by class size for four species of parrotfish across
16 reefs from 2009 to 2013. ... 39 Figure 2.2: Mean Biomass (± 95% confidence interval) by class size for four
species of parrotfish across 16 reefs from 2009 to 2013. ... 40 Figure 2.3: Coefficient estimates (mean ± 95% confidence interval) resulting
from linear mixed effects models testing the effect of the harvesting
ban and 10 covariates on parrotfish density and biomass over time. ... 42 Figure 2.4: Comparison of stage-structured population model predictions
(light grey) and data collected during monitoring surveys (dark grey)
for S. viride biomass (mean ± 95% confidence interval). ... 43 Figure 3.1: Coefficient estimates (mean ± 95% confidence interval) resulting
from linear mixed effects models testing the effect of the protection status and enforcement level and 15 covariates on predatory reef fish biomass,
parrotfish biomass, macroaglal cover, and coral cover. ... 57 Figure 3.2: Significant correlations between response variables and explanatory
variables. Points are means per site. ... 63 Figure 3.3: Comparison of parrotfish biomass, predatory reef fish biomass,
macroalgal cover, and coral cover within protected areas (C1 and C2)
and unprotected areas. ... 64 Figure 3.4: Comparison of parrotfish biomass, predatory reef fish biomass,
macroalgal cover, and coral cover by enforcement level. ... 64 Figure 4.1:Topographic map of mean current direction and sampling locations. ... 73 Figure 4.2: Frequency distribution of individual inbreeding coefficients by population. ... 81 Figure 4.3: Discriminant analysis of principal components (DAPC) of
Figure 4.4: Triangular plot of STRUCTURE results. ... 83 Figure 4.5: Correlation between genetic distance (Nei’s Distance) and geographic
CHAPTER 1: GENETIC TESTING REVEALS SOME MISLABELING BUT GENERAL COMPLIANCE WITH A BAN ON HERBIVOROUS FISH
HARVESTING IN BELIZE
Introduction
In recent decades, coral reef ecosystems have experienced a substantial decline in coral health and fish abundances (Hughes 1994, Jackson et al. 2001, Gardner et al. 2003) and thus resource managers have implemented various measures to mitigate coral loss and restore fish populations. However, overexploitation of fish populations continues to occur despite conservation efforts in part because of illegal, unregulated, and unreported (IUU) fishing and fish mislabeling (Baker et al. 2007, Jacquet and Pauly 2008, Miller et al. 2011). The Belize Fisheries Department has developed a number of progressive marine management strategies including the establishment of no-take zones, protection of spawning aggregation sites, bans on bottom trawling and on the capture and possession of herbivorous fishes (Scaridae and Acanthuridae). Parrotfish comprised an average of 28% of the catch at Glover’s Reef from 2005 to 2008 (Wildlife Conservation Society 2010). In 2009, resource managers
implemented the national ban on herbivorous fish harvesting to mitigate high (~50%)
However, evaluation of compliance with the ban is needed to fully assess the value of the approach.
Fishing is economically, culturally, and socially important for many coastal
communities in Belize with finfishes historically being an important local fishery and more recently an important export fishery (Belize Ministry of Agriculture and Fisheries 2008). Specifically, snapper and grouper are highly sought after by fishermen to meet demand from locals and tourists. Other important species in Belize include common snook, mackerels, kingfish, cobia, small tunas, bonito, pompano, permit, and hogfish (Belize Ministry of
snapper (genus Sebastes) in California and Washington were identified as overfished species of Sebastes. In the US, studies such as these have resulted in fines for seafood fraud (up to $1 million) and states developing programs to use DNA testing to prevent mislabeling.
According to marine reserve managers, few arrests have been made for the possession of herbivorous fish (Annelise Hagan, person. comm, 2011). However, it is difficult to
evaluate true compliance with this ban based on arrest records because of the lack of detailed record keeping by enforcement rangers. An alternative approach to detecting illegal fishing is to use genetic identification to determine if illegal species are being sold as fillet in
markets.This study documents the prevalence of illegal, herbivorous fish and fish mislabeling in local markets from fiver major Belizean towns over a two year period.
Methods
Sample and data collection
We designed the sampling methodology to maximize spatial coverage within Belize, maximize the type of vendors sampled, and replicate the data collection over time. We purchased 111 fish fillets from open fish markets, supermarkets, restaurants, and/or fishing co-operatives in five major fishing and/or tourist towns along the Belize coast in May/June and October/November from 2009 to 2011 (Appendix A). We removed approximately 1 gram of muscle tissue from the fillets and stored in either 95% ethanol or 150 proof liquor in 2 ml screw cap tubes. The number of fish fillets purchased varied between towns and
certain whether each fillet was cut from a different fish or if multiple fillets were cut from one large fish. Therefore, we analyzed the data under two assumptions; 1) each fillet was cut from a different fish and 2) fillets identified as the same species purchased from one vendor were cut from one large fish. For the purpose of proportion comparisons, we defined an individual sampling as data collected at one vendor in one town during one sampling period as summarized in Table S1.
DNA Extraction and PCR Amplification
We extracted genomic DNA from sample tissue with the Qiagen Puregene Mousetail kit (former Gentra cat. no. D-7010B) and stored at −20°C. A 658 base pair (bp) fragment of the mtDNA cytochrome oxidase I (COI) gene was amplified by PCR using a combination of LCO1490/HCO2198 (Folmer et al. 1994) or FishF1/FishR1 (Ward et al. 2005)
oligonucleotide primers. A detailed description of the PCR reactions is included in Appendix A. We ran PCR products on a 1% agarose gel to confirm amplification of the correct
fragment.
DNA Sequencing and Sequence Alignment
We purified PCR products using Zymo DNA Clean and Concentrator -25 (cat. no. D4033). All DNA was sequenced in one direction using PCR primers. Sequence
reference species were aligned with ClustalX.
Phylogenetic Analysis
We constructed phylograms using MEGA 5.1 using neighbor joining analysis and a Kimura two parameter (K2P) model to provide a graphic representation of the patterning of divergence between species (Tamura et al. 2011). The K2P model was selected by the MEGA 5.1 Best Fit DNA Model. Confidence in phylograms was assessed by the
nonparametric bootstrap method with 1000 replications. Deep nodes within the phylogram could not be resolved using COI alone; therefore, BLAST and BOLD were used to verify our sample identification.
Statistical Analyses
We utilized Fisher’s Exact Tests to analyze differences in mislabeling proportions between sampling periods, vendors and towns. The Bonferroni correction was used to adjust the level of significance when conducting multiple significance tests.
Results
Figure 1.1: Evolutionary relationships of samples
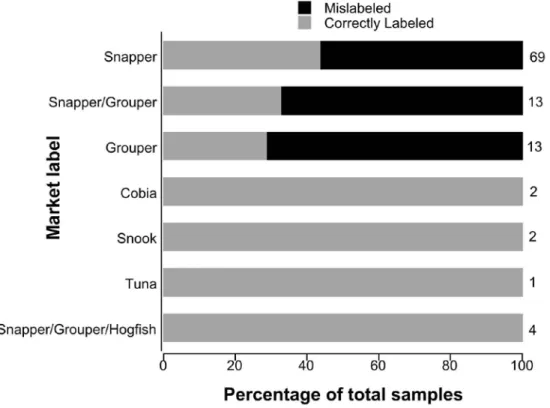
Therefore, we assumed that these 42 fillets were cut from one of the 69 fishes when calculating minimum proportions of mislabeling and parrotfish. When we treated each fillet as an individual fish, the mean proportion, (i.e., across towns, vendors and sampling periods) of mislabeled samples was 51±25% (± 1 SE), 7±17% of which were herbivorous fish. When we treated multiple fillets of the same species purchased from an individual vendor as one large fish, the mean proportion of mislabeled samples was 32±24% (± 1 SE), 5±13% of which were herbivorous fish. Fillets purchased were labeled as snapper, grouper, snapper/grouper, snapper/grouper/hogfish, cobia, tuna or snook. Only fillets labeled as snapper or grouper were mislabeled (Fig. 1.2).
Figure 1.2: Proportion of Mislabeling by market label.
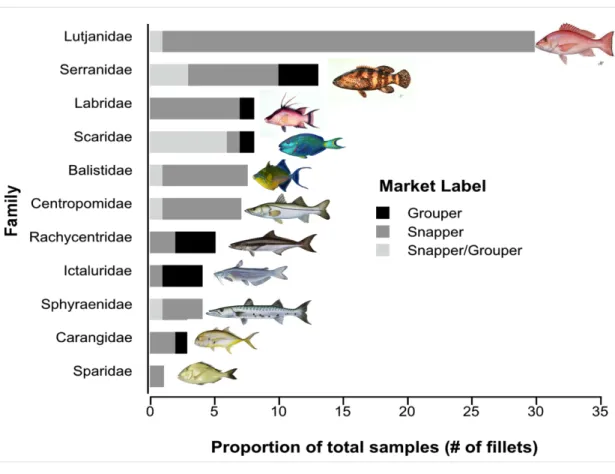
We genetically identified fillets labeled as snapper or grouper to one of 11 families (Fig.1. 3). The proportion of fillets that were identified as parrotfish in San Pedro (43%) was significantly higher than Placencia (0%) and Belize City (2%) when each fillet was treated as an individual fish (Table 1.1). However, the proportion of parrotfish was not significantly different between towns when we treated multiple fillets of the same species purchased from an individual vendor as one large fish. The proportion of mislabeling was not significantly different between Belize City, Placencia, Dangriga, and San Pedro (Table 1.1).
Figure 1.3: Species composition of samples labeled as snapper, grouper, and snapper/grouper.
higher proportions. The small sample size in Punta Gorda (N=3) likely accounts for the lack of significance between Punta Gorda and any of the other towns. We calculated total
proportions by averaging (weighted average) the proportion of mislabeling or parrotfish estimated by each sampling in a particular town (Appendix A).
Table 1.1: Summary of Fish Mislabeling by Town.
The proportions of mislabeled samples were not significantly different between towns for total mislabeled samples (p=0.09). The proportion of parrotfish was significantly higher in San Pedro than in Placencia (p<0.001) and Belize City (p<0.001) when each fillet was treated as an individual fish. Proportions were not significantly different when fillets identified as the same species from an individual vendor were treated as one fish.
Town
Number of Samplings
Number of fillets (minimum number of
individual fishes) Fillets Identified as Parrotfish (Mean%±SE) Total Mislabeled Fillets (Mean%±SE)
Punta Gorda 2 3 (3) 0±0 0±0
Belize City 11 46 (28) 2±10 - 4±10** 50±42 - 60±42**
Placencia 4 44/37* (24/23) 0±0 39±32** - 47±35
Dangriga 1 5 (5) 20 60
San Pedro 3 13 (10) 33±23** - 43±33 66±24** - 73±25
* 7 of these samples were confiscated from restaurants by the Belize Fisheries Department and the market label was not known. These samples were only used to calculated proportions of parrotfish.
** Mean calculation assumed that fillets identified as the same species at an individual vendor were cut from one fish.
Table 1.2: Summary of Fish Mislabeling by Vendor.
The proportion of total mislabeled samples was significantly higher in the open fish markets than in restaurants (p=0.004) and the proportion of parrotfish sold was significantly higher in supermarkets than in restaurants (p<0.001) and in supermarkets when compared to that in co-operatives (p<0.001) when each fillet was treated as an individual fish. Proportions were not significantly different when fillets identified as the same species from an individual vendor were treated as one fish.
Vendor
Number of Samplings
Number of fillets (minimum number of
individual fishes) Fillets Identified as Parrotfish (Mean%±SE) Total Mislabeled Fillets (Mean%±SE)
Restaurant 3 34/29* (23/22) 0±0 28±32** - 32±33
Fish Market 4 15 (11) 7±9 - 9±10** 53±20** - 80±20
Co-op 7 39 (20) 0±0 34±50** - 54±50
Supermarket 7 24 (19) 10±25** - 21±25 33±34** - 50±37
* 7 of these samples were confiscated from restaurants by the Belize Fisheries Department and the market label was not known. These samples were only used to calculated proportions of parrotfish.
** Mean calculation assumed that fillets identified as the same species at an individual vendor were cut from one fish.
The proportion of total mislabeled samples was significantly lower in June 2011 than in all other sampling periods; however, the proportion of fillets identified as parrotfish was not significantly different between sampling periods when fillets were treated as individual fishes and when fillets of the same species were treated as one fish (Table 1.3). Fish
mislabeling and parrotfish sold in local markets increased from November 2009 to May 2010 and then decreased from May 2010 to June 2011.
Discussion
many parts of the world (Baker et al. 2007, 2008, Wong and Hanner 2008, Ardura et al. 2010, Garcia-Vazquez et al. 2011, Marko et al. 2011).
Table 1.3: Summary of Fish Mislabeling by Sampling Period.
The proportion of total mislabeled samples was significantly lower in June 2011 when compared to proportions calculated for all other sampling periods (p<0.004). The proportion of fillet identified as parrotfish was not significantly different between samplings periods.
Sampling Period
Number of Samplings
Number of fillets (minimum number of individual fishes) Fillets Identified as Parrotfish (Mean%±SE) Total Mislabeled Fillets (Mean%±SE)
November 2009 5 22 (15) 0±0 53±34** - 64±34
May 2010 5 22 (14) 14±19** - 23±29 71±23** - 82±17
October 2010* 6 39/32 (29/28) 5±10 - 8±17** 63±20** - 72±23
June 2011 4 28 (17) 0±0 4±3 - 6±4**
* 7 of these samples were confiscated from restaurants by the Belize Fisheries Department and the market label was not known. These samples were only used to calculated proportions of parrotfish.
** Mean calculation assumed that fillets identified as the same species at an individual vendor were cut from one fish
Low proportions of parrotfish were detected in Belize City (2%-4%), Placencia (0%), and Punta Gorda (0%) while proportions were higher in Dangriga (20%) and San Pedro (33%-43%). Proportions of mislabeling were relatively consistent among towns except for Punta Gorda where no mislabeling was detected. Local fishing culture, population size, and tourism activity varies between towns, which may provide insight into proportional
fishing grounds; therefore, it is difficult to determine where the fishermen in each town are harvesting.
San Pedro, is the main town on Ambergris Caye, and the most popular tourist
destination in Belize. Ambergris Caye generates the highest national hotel revenue in Belize. Fishermen on Ambergris Caye mostly sell their catch directly to restaurants and hotels. Placencia is the fastest growing tourist destination and generates the second highest national hotel revenue. The number of fishermen in Placencia has decreased by approximately 95% (Noella Gray et al. 2010).
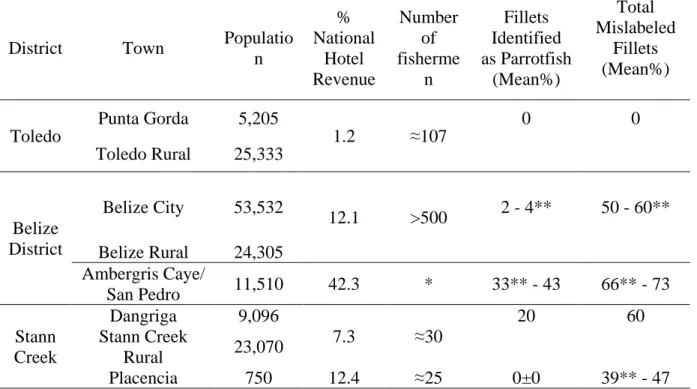
Table 1.4: Town Tourism and Population Statistics
District Town Populatio
n % National Hotel Revenue Number of fisherme n Fillets Identified as Parrotfish (Mean%) Total Mislabeled Fillets (Mean%) Toledo
Punta Gorda 5,205
1.2 ≈107
0 0
Toledo Rural 25,333
Belize District
Belize City 53,532
12.1 >500 2 - 4** 50 - 60** Belize Rural 24,305
Ambergris Caye/
San Pedro 11,510 42.3 * 33** - 43 66** - 73
Stann Creek
Dangriga 9,096
7.3 ≈30
20 60
Stann Creek
Rural 23,070
Placencia 750 12.4 ≈25 0±0 39** - 47
* data not available
Belize City is the largest town in Belize and main port of entry, but only ranks third in national hotel revenue. Fishermen from all over Belize come to Belize City to sell their catch to the two major fishing co-operatives, local fish markets and restaurants. Dangriga is the cultural center of the Garifuna people and with the surrounding rural areas ranks fourth in national hotel revenue. Fishermen sell their catch in one fish market in Dangriga and directly to restaurants and hotels. Punta Gorda is a small fishing village and with the surrounding rural areas generates the lowest national hotel revenue. Approximately 107 fishermen are based out of Punta Gorda (Heyman and Graham 2000). Fishermen sell their catch in one fish market in Punta Gorda, one small co-operative and directly to restaurants and hotels.
Although proportional differences were not significant, our data show that high levels of mislabeling are associated with towns that have relatively high tourist activity (San Pedro, Placencia, and Belize City). In contrast, a high level of mislabeling was also found in
Dangriga, which has relatively low tourist activity. Small sample size may account for the high level of mislabeling in Dangriga. Punta Gorda has relatively low tourist activity and a low level of mislabeling. Tourist activity may be increasing the demand for snapper and grouper fillet and thereby increasing mislabeling.
Sufficient data was not available to calculate a national average of harvested
(28%) harvested from 2005 to 2008 at Glover’s Reef Marine Reserve (p< 0.001). The proportion of parrotfish was much higher in San Pedro (43%) and Dangriga (20%). A small sample size may account for the relatively high percentage of parrotfish fillets sold in Dangriga. Parrotfish fillets were also found in Belize City at a much lower frequency (2%). Although overall compliance with the ban seems to be fairly high, spatial variation in the proportion of parrotfish fillets indicates a need for stronger enforcement in San Pedro and possibly Dangriga. Fisheries officers have a strong presence in Belize City and Placencia. These towns have low proportions of parrotfish in the markets suggesting that the presence of enforcement officers may be discouraging parrotfish marketing.
Snapper and grouper population declines have reduced the availability of snapper and grouper in Belize, forcing fishermen to supply the high demand for these target species with alternative fish species (Sala et al. 2001, Graham et al. 2008, RT et al. 2009, Paddack et al. 2009, Stallings 2009a, Mumby et al. 2011). We identified most of the mislabeled fillet samples as Labridae (hogfish), Scaridae (parrotfish), and Balistidae (triggerfish) (Fig. 3). Hogfish - a wrasse - is a popular fish in Belize and is often referred to as a hog snapper throughout the Greater Caribbean region. Culturally, labeling hogfish as a snapper would not be considered mislabeling. However, for the purposes of fisheries management, it is
undesirable, but are less expensive than snapper and grouper.
The main incentives for fish mislabeling are meeting consumer demand and increasing profits. The supply chain in Belize is fairly short. Belizean fishermen sell their catch directly to locals in local fish markets, to co-operatives who then export catch or sell to local businesses, or directly to restaurants and hotels. It is unclear where along the supply chain most mislabeling is occurring and it is possible that vendors are unknowingly
Conclusions and Recommendations
In Belize, recovery of fragile coral reef ecosystems would support the local economy by directly benefiting tourism and fishing industries. Random fillet analysis would provide additional catch data that could be used to identify herbivorous fish sold in markets.
CHAPTER 2: NATIONAL FISHING BAN PROMOTES RECOVERY OF PARROTFISH POPULATIONS ON CARIBBEAN CORAL REEFS
Introduction
Species loss due to overfishing leads to potentially devastating shifts is species composition particularly in reef systems with limited functional diversity (Roberts 1995a). The region-wide mass mortality of the black sea urchin (Diadema antillarum) in 1983/84 resulted in the loss of a keystone grazer on Caribbean coral reefs leaving parrotfishes (Scarus sp. and Sparisoma sp.) as one of the few herbivores capable of controlling the abundance of fleshy
Parrotfish biomass at Glover’s Reef marine reserve declined by 41% from 2002 to
2008/09, with a major decline in the large and dominant fish herbivore, the Stoplight
parrotfish (Sparisoma viride) (Mumby et al. 2012). Concurrently, macroalgal cover has
increased across the BBR since the late 1990s from roughly 10% to 50% (McClanahan and Muthiga 1998, McClanahan et al. 1999). With D. antillarum functionally extinct in Belize and recovering at very slow rates and evidence that MPAs may not be effective at restoring herbivorous fishes (Huntington et al. 2011), resource managers implemented a national ban on herbivorous fish harvesting in April 2009. The new regulation prevents the harvesting of any species of parrotfish (Scarids) or surgeonfish (Acanthurids) nationwide (Statutory Instrument No. 49 of 2009).Parrotfish comprised an average of 28% of the catch at Glover’s
Reef in Belize from 2005 to 2008 (Wildlife Conservation Society 2010). Genetic testing revealed that only 7% of fish fillets collected in five major towns in Belize from 2009 to 2011 were parrotfish suggesting a decrease in parrotfish harvesting following the ban (Cox et al. 2013).
age (approximately 1-2 years) and spawn year round (Robertson and Warner 1978). These life history traits may improve their potential to recover relatively quickly from overfishing (Adams 1980).
The rate of population recovery is also directly correlated with the extent of population decline, fishing mortality during recovery, intrinsic rate of increase, and exploitation history (Neubauer et al. 2013). Recovery can be predictable and achievable within a decade for fish populations with average exploitation histories and intrinsic rates of increase if fishing mortality is rapidly reduced prior to collapse (Neubauer et al. 2013). However, reducing fishing pressure may not always result in the recovery of depleted species potentially due to an Allee effect, a phenomenon characterized by reduced reproductive success resulting from very low population density (Kuparinen et al. 2014). For example, most Northwest Atlantic cod (Gadus morhua) populations collapsed in the early 1990s due to overexploitation (Hutchings and Myers 1994) and few populations have exhibited signs of recovery despite significant reductions in fishing pressure (Hutchings and Rangeley 2011). Results of model simulations predicting the recovery of Northwest Atlantic cod populations suggest that Allee effects not only slowed populations recovery but also increased the uncertainty of recovery time (Kuparinen et al. 2014).
If overharvesting was the prime cause of the decline of herbivores, the ban on
herbivorous fish harvesting should lead to some extent of ecosystem recovery measured first
by an increase in parrotfish density and biomass. The extent of ecosystem recovery (i.e.,
fishes on algae communities in the absence of D. antillarum. In this paper, we first assess the
effect of the ban and other factors potentially influencing parrotfish density after 4 years of
ban establishment, and second, we predict the recovery response of S. viride over time using
a size structured model and then compare model projections to observed post-ban changes in
parrotfish demography (Crouse et al. 1987, White et al. 2010b, 2011). S. viride was chosen as
a model species because they are one of the most abundant species on the BBR, one of the
most targeted parrotfishes, and sufficient data required to conduct model simulations is
available on life history traits such as growth and mortality rates.
Methods
Fish Censuses
We monitored reef fish communities at 16 sites (15-18 m) along the BBR during May and June in 2009, 2010, 2012 and 2013 (Fig. S1, Table S1). Sites were selected to maximize spatial coverage along the fore reef track, include a range of protection zones, and to coincide with sites monitored in previous years by local NGOs. Monitoring sites included (a) fully-protected reserves in which all fishing is banned (Conservation Zone 1), (b) reserves where some fishing and extractive activities are allowed (Conservation Zone 2) and (c) unprotected reefs on which fishing is permitted (None). To minimize habitat variability of survey sites, we only surveyed spur-and-grove reef formations at each site and focus on Orbicella (former Monstastrea) dominated habitat. Refer to Appendix S1 for additional details regarding
Statistical Analysis
We used linear mixed effects models to test the effect of the ban on total parrotfish biomass and density annually over the five-year monitoring period. We also used generalized linear mixed effects models to test the effect of the ban on individual parrotfish species and to test the effect of the number of mature individuals on juvenile density in the following year. Total parrotfish density (log-transformed) and parrotfish biomass were modeled with a Gaussian distribution and identity link through a linear mixed effect model. The density of each individual parrotfish species was modeled with an inverse Gaussian distribution through a generalized linear mixed effects model. The number of years following ban implementation (i.e., post 2009) and 10 covariates that could influence parrotfish biomass and density were coded as fixed effects and sites were coded as random effects. Covariates included protection status (C1, C2 or none), human population density within 50 km radius of each site, reef structural complexity, reef area and mangrove perimeter within 10 km of each site, minimum average sea surface temperature (2002-2011), wave exposure, predator biomass, macroalgal cover, and average oceanic net primary productivity (2002-2012). Refer to Appendix S2 for details regarding covariate data collection. To evaluate collinearity among all explanatory variables, we calculated the variance inflation factors (VIF). We sequentially removed each covariate for which the VIF value was above 2 (Graham 2003). Wave exposure and
protection status were sufficiently correlated to compromise interpretation when modeled together (Spearman rank correlation rs =0.50): therefore, we modeled these covariates
with a delta Akaike’s Information Criterion corrected (AICc) for small samples of less than 2. Homogeneous and normal distribution errors of final models were confirmed in the plot of residuals against predicted values and quantile-quantile plots, respectively (Zuur et al. 2009). Spline spatial correlograms were plotted to corroborate that the final model residuals were not spatially autocorrelated (Zuur et al. 2009). All analyses were performed in R v.2.15.2 (R Core Team 2013) using the package nlme v.3.1-113 for the linear mixed-effect models, lme4 v.0.99-2 for generalized linear mixed-effect models and MuMin v. 1.9.13 for the model averaging.
Stage-Structured Model
To predict parrotfish population recovery we developed a closed population stage-structured model based on recruitment rate, growth rate, and natural survival rate of individuals in four stage classes. We assumed a closed population because adequate recruitment data is not available to build a reliable open population model.
Density data was categorized into four stage classes: (1) juveniles 0-10 cm, (2) sub-adults 11-20 cm, (3) sub-adults 21-30 cm, and (4) large sub-adults 31-50 cm. For each stage class, we estimated the recruitment (R), the probability of surviving and growing into the next stage size class (G) and the probability of surviving and remaining in the same stage (P). We used the best available vital parameters taken from the literature or calculated parameters based on our observed density data (Table 1). The resulting stage-based projection model is as follows:
A= �
𝑃1 𝑅2 𝑅3 𝑅4
𝐺1 𝑃2 0 0
0 𝐺2 𝑃3 0
0 0 𝐺4 𝑃4
The transition probabilities G, and P, were estimated using Equation 1 and Equation 2 (Crouse et al. 1987).
𝑃𝑖 =�1−𝑝𝑖
𝑑𝑖−1
1−𝑝𝑖𝑑𝑖 � 𝑝𝑖 (1)
𝐺𝑖 = �𝑝𝑖
𝑑𝑖�(1−𝑝𝑖)
1−𝑝𝑖𝑑𝑖 (2)
where pi, is the stage-specific survival probability and di is the stage duration (in years). We calculated the stage duration (di) using the von Bertalanffy equation:
𝐿𝑖𝐿𝑡 =𝐿∞(1− 𝑒−𝑘(𝑑𝑖)𝑒−𝑘(𝑡𝑛−𝑡𝑜)), (3)
where L∞ is the asymptotic maximum size, k is the growth rate, and 𝐿𝑖 is the change in length over di (Table 2.1).
Table 2.1: Life History Traits for Stoplight Parrotfish, Sparisoma viride S=survival rate, R=recruitment rate
Size Class S (%/yr)a R (#/yr) Growth Rate (#/yr)b Asymptotic maximum size (cm)c
Duration in size class (yr)
ce bd,e
0-5 cm 44 0 0.45 35.7 0.28 0.0004 2.93
6-10 cm 44 0 0.45 35.7 0.39 0.0004 2.93
11-20 cm 54 0.034 0.45 35.7 1.10 0.0004 2.93
21-30 cm 81 0.499 0.45 35.7 2.95 0.0004 2.93
31-50 cm 86 1.337 0.45 35.7 5.28 0.0004 2.93
a. van Rooij and Videler1997 b. Choat et al 2003
c. Chaot et al 2003
d. Bohnsack and Harper 1988 e. Parameters in equation R =cTLb
rates estimated from S. viride populations in Bonaire, Netherlands Antiles in 1997 (van Rooij and Videler 1997) because natural survival rates have not been estimated for S. viride
populations in Belize. Natural survival rates are dependent on numerous factors including predation pressure, resource limitation, and competition (Shulman and Ogden 1987, Hixon 1991, Carr and Hixon 1995, Stewart and Jones 2001). We acknowledge that natural mortality rates for S. viride in Belize may differ from those estimated in Bonaire due to variation in ecological or environmental conditions; however, estimating parrotfish mortality at each size class in Belize was out of the scope of this study. Survival rate for the 0-10 cm size class was estimated by calculating the proportion of individuals recorded in the 0-10 cm class size that were again recorded in the 11-20 cm size in the following year. S. viride were estimated to spend approximately 8 months in the 0-10 cm size class and 1 year in the 11-20 cm size class; therefore, the juveniles that survived would have grown into the next size class by the following year.
Population Projection
2010 and used 2010 size class densities as the initial population vector to predict long-term population dynamics.
This type of model has asymptotic (i.e., long-term) behavior described by the
dominant eigenvalue (λ) of A: geometric growth (λ > 0) or decline (λ < 0). We examined the resulting stable size distribution (SDD), and the elasticity of λ to parameter changes. In the long term, the matrix will converge to a stable size distribution, i.e., a consistent proportion of individuals in each age class, given by the dominant right eigenvector of A. The model predicted the number of years to reach SSD, which was used as an estimate for the time required for S.viride populations to recover. We identified the matrix parameters that are most important contributors to λ through an elasticity analysis, which measures the change in λ in response to a proportional change in the parameters.
This model does not predict the stable nonzero equilibrium density because it lacks density dependence. However, this is adequate for describing the initial transient response of a population that is at low density because of harvesting (White et al. 2013). Population modeling was performed in R v.2.15.2 (R Core Team 2013) using the package popbio v.2.4
Results
parrotfish (Scarus iseri), princess parrotfish (Scarus taeniopterus), stoplight parrotfish (S.viride), and redband parrotfish (Sparisoma aurofrenatum).
Overall parrotfish density increased by 188% from 2009 (0.17 (±0.01)
individuals/m2) to 2013 (0.50 (±0.05) individuals/m2). The most substantial increase of 269% occurred between 2009 and 2010 and the average annual increase over the 5-year monitoring period was 84%. Density changes in the five size classes varied by species (Fig. 1). S. iseri density was greater in each year following 2009 for the 6-20 cm size classes (p<0.01 for each year) and greater in 2010 and 2013 for the 0-5 cm size class (p<0.01 and p<0.05,
respectively). S. taeniopterus density was greater in 2012 and 2013 for the 6-10 cm size class (p<0.01 for each year) and the 11-20 cm size class (p<0.05 for each year). S. taeniopterus density was greater in 2010 for the 21-30 cm size class (p<0.01) and subsequently decreased in 2012 , while S.viride density increased in the 0-10 cm size classes in 2012 (p<0.01) and then decreased in 2013. The 11-20 cm and 21-30 cm size classes densities show similar trends with density increasing in 2010 and 2012 (p<0.01) and decreasing in 2013 for S. viride. S. viride showed an increase in the largest size class (31-50 cm) in 2013 (p<0.05)
Figure 2.1: Mean density by class size for four species of parrotfish across 16 reefs from 2009 to 2013.
Error bars represent the 95% confidence interval. Significant increases from densities observed in 2009 are identified by * or ** (* indicates a p-value of <0.01 and ** indicates a p-value of <0.05).
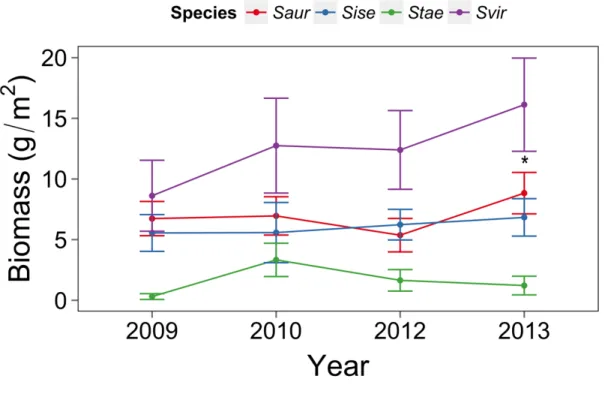
monitoring period. S. taeniopterus, S. aurofrenatum and S. iseri contributed 6%, 26%, and 23% to the total parrotfish biomass, respectively. We found a significant increase in S. viride biomass from 2009 (8.62±1.49) to 2013 (16.12±1.96) (p<0.01), but did not find increases in biomass for the other three species (Fig 2.2.).
Figure 2.2: Mean Biomass (± 95% confidence interval) by class size for four species of parrotfish across 16 reefs from 2009 to 2013.
S. viride biomass increased from 2009 to 2013 (p<0.05) indicated by * in the figure.
population density (Density Model A) and predator biomass, population density, mangrove area, and macroalglal cover (Density Model B) as predictor variables. These models revealed that each year following implementation of the harvesting ban had a positive effect on total parrotfish density (p<0.02 for each year) and a positive effect on parrotfish biomass in 2013 (Fig. 2.3). Wave exposure had a negative effect on both parrotfish density and biomass, human population density and macroalgal cover had a weak negative effect on parrotfish biomass, and predator biomass had a weak positive effect on parrotfish biomass (Fig. 2.3, p<0.001, p=0.04, p=0.04, and p=0.02, respectively). Parrotfish density increased at 12 out of 16 sites, but protection status had no effect on parrotfish density or biomass.
For S. viride, the SSD was projected as 39.7% (0-10 cm), 17.6% (11-20 cm), 18.7% (21-30 cm), and 23.9% (31-50 cm). The elasticity analysis of the matrix parameters showed that S. viride populations were more sensitive to adult and large adult survival (21-50 cm size class) than to changes in juvenile survival or recruitment rates. The closed population
Figure 2.3: Coefficient estimates (mean ± 95% confidence interval) resulting from linear mixed effects models testing the effect of the harvesting ban and 10 covariates on parrotfish density and biomass over time.
Covariates identified here are the variables included in the final averaged models. Solid circles represent coefficient values from the model that included wind exposure as a fixed effect and the open diamonds represent coefficient values from the model that included protection status as a fixed effect. These variables were highly correlated (e.g., rs=0.50) and
could not be run in the same model.
Discussion
Restoring parrotfish populations is the primary management strategy for reducing macroalgal cover and reestablishing coral dominance on Caribbean coral reefs. Our results suggest reduced fishing pressure achieved through the harvesting bans Belize has
Figure 2.4: Comparison of stage-structured population model predictions (light grey) and data collected during monitoring surveys (dark grey) for S. viride biomass (mean ± 95% confidence interval).
We found that density increases for four parrotfish species and an increase in biomass for one species over the five-year monitoring period following the ban on parrotfish
harvesting. We accounted for other covariates that can affect fish population dynamics over time and our statistical models suggest the observed initial recovery could be due to the ban.
Prior to the ban on parrotfish harvesting, fishermen typically used spear guns to target parrotfish greater than 20 cm. Being the largest of the four abundant parrotfish species
decreased fishing pressure for S. viride and preliminary evidence that the ban has been effective for this species (Fig 2.1).
We observed increases in density for the 0-20 cm size classes for S. taeniopterus, S. aurofrenatum and S. iseri (Fig. 2.1). These sizes and species are not typically targeted by
spear fishermen. However, parrotfish greater than 5 cm, particularly those between 15 and 34 cm, are vulnerable to fish traps (Recksiek et al. 1991, Rakitin and Kramer 1996, Mumby et al. 2006a). Observed increases in these species could suggest a decrease in individuals being caught in fish traps or an increase in juvenile survival rate.
The average length at maturity for most parrotfish species is between 15 and 17 cm (Reeson 1983). Therefore, an increase in the 11-20 cm size class would increase the
population reproductive potential possibly explaining increases in the 0-10 cm size classes in the following year. However, we did not find a relationship between the number of mature individuals and the number of juveniles (0-10 cm) in the following years on a regional scale (p> 0.14 for each species). Juvenile density is not only influenced by the number of mature fishes, but also by variability in natural mortality due to environmental factors and predation pressure (Hixon and Carr 1997) which most likely explains the temporal variation we observed in juveniles.
S. viride, population projection models predicted that a minimum of 9 years is
managers with a goal for population recovery. If parrotfish harvesting ceased in 2010 (with minimal poaching), managers should expect to see 0.06±0.01 individuals/m2 or 29.7±3.9 g/ m2 of large (>21 cm) of S. viride by 2019. Projected biomass values can be used by managers to assess population recovery by comparing the observed biomass of large individual S. viride to the projected biomass. For instance, the population model predicted S. viride
biomass to be 21.3±2.8 g/m2 in 2013. The S. viride biomass observed in 2013 (17.9±2.7 g/m2) was not significantly different from that predicted (Welch t-test, t=-0.959, p=0.347). Based on this comparison, S. viride biomass is consistent with the population projection models suggesting that these populations are beginning to recover (Fig. 2.4).
Our results suggest that the ban on parrotfish harvesting has had a positive effect on parrotfish density and biomass over a five-year period. This indicates that fishing pressure has been reduced as a result of the harvesting ban. For the ban to fully accomplish its goals parrotfish population recovery must result in decreased macroalgal cover and coral
CHAPTER 3: ESTABLISHMENT OF MARINE PROTECTED AREAS ALONE DOES NOT RESTORE CORAL REEF COMMUNITIES
Introduction
This decline in coral cover was followed by a drastic increase in benthic macroalgae resulting from a combination of interrelated factors including: 1) increased availability of habitable substrate (Aronson and Precht 2001), 2) a regional decrease in grazing pressure caused by a decline of the keystone sea urchin Diadema antillarum (Hughes 1994, Woodley 1999), and 3) overfishing of herbivorous/detritivorous including parrotfish (scarids) and surgeonfish (acanthurids) (Bellwood et al. 2004). Large amounts of macroalgae on a reef can suppress coral growth and recruitment through several mechanisms including shading, abrasion, allelochemicals, limiting suitable settlement substrate (e.g., by covering encrusting coralline algae that enhance coral settlement) and potentially via the enhancement of
microbes and disease (River and Edmunds 2001, Kuffner et al. 2006, Smith et al. 2006, Box and Mumby 2007, Rasher and Hay 2010). The ecological role of grazers, including urchins and herbivorous reef fishes, and their importance in controlling macroalgal growth and enhancing coral recruitment has been well documented since the mid-1980’s (Hay 1984, Carpenter 1986, Lewis 1986, Williams and Polunin 2001, Carpenter and Edmunds 2006, Mumby 2006, Mumby et al. 2007).
reductions in fishing pressure and destructive fishing practices, increases in organismal biomass and diversity, and increases in fish stocks in adjacent fisheries due to larval export and adult migration(Lester et al. 2009, Harrison et al. 2012). Target fish populations are capable of responding quickly to reductions in fishing pressure resulting in increased density
and biomass (Polunin and Roberts 1993, Mosquera et al. 2000, Côté et al. 2001, Halpern
2003). However, these benefits are not realized for some species because many MPA
networks do not link larval supply and settlement areas or lack adequate enforcement
(Roberts 1995b, Mora et al. 2006, Huntington et al. 2011).
Although reduced fishing pressure within MPAs has lead to increased density and
biomass of some fish species (Roberts 1995b, Aburto-Oropeza et al. 2011), there is little
conclusive evidence that protection from fishing promotes positive effects on coral
community structure under all environmental conditions (Mumby and Steneck 2008). For
example, within the Exuma Cays Land and Sea Park, Bahamas, increases in coral cover over
a 2.5 year period were higher at protected sites than fished sites. However, macroalgal cover
was extremely low at these sites (3.1±1%) throughout the duration of the study (Mumby and Harborne 2010). In contrast, in regions where macroalgal cover is higher such as Belize and
Florida, MPAs have not influenced coral or macroalgal cover (McClanahan and Muthiga
1998, McClanahan et al. 1999, Huntington et al. 2011, Toth et al. 2014). For instance,
no-take areas within the Florida Keys National Marine Sanctuary have not promoted an increase
in coral cover or a decline in macroalgal cover despite having a higher abundance of adult
herbivorous fishes than fished reefs (Kramer and Heck 2007, Toth et al. 2014). Similarly,
effect on herbivorous fish abundance, macroalgal cover, or coral cover (Huntington et al.
2011). This failure of MPAs alone to promote herbivory and coral assemblage recovery suggests that new fisheries policies may be required to restore coral reef ecosystems (Mumby and Steneck 2008).
The Belize Barrier Reef has one of the most extensive MPA networks in the
Caribbean consisting of 18 MPAs that cover approximately 2,525 km2 of territorial waters. Two of these MPAs (Glover’s Reef Marine Reserve and Hol Chan Marine Reserve) have been the focus of most reserve effect studies in Belize but have not consistently promoted positive effects on reef communities (Polunin and Roberts 1993, Roberts and Polunin 1994, McClanahan et al. 2001, Huntington et al. 2011). In 2009, the Belize Fisheries Department implemented a national ban on herbivorous fish harvesting as an additional conservation strategy to restore herbivorous fish populations. Here, we test the effectiveness of Belize’s national MPA network in protecting and restoring reef fishes, as well as promoting the recovery of benthic communities at a regional scale. The uniqueness of our study is that we accounted for several abiotic and biotic variables that could affect coral reef community structure and potentially MPA success that have not been considered in previous studies allowing us to identify other key characteristics contributing to reef health and the
Methods
Study locations
We monitored reef fish communities at 16 fore reef sites (15-18 m) along the Belize Barrier Reef during the summer months of May and June in 2009, 2010, 2012 and 2013 (Appendix C, Table 3.1). Sites were selected to maximize spatial coverage along the fore reef, include a range of protection zones, and to coincide with sites monitored in previous years by local NGOs. To minimize habitat variability of survey sites, we only surveyed spur-and-grove reef formations at each site and focus on Orbicella (former Monstastrea)
dominated habitat. Survey sites included (a) fully-protected MPAs where only non-extractive sport fishing was permitted (Conservation Zone 1); (b) partially protected MPAs where special restrictions were in place that include limited fishing licenses and banned use of traps, nets, and long-lines (Conservation Zone 2); and (c) unprotected reefs where fishing was unrestricted except for herbivorous fishes and Nassau grouper (see Belize National Statutory Instrument No. 49 of 2009) (control) (Appendix C, Table 3.1). Information regarding zoning of protected areas was provided by the Belize Fisheries Department (www.fisheries.gove.bz).
enforcement were those with irregular patrols, poaching, insufficient legal outcomes, and a high level of concern from the local community.
Fish surveys
We performed visual fish censuses to estimate reef fish species composition and density using a modification of the standard Atlantic and Gulf Rapid Reef Assessment (AGRRA) v5.4 techniques (Lang et al. 2010). Fish species were identified, counted, and sizes were estimated in 10 cm intervals. Total lengths were recorded for species with rounded
or truncated caudal fins, while fork lengths were recorded for all other species. At each site, we recorded fishes within 2 x 30 m transects for individuals < 40 cm in length and within 10 x 50 m transects for individuals > 40 cm in length. We also counted and identified all smaller fish (< 5 cm) within 15x1 m transects. We deployed six to eight belt transects per site at least 10 meters apart and conducted surveys during daylight from 0800 to 1600hr. Experienced and trained divers performed all fish surveys. Divers were trained by estimating fish sizes in the water against artificial fish models of known size and comparing these sizes to those estimated by a diver experienced in fish surveys. Fish biomass was calculated through the allometric weight-length relationship, W = aTLb, where W is the weight of each individual (in grams), TL is the length of each fish (in cm) estimated from visual surveys, and the
parameters a and b are species specifics (Froese and Pauly 2011). When these variables were not available, we used the values of congeneric species of similar size and morphology. We
52
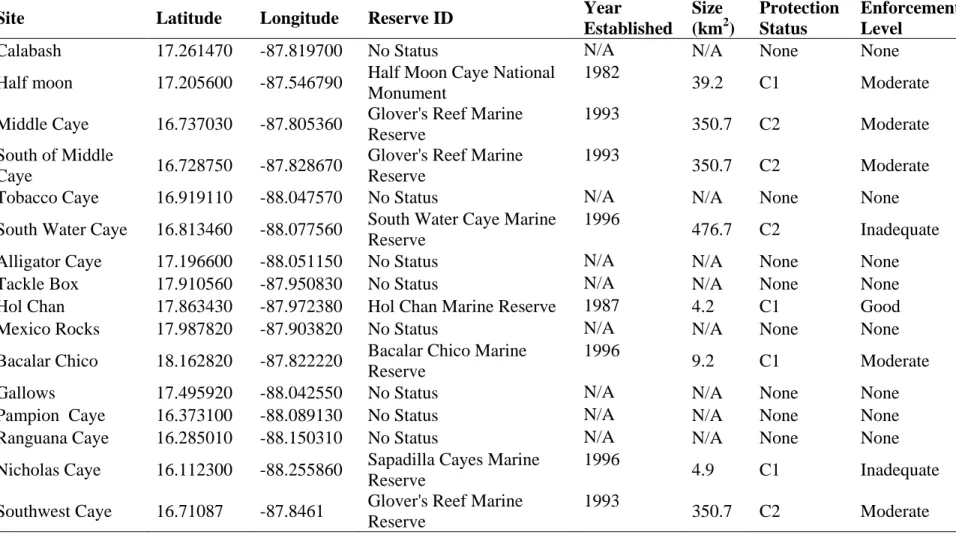
Table 3.1: Monitoring Site Details
Site Latitude Longitude Reserve ID Year
Established
Size (km2)
Protection Status
Enforcement Level
Calabash 17.261470 -87.819700 No Status N/A N/A None None
Half moon 17.205600 -87.546790 Half Moon Caye National Monument
1982
39.2 C1 Moderate
Middle Caye 16.737030 -87.805360 Glover's Reef Marine Reserve
1993
350.7 C2 Moderate
South of Middle
Caye 16.728750 -87.828670
Glover's Reef Marine Reserve
1993
350.7 C2 Moderate
Tobacco Caye 16.919110 -88.047570 No Status N/A N/A None None
South Water Caye 16.813460 -88.077560 South Water Caye Marine Reserve
1996
476.7 C2 Inadequate
Alligator Caye 17.196600 -88.051150 No Status N/A N/A None None
Tackle Box 17.910560 -87.950830 No Status N/A N/A None None
Hol Chan 17.863430 -87.972380 Hol Chan Marine Reserve 1987 4.2 C1 Good
Mexico Rocks 17.987820 -87.903820 No Status N/A N/A None None
Bacalar Chico 18.162820 -87.822220 Bacalar Chico Marine Reserve
1996
9.2 C1 Moderate
Gallows 17.495920 -88.042550 No Status N/A N/A None None
Pampion Caye 16.373100 -88.089130 No Status N/A N/A None None
Ranguana Caye 16.285010 -88.150310 No Status N/A N/A None None
Nicholas Caye 16.112300 -88.255860 Sapadilla Cayes Marine Reserve
1996
4.9 C1 Inadequate
Southwest Caye 16.71087 -87.8461 Glover's Reef Marine Reserve
1993
Benthic surveys
Benthic cover was estimated using point-intercept methods according Lang et al. (Lang et al. 2010). At each site, six 10 m lead-core transect lines were laid on the substrate along the spur and grove formation (45-50 ft deep) spaced approximately 10 m apart. Benthic groups were identified at every 10 cm intervals along the 10 m transect line. We broadly categorized the benthos in hard corals, macroalgae, crustose coralline algae, turf algae, zoantids, sponges, gorgonians, rubble, sand, pavement, and other live categories that included bryozoans, anemones, and corallimorpharians. Hard corals and macroalgae were identified up to species and genus, respectively. Benthic transects occurred along the first 10 m of the fish transects.
Covariates
To examine the effectiveness of the Belize Barrier Reef MPA network, we examined four reef community indicators of reef performance and health (predator and parrotfish biomass, coral and macroalgae cover). Additionally, we accounted for 8 additional variables that could influence coral reef community structure and potentially compromise management efforts including sea surface temperature anomalies, average oceanic net primary
Data Analysis
We used linear mixed effects models to test the effect of protection status and
enforcement level of Belize’s MPAs on predatory fish and parrotfish biomass, and coral and macroalgal cover. We generated a global model with protection status, enforcement level and a subset of 12 covariates that could influence fish biomass or benthic community structure coded as fixed effects and sites coded as random effects. To evaluate collinearity among all explanatory variables and generate models without correlated variables, we calculated the variance inflation factors (VIF) and sequentially removed each covariate for which the VIF value was above 2 (Graham 2003). Among the covariates, wave exposure, protection status, and enforcement level were sufficiently correlated to compromise interpretation when modeled together (Spearman rank correlation rs > 0.50), therefore, we modeled these
covariates separately (Graham 2003). Predatory fish biomass was x^(1/6) transformed and coral cover was square root transformed to improve homogeneity of variance and model fit. Numerical covariates were standardized and centered (mean of zero and standard deviation of one) to aid in model comparisons. Meaningful interactions and quadratic terms were included in exploratory models.
Based on the global model we ran all possible combinations of co-variables fitted by maximum likelihood to identify the top models that best explain the response indicators. Final models (those with a ΔAICc < 2) were then run and averaged fitted by restricted
Homogeneous and normal distribution errors of final top models were confirmed in the plot of residuals against predicted values and by using the normal scores of standardized residuals deviance, respectively (Zuur et al. 2009). Spline spatial correlograms were plotted to corroborate that the final model residuals were not spatially autocorrelated (Zuur et al. 2009). All analyses were performed in R v.2.15.2 (R Core Team 2013) using the package nlme v.3.1-113 for the linear mixed-effect models and MuMin v. 1.9.13 for the model
averaging.
Results
We found no difference between coral cover or macroalgal cover at protected or well-enforced sites and control sites between 2009 and 2013 (Table 3.2, Fig 3.3 and Fig 3.4). While parrotfish biomass and predator biomass increased over time (p<0.001, Fig 3.2), there was no difference between protected or well-enforced sites and control sites (Table 3.2, Fig 3.3 and Fig 3.4).
Table 3.2: Mean value and standard error(SE) of each response variable by protection level and enforcement level. p-value represents results of linear mixed effects models.
Response Variable Mean SE df p-value
Coral Cover (%)
Protection Status
C1 22.4 1.9 10 0.69
C2 14.5 0.9 10 0.35
None 20.6 1.3 -- --
Enforcement Level
Good 23.9 5.1 9 0.83
Moderate 14.5 1.5 9 0.79
Inadequate 19.0 1.5 9 0.50
None 20.6 1.3 -- --
Macroalgal Cover (%)
Protection Status
C1 48.1 3.1 10 0.50
C2 55.1 2.0 10 0.41
None 47.1 1.5 -- --
Enforcement Level
Good 48.2 4.6 9 0.57
Moderate 58.0 1.7 9 0.60
Inadequate 49.5 2.8 9 0.04
None 47.1 1.5 -- --
Predator Biomass (g/m2)
Protection Status
C1 29.0 12.3 10 0.42
C2 9.4 1.5 10 0.17
None 19.2 4.0 -- --
Enforcement Level
Good 17.2 8.0 9 0.30
Moderate 9.0 2.3 9 0.59
Inadequate 24.2 10.3 9 0.12
None 19.2 4.0 -- --
Parrotfish Biomass (g/m2)
Protection Status
C1 31.1 3.9 10 0.35
C2 31.9 2.8 10 0.50
None 32.7 2.4 -- --
Enforcement Level
Good 17.4 4.7 9 0.08
Moderate 34.4 5.9 9 0.93
Inadequate 33.3 2.4 9 0.93
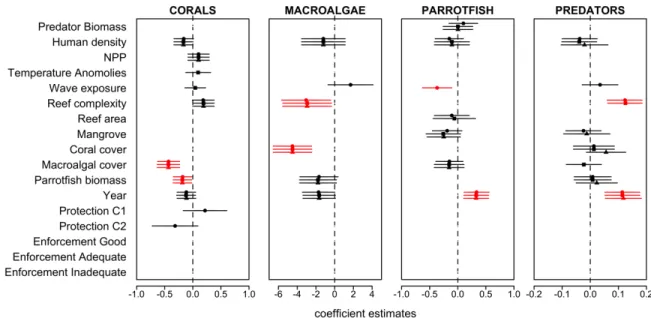
Figure 3.1: Coefficient estimates (mean ± 95% confidence interval) resulting from linear mixed effects models testing the effect of the protection status and enforcement level and 15 covariates on predatory reef fish biomass, parrotfish biomass, macroaglal cover, and coral cover.
Solid circles represent coefficient values from the model that included protection status as a fixed effect, solid squares represent coefficient values from the model that included wave exposure as a fixed effect and solid triangles represent coefficient values from the model that included enforcement level as a fixed effect. These variables were highly correlated (e.g., rs>0.50) and could not be run in the same model.
Discussion
herbivorous fishes after more than two decades of reserve establishment (Kramer and Heck 2007).
Similarly, within the Exuma Cays Land and Sea Park (ECLSP) reserve, parrotfish biomass was two times higher than in unprotected areas along the same reef tract (Mumby et al. 2006a). In Belize, fish biomass was higher in Hol Chan Marine Reserve than outside the reserve during a 1993 study (Polunin and Roberts 1993). However, not all studies report a positive effect of protection on fish communities, highlighting the important role of poaching or lack of enforcement that can compromise the performance of MPAs. For example, a recent study at Glover’s Reef Marine Reserve found that the biomass of herbivorous fishes was similar within reserve sites when compared to adjacent control sites potentially due to a lack of sufficient enforcement or increased predatory reef fishes within reserves (Huntington et al. 2011). We found no positive effect of protection or enforcement on either predatory reef fishes or parrotfishes. These results broaden the scale of the findings of Huntington et al. 2011 demonstrating that current (2009-2013) mean fish biomass within Belize’s national MPA network is not higher than that in fished areas. The large spatial extent of our
59
Table 3.3: Top linear mixed-effects models testing the effects of 15 covariates on four response variables
Among the covariates, wave exposure, protection status, and enforcement level were sufficiently correlated to compromise interpretation when modeled together (Spearman rank correlation rs > 0.50), therefore, we modeled these covariates separately
(Model A: Wave Exposure, Model B: Protection Status, Model C: Enforcement Level). The top models considered are those with ∆AICc <2. Relative variable importance (RI) is the sum of the weights of all models that contain that particular variable. Covariate abbreviations are as follows: PdB: Predator Biomass, HD: Human Density, NPP: Net primary productivity, W: Wave exposure, RC: Reef complexity, RA: Reef area, MP: Mangrove perimeter, C: Coral cover, M: Macroalgal cover, PB: Parrotfish Biomass, Y: Year, C1: Conservation zone 1, C2: Conservation zone 2. Enforcement level, distance to deep water and sea surface temperature anomalies were not retained in any of the top models.
Response
Variable PdB HD NPP W RC RA MP C M PB Y C1 C2 df logLik AICc ΔAICc wt
Coral Cover Model A
1 X X X X 7 -50.15 116.46 0.00 0.42
2 X X X X X 8 -49.49 117.80 1.34 0.21
3 X X X X X 8 -49.49 117.81 1.35 0.21
4 X X X 6 -52.41 118.41 1.95 0.16
RI 0.84 0.21 1.00 1.00 1.00 0.21
Model B
1 X X X X 7 -50.15 116.46 0.00 0.35
2 X X X X X 8 -49.49 117.80 1.34 0.18
3 X X X X X 8 -49.49 117.81 1.35 0.18
4 X X X X 7 -51.02 118.19 1.73 0.15
5 X X X 6 -52.41 118.41 1.95 0.13
RI 0.72 0.18 0.85 1.00 1.00 0.18 0.15 0.15 Model C
1 X X X X 7 -50.15 116.46 0.00 0.42
2 X X X X X 8 -49.49 117.80 1.34 0.21
60
Response
Variable PdB HD NPP W RC RA MP C M PB Y C1 C2 df logLik AICc ΔAICc wt
4 X X X 6 -52.41 118.41 1.95 0.16
RI 0.84 0.21 1.00 1.00 1.00 0.21
Macroalgal Cover Model A
1 X X X 6 -198.19 409.96 0.00 0.19
2 X X X X 7 -196.94 410.04 0.08 0.18
3 X X X X 7 -197.04 410.23 0.27 0.16
4 X X X 6 -198.45 410.49 0.53 0.14
5 X X X X X 8 -196.32 411.46 1.50 0.09
6 X X X X 7 -197.74 411.64 1.68 0.08
7 X X X X X 8 -196.42 411.67 1.71 0.08
8 X X X X 7 -197.78 411.72 1.76 0.08
RI 0.21 0.27 1.00 1.00 0.56 0.78
Model B
1 X X X 6 -198.19 409.96 0.00 0.26
2 X X X X 7 -197.04 410.23 0.27 0.22
3 X X X 6 -198.45 410.49 0.53 0.20
4 X X X X 7 -197.74 411.64 1.68 0.11
5 X X X X X 8 -196.42 411.67 1.71 0.11
6 X X X X 7 -197.78 411.72 1.76 0.11
RI 0.32 1.00 1.00 0.64 0.69
Model C
1 X X 5 -200.65 412.41 0.00 0.19
2 X X X 6 -199.61 412.80 0.38 0.16
3 X X X X 7 -198.52 413.19 0.78 0.13
61
Response
Variable PdB HD NPP W RC RA MP C M PB Y C1 C2 df logLik AICc ΔAICc wt
6 X X X X 7 -198.75 413.66 1.25 0.10
7 X X X 6 -200.05 413.68 1.26 0.10
8 X X X 6 -200.20 413.98 1.57 0.09
RI 0.53 0.24 1.00 0.70 0.67
Parrotfish Biomass Model A
1 X X 5 -230.06 471.23 0.00 0.23
2 X X X 6 -229.17 471.93 0.69 0.16
3 X X X 6 -229.44 472.46 1.23 0.12
4 X X X 6 -229.50 472.59 1.36 0.12
5 X X X X 7 -228.35 472.86 1.62 0.1
6 X X X X 7 -228.41 472.97 1.74 0.1
7 X X X 6 -229.78 473.15 1.91 0.09
8 X X X X 7 -228.52 473.20 1.97 0.09
RI 0.09 0.21 1.00 0.09 0.44 0.22 1.00
Model B
1 X X 5 -232.21 475.54 0.00 0.27
2 X 4 -233.51 475.75 0.22 0.24
3 X X X 6 -231.47 476.52 0.98 0.16
4 X X 5 -232.96 477.02 1.49 0.13
5 X X X 6 -231.93 477.45 1.91 0.10
6 X X X 6 -231.95 477.48 1.94 0.10
RI 0.10 0.10 0.63 0.29 1.00
Model C
1 X X
62
Response
Variable PdB HD NPP W RC RA MP C M PB Y C1 C2 df logLik AICc ΔAICc wt
4 X X 6 -231.47 476.52 0.98 0.18
5 X X X 5 -232.96 477.02 1.49 0.14
RI 0.11 0.59 0.32 1.00
Predator Biomass 6 -231.95 477.48 1.94 0.11
Model A
1 X X 5 5.19 0.74 0.00 0.46
2 X X X 6 5.98 1.62 0.88 0.30
3 X X X 6 5.80 1.98 1.24 0.25
RI 0.30 0.25 1.00 1.00
Model B
1 X X 5 5.19 0.74 0.00 0.61
2 X X X 6 5.98 1.62 0.88 0.39
RI 0.39 1.00 1.00
Model C
1 X 4 -0.46 9.65 0.00 0.73
2 X X 5 -0.25 11.61 1.96 0.27
Our results are also in agreement with Huntington et al. (2011) and Kramer and Heck (2007) who found no significant differences in coral cover inside and outside of Caribbean reserves. Without higher parrotfish biomass, it is not surprising that we did not observe lower macroalgal cover or higher coral cover with MPAs. However, mean macroalgal cover across protection levels, ranging from 47.1% to 55.1%, was higher than the average for the
Caribbean (approximately 23%) (Bruno et al. 2009, Jackson et al. 2014b).
Figure 3.2: Significant correlations between response variables and explanatory variables. Points are means per site.
Figure 3.3: Comparison of parrotfish biomass, predatory reef fish biomass, macroalgal cover, and coral cover within protected areas (C1 and C2) and unprotected areas. Boxplots represent means per site year.
Figure 3.4: Comparison of parrotfish biomass, predatory reef fish biomass, macroalgal cover, and coral cover by enforcement level.