THE RELATIONSHIPS BETWEEN PERFORMANCE AND ACL LOADING DURING ATHLETIC TASKS
Boyi Dai
A dissertation submitted to the faculty of the University of North Carolina at Chapel Hill in partial fulfillment of the requirements for the degree of Doctor of Philosophy in the Program of Human Movement Science.
Chapel Hill 2012
Approved by
Bing Yu, PhD
William E. Garrett, PhD, MD
Michael T. Gross, PhD, PT
Darin A. Padua, PhD, ATC
©2012 Boyi Dai
ABSTRACT
BOYI DAI: The Relationships between Performance and ACL Loading during Athletic Tasks
(Under the direction of Bing Yu, PhD)
Anterior cruciate ligament (ACL) injuries are common sports related knee
injuries. While increasing performance and decreasing ACL injury risks are both
important for athletes, the underlying relationships between performance and ACL
loading are still unknown. Studying the relationships between performance and ACL
loading can provide important information in understanding injury mechanism as well
as developing injury prevention strategies.
In the current study, eighteen male and eighteen female collegiate aged
recreational athletes conducted stop-jump and side-cutting tasks with different
performance demands and techniques. Performance including jump height,
approach speed, take-off speed, stance time, and mechanical work were evaluated
among different jumping and cutting conditions. Peak ACL forces were estimated
from an ACL loading model. ACL loading variables and peak ACL force variables
were compared among different jumping and cutting conditions. The acute effects of
performance demands on ACL loading were evaluated. The acute effects of
movement patterns that should decrease ACL loading on performance outcomes
were determined. Gender differences in lower extremity biomechanics were
ACL loading increased when the movement speed increased. Soft landing
and landing with increased knee flexion decreased ACL loading but also decreased
jump height and movement speed and increased mechanical work, which indicated
decreased performance. Males and females demonstrated different knee sagittal
plane motion.
For individuals whose priority is injury prevention but not performance,
adapting a slow movement pattern or soft landing pattern might decrease ACL injury
risks. However, fast movements might not be avoidable during real sports
competitions. The results suggest the importance of considering performance and
ACL loading as a combined unit during injury risk evaluation and injury prevention. It
is necessary to completely report the changes in performance in order to have a
thorough understanding of training effects. The gender differences might provide
information in developing gender specific ACL injury prevention programs. However,
the current study only evaluated the acute relationships between performance and
ACL loading. Long-term training effects on the relationships between performance
DEDICATION
To my grandma Chunhua Wang, my parents Yuewen Zhao and Qiji Dai, and my
ACKNOWLEDGEMENTS
I thank my advisor Dr. Bing Yu for his tremendous support and professional
mentorship during the last three years at UNC - Chapel Hill. Dr. Yu gave me
invaluable advice and suggestions in academic development as well as in personal
life. I thank all my committee members for their critical and constructive suggestions
in the completion of my dissertation. I thank Dr. Robin Queen for her help and advice
in my dissertation as well as the research projects at Duke University. I thank Dr.
William Garrett for being an outstanding clinician and researcher who set an
outstanding example for young investigators. I thank Dr. Michael Gross for
instructing me to think creatively and stay humble. I thank Dr. Darin Padua for critical
suggestions in research design and subject recruitment.
I thank Dr. Jason Gillette who has been giving me helpful advice after I left
Iowa State University. I thank Dr. Joe Myers, Mr. Jonathon Hacke, and my HMSC
TABLE OF CONTENTS
LIST OF TABLES ... xii
LIST OF FIGURES ... xvi
Chapter I. INTRODUCTION ... 1
Statement of Purposes and Hypotheses ... 8
Significances of the Study ... 9
II. REVIEW OF LITERATURE ... 12
Incidence Rates of ACL Injuries ... 12
Consequences of ACL Injuries ... 14
Physical and Psychological Consequences ... 14
Neuromuscular Control ... 16
Osteoarthritis ... 18
ACL Re-injuries ... 18
Characteristics of ACL Injuries ... 19
Non-contact Mechanism ... 19
Tasks and Timing ... 20
Gender ... 21
Age ... 22
Anterior Shear Force ... 23
Valgus / Varus and Internal / External Rotation Moments ... 25
Knee Flexion Angle ... 26
Compressive Force ... 27
Hamstring force ... 29
ACL Injury Risk Factors ... 31
External Factors ... 31
Anatomical and Hormonal Factors ... 33
Neuromuscular Control ... 35
Performance and ACL Loading ... 39
Effects of Performance Demands on Biomechanics ... 39
Effects of Changes in ACL Loading on Performance ... 42
Training Effects on Performance and ACL Loading ... 45
Summary ... 49
III. METHODS ... 50
Subjects ... 50
Instrumentations ... 51
Experiment Procedure ... 51
Data Reduction ... 59
Kinematics and Kinetics ... 59
Musculoskeletal Model ... 61
Assumptions of the Musculoskeletal Model ... 81
Sensitivity Analysis ... 87
Performance Variable ... 88
Kinematics and Kinetics that Affect ACL Force ... 89
Peak ACL Force ... 90
Data Analysis ... 91
Family-Wise Type Error Rate ... 94
Power Analysis ... 95
IV. RESULTS ... 98
Subjects ... 98
Reliability ... 99
Data Screening ... 104
Outlier ... 104
Normality... 107
Homoscedasticity ... 110
Face Validity of ACL Loading Model ... 113
Timing of peak ACL Force ... 113
Magnitude of Peak ACL Force ... 115
The Composition of Peak ACL Force ... 116
Relationship between Peak ACL Force and Knee Flexion .... 117
Sensitivity Analysis ... 117
Specific Aim 1: Effects of Performance Demands on ACL Loading . 123 Stop-Jump ... 123
Specific Aim 2: Effects of Movement Pattern on Performance ... 144
Stop-Jump ... 144
Side-Cutting ... 155
Family-Wise Type I Error Rate ... 167
Summary of Results ... 170
V. DISCUSSION ... 174
Reliability ... 174
Data Screening ... 176
Face Validity of ACL Loading Model ... 177
Timing of peak ACL force ... 177
Magnitude of Peak ACL Force ... 180
The Composition of Peak ACL Force ... 181
Relationship between Peak ACL Force and Knee Flexion ... 189
Sensitivity Analysis ... 191
Ankle Co-contraction ... 192
Hip Co-contraction ... 193
Comparisons of ACL Loading Models ... 195
Specific Aim 1: Effects of Performance Demands on ACL Loading . 200 Condition Effects ... 200
Summary ... 212
Gender Effects ... 213
Summary ... 218
Condition Effects ... 219
Summary ... 236
Gender Effects ... 237
Summary ... 240
Relationships between performance and ACL loading ... 241
Implications to Injury Risk Screening and Injury Prevention ... 245
Limitations ... 249
Significance and Recommended Future Studies ... 252
Conclusions ... 258
APPENDICES ... 262
LIST OF TABLES
Table
3.1. Drawing number of testing conditions ... 58
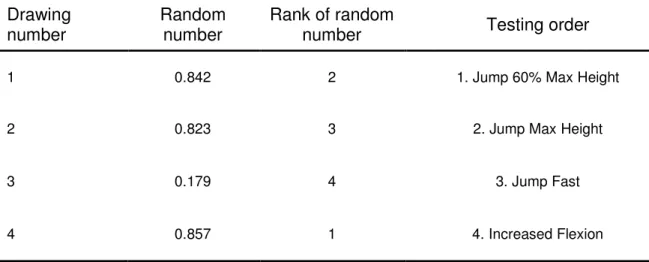
3.2. Generating random number and testing order ... 58
3.3. Previous modeling studies that estimated ACL force ... 86
3.4. Previous in vivo studies that calculated ACL strain ... 86
4.1. Means (standard deviations) of subject Information ... 98
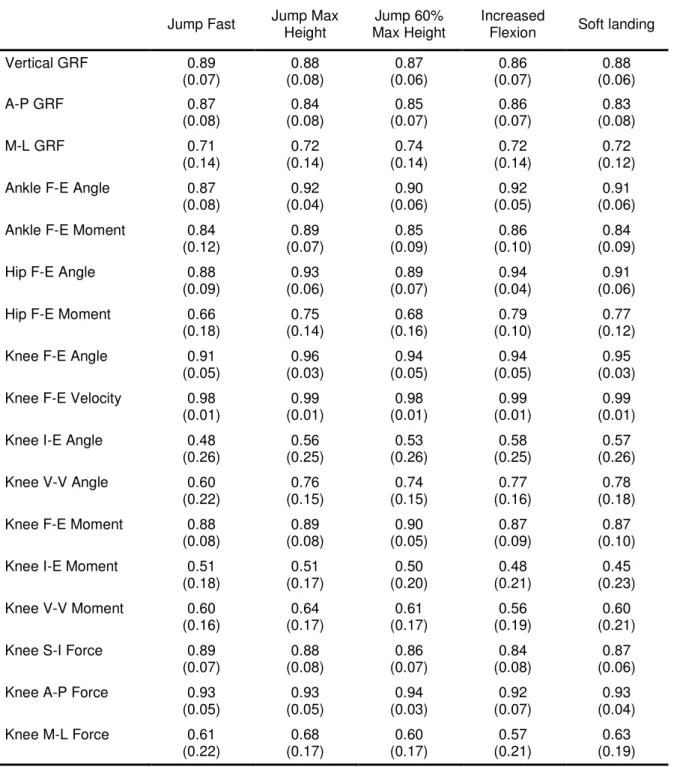
4.2. Means (standard deviations) of CMCs for kinematic and kinetic variables during the stop-jump conditions ... 102
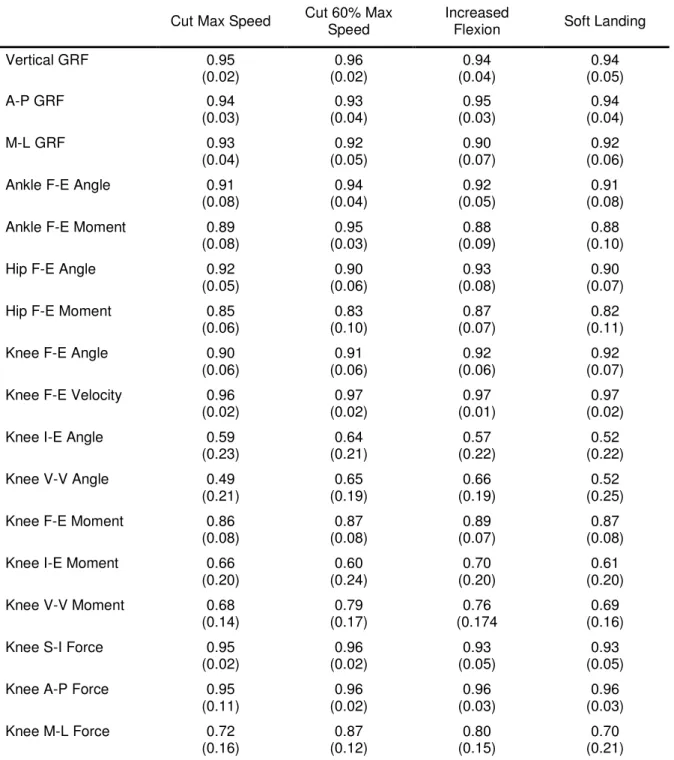
4.3. Means (standard deviations) of CMCs for kinematic and kinetic variables during the side-cutting conditions ... 103
4.4. Number of outliers for variables during the stop-jump conditions ... 105
4.5. Number of outliers for variables during the side-cutting conditions ... 106
4.6. P-values of Kolmogorov - Smirnov test for variables during the stop-jump conditions ... 108
4.7. P-values of Kolmogorov - Smirnov test for variables during the side-cutting conditions ... 109
4.8. P-values of Levene test for variables during the stop-jump conditions ... 111
4.9. P-values of Levene test for variables during the side-cutting conditions ... 112
4.10. Means (standard deviations) of peak ACL force timing and peak posterior GRF timing during the stop-jump conditions ... 114
4.11. Means (standard deviations) of peak ACL force timing and peak posterior GRF timing during the side-cutting conditions ... 114
4.13. Means (standard deviations) of peak ACL force magnitude
during the side-cutting conditions ... 115
4.14. Means (standard deviations) of compositions of peak ACL
force during the stop-jump conditions ... 116
4.15. Means (standard deviations) of compositions of peak ACL
force during the side-cutting conditions ... 116
4.16. Mean (standard deviation) of magnitudes of peak ACL force with different percentages of ankle and hip
co-contraction during the stop-jump conditions ... 119
4.17. Mean (standard deviation) of magnitudes of peak ACL force with different percentages of ankle and hip
co-contraction during the side-cutting conditions ... 120
4.18. Mean (standard deviation) of timing of peak ACL forces with different percentages of ankle and hip co-contraction
during the stop-jump conditions ... 121
4.19. Mean (standard deviation) of timing of peak ACL forces with different percentages of ankle and hip co-contraction
during the side-cutting conditions ... 122
4.20. Means (standard deviations) and P-values for repeated measure ANOVAs for performance variables during jumping fast, jumping for maximum height, and jumping
for 60% of maximum jump height conditions ... 124
4.21. Means (standard deviations) and P-Values for repeated measure ANOVAs for ACL loading factor variables during jumping fast, jumping for maximum height, and jumping
for 60% of maximum jump height conditions ... 130
4.22. Means (standard deviations) and P-Values for repeated measure ANOVAs for ACL force variables during jumping fast, jumping for maximum height, and jumping
for 60% of maximum jump height conditions ... 133
4.23. Means (standard deviations) and P-Values for repeated measure ANOVAs for performance variables during cutting with maximum speed and cutting with 60% of
maximum speed conditions ... 135
cutting with maximum speed and cutting with 60% of
maximum speed conditions ... 141
4.25. Means (standard deviations) and P-Values for repeated measure ANOVAs for ACL force variables during cutting with maximum speed and cutting with 60% of
maximum speed conditions ... 143
4.26. Means (standard deviations) and P-Values for repeated measure ANOVAs for performance variables during jumping for maximum height, jump with increased knee
flexion landing, and soft landing conditions ... 147
4.27. Means (standard deviations) and P-Values for repeated measure ANOVAs for ACL loading factor variables during jumping for maximum height, jump with increased knee
flexion landing, and soft landing conditions ... 152
4.28. Means (standard deviations) and P-Values for repeated measure ANOVAs for ACL force variables during jumping for maximum height, jump with increased knee flexion landing,
and soft landing conditions ... 154
4.29. Means (standard deviations) and P-Values for repeated measure ANOVAs for performance variables during cutting with maximum speed, increased knee flexion landing,
and soft landing conditions ... 158
4.30. Means (standard deviations) and P-Values for repeated measure ANOVAs for ACL loading factor variables during cutting with maximum speed, increased knee flexion landing,
and soft landing conditions ... 163
4.31. Means (standard deviations) and P-Values for repeated measure ANOVAs for ACL force variables during
cutting with maximum speed, increased knee flexion landing,
and soft landing condition ... 166
4.32. Type I Error Rates for Significant Pair-Wise Comparisons for
Hypothesis 1 ... 168
4.33. Type I Error Rates for Significant Pair-Wise Comparisons for
Hypothesis 2 ... 169
A.1. A comparison of soft landing and landing with increased initial knee flexion during the stop-jump task in a pilot
A.2. A comparison of soft landing and landing with increased initial knee flexion during the side-cutting task in a pilot
study (n=5) ... 263
A.3. CMC for kinematic and kinetic variables during the
stop-jump task in a pilot study (n=6) ... 264
A.4. Averaged standard deviation for kinematic and kinetic
variables during the stop-jump task in a pilot study (n=6) ... 265
A.5. CMC for kinematic and kinetic variables during the
side-cutting task in a pilot study (n=6) ... 266
A.6. Averaged standard deviation for kinematic and kinetic
LIST OF FIGURES
Figure
3.1. Anterior and posterior views of marker placements ... 52
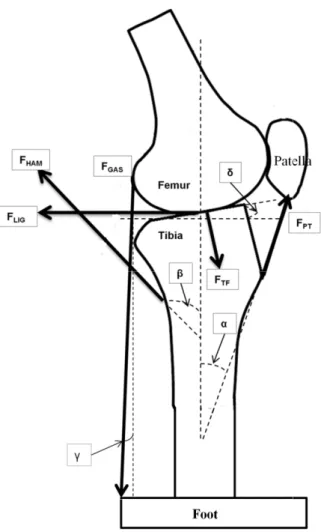
3.2. The knee geometry and muscle forces ... 62
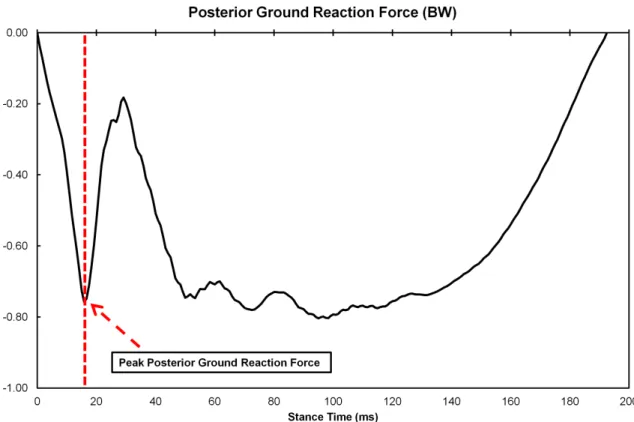
3.3. One representative trial of posterior ground reaction force
during a stop jump task. ... 90
B.1. Anterior (+) - posterior (-) ground reaction force during jumping fast, jumping for maximum height, and jumping
for 60% of maximum height conditions for males ... 268
B.2. Anterior (+) - posterior (-) ground reaction force during jumping fast, jumping for maximum height, and jumping
for 60% of maximum height conditions for females ... 269
B.3. Vertical ground reaction force during jumping fast, jumping for maximum height, and jumping for 60% of
maximum height conditions for males ... 270
B.4. Vertical ground reaction force during jumping fast, jumping for maximum height, and jumping for 60% of
maximum height conditions for females ... 271
B.5. Knee flexion angle during jumping fast, jumping for maximum height, and jumping for 60% of maximum
height conditions for males ... 272
B.6. Knee flexion angle during jumping fast, jumping for maximum height, and jumping for 60% of maximum
height conditions for females ... 273
B.7. Knee flexion (+) - extension (-) velocity during jumping fast, jumping for maximum height, and jumping for
60% of maximum height conditions for males ... 274
B.8. Knee flexion (+) - extension (-) velocity during jumping fast, jumping for maximum height, and jumping for
60% of maximum height conditions for females ... 275
B.10. Knee internal (+) - external (-) rotation angle during jumping fast, jumping for maximum height, and jumping
for 60% of maximum height conditions for females ... 277
B.11. Knee varus (+) - valgus (-) angle during jumping fast, jumping for maximum height, and jumping for 60% of
maximum height conditions for males ... 278
B.12. Knee varus (+) - valgus (-) angle during jumping fast, jumping for maximum height, and jumping for 60% of
maximum height conditions for females ... 279
B.13. Knee flexion (+) - extension (-) moment during jumping fast, jumping for maximum height, and jumping for
60% of maximum height conditions for males ... 280
B.14. Knee flexion (+) - extension (-) moment during jumping fast, jumping for maximum height, and jumping for
60% of maximum height conditions for females ... 281
B.15. Knee internal (+) - external (-) rotation moment during jumping fast, jumping for maximum height, and jumping
for 60% of maximum height conditions for males ... 282
B.16. Knee internal (+) - external (-) rotation moment during jumping fast, jumping for maximum height, and jumping
for 60% of maximum height conditions for females ... 283
B.17. Knee varus (+) - valgus (-) moment during jumping fast, jumping for maximum height, and jumping for 60% of
maximum height conditions for males ... 284
B.18. Knee varus (+) - valgus (-) moment during jumping fast, jumping for maximum height, and jumping for 60% of
maximum height conditions for females ... 285
B.19. Anterior (+) - posterior (-) ground reaction force during cutting with maximum speed and cutting with 60% of
maximum speed conditions for males ... 286
B.20. Anterior (+) - posterior (-) ground reaction force during cutting with maximum speed and cutting with 60% of
maximum speed conditions for females ... 287
B.21. Vertical ground reaction force during cutting with maximum speed and cutting with 60% of maximum
B.22. Vertical ground reaction force during cutting with maximum speed and cutting with 60% of maximum
speed conditions for females ... 289
B.23. Knee flexion angle during cutting with maximum speed and cutting with 60% of maximum speed conditions
for males ... 290
B.24. Knee flexion angle during cutting with maximum speed and cutting with 60% of maximum speed conditions
for females ... 291
B.25. Knee flexion (+) - extension (-) velocity during cutting with maximum speed and cutting with 60% of maximum
speed conditions for males ... 292
B.26. Knee flexion (+) - extension (-) velocity during cutting with maximum speed and cutting with 60% of maximum
speed conditions for females ... 293
B.27. Knee internal (+) - external (-) rotation angle during cutting with maximum speed and cutting with 60% of
maximum speed conditions for males ... 294
B.28. Knee internal (+) - external (-) rotation angle during cutting with maximum speed and cutting with 60% of
maximum speed for females ... 295
B.29. Knee varus (+) - valgus (-) angle during cutting with maximum speed and cutting with 60% of maximum
speed conditions for males ... 296
B.30. Knee varus (+) - valgus (-) angle during cutting with maximum speed and cutting with 60% of maximum
speed conditions for females ... 297
B.31. Knee flexion (+) - extension (-) moment during cutting with maximum speed and cutting with 60% of maximum
speed conditions for males ... 298
B.32. Knee flexion (+) - extension (-) moment during cutting with maximum speed and cutting with 60% of maximum
speed conditions for females ... 299
B.33. Knee internal (+) - external (-) rotation moment during cutting with maximum speed and cutting with 60% of
B.34. Knee internal (+) - external (-) rotation moment during cutting with maximum speed and cutting with 60% of
maximum speed conditions for females ... 301
B.35. Knee varus (+) - valgus (-) moment during cutting with maximum speed and cutting with 60% of maximum speed
conditions for males ... 302
B.36. Knee varus (+) - valgus (-) moment during cutting with maximum speed and cutting with 60% of maximum speed
conditions for females ... 303
B.37. Anterior (+) - posterior (-) ground reaction force during jumping for maximum height, jumping with increased initial knee flexion landing, and jumping with soft landing
conditions for males ... 304
B.38. Anterior (+) - posterior (-) ground reaction force during jumping for maximum height, jumping with increased initial knee flexion landing, and jumping with soft landing
conditions for females ... 305
B.39. Vertical ground reaction force during jumping for maximum height, jumping with increased initial knee flexion landing,
and jumping with soft landing conditions for males ... 306
B.40. Vertical ground reaction force during jumping for maximum height, jumping with increased initial knee flexion landing,
and jumping with soft landing conditions for females ... 307
B.41. Knee flexion angle during jumping for maximum height, jumping with increased initial knee flexion landing, and
jumping with soft landing conditions for males ... 308
B.42. Knee flexion angle during jumping for maximum height, jumping with increased initial knee flexion landing, and
jumping with soft landing conditions for females ... 309
B.43. Knee flexion (+) - extension (-) velocity during jumping for maximum height, jumping with increased initial knee flexion
landing, and jumping with soft landing conditions for males ... 310
B.44. Knee flexion (+) - extension (-) velocity during jumping for maximum height, jumping with increased initial knee flexion
landing, and jumping with soft landing conditions for females ... 311
B.45. Knee internal (+) - external (-) rotation angle during
knee flexion landing, and jumping with soft landing
conditions for males ... 312
B.46. Knee internal (+) - external (-) rotation angle during jumping for maximum height, jumping with increased initial knee flexion landing, and jumping with soft landing
conditions for females ... 313
B.47. Knee varus (+) - valgus (-) angle during jumping for maximum height, jumping with increased initial knee flexion landing, and jumping with soft landing conditions
for males ... 314
B.48. Knee varus (+) - valgus (-) angle during jumping for maximum height, jumping with increased initial knee flexion landing, and jumping with soft landing conditions
for females ... 315
B.49. Knee flexion (+) - extension (-) moment during jumping for maximum height, jumping with increased initial knee flexion landing, and jumping with soft landing conditions
for males ... 316
B.50. Knee flexion (+) - extension (-) moment during jumping for maximum height, jumping with increased initial knee flexion landing, and jumping with soft landing conditions
for females ... 317
B.51. Knee internal (+) - external (-) rotation moment during
jumping for maximum height, jumping with increased initial knee flexion landing, and jumping with soft landing conditions
for males ... 318
B.52. Knee internal (+) - external (-) rotation moment during
jumping for maximum height, jumping with increased initial knee flexion landing, and jumping with soft landing conditions
for females ... 319
B.53. Knee varus (+) - valgus (-) moment during jumping form maximum height, jumping with increased initial knee flexion
landing, and jumping with soft landing conditions for males ... 320
B.54. Knee varus (+) - valgus (-) moment during jumping form maximum height, jumping with increased initial knee flexion
landing, and jumping with soft landing conditions for females ... 321
knee flexion, and cutting with soft landing conditions
for males ... 322
B.56. Anterior (+) - posterior (-) ground reaction force during cutting with maximum speed, cutting with increased initial knee flexion, and cutting with soft landing conditions
for females ... 323
B.57. Vertical ground reaction force during cutting with maximum speed, cutting with increased initial knee flexion, and cutting
with soft landing conditions for males ... 324
B.58. Vertical ground reaction force during cutting with maximum speed, cutting with increased initial knee flexion, and cutting
with soft landing conditions for females ... 325
B.59. Knee flexion angle during cutting with maximum speed, cutting with increased initial knee flexion, and cutting with
soft landing conditions for males ... 326
B.60. Knee flexion angle during cutting with maximum speed, cutting with increased initial knee flexion, and cutting with
soft landing conditions for females ... 327
B.61. Knee flexion (+) - extension (-) velocity during cutting with maximum speed, cutting with increased initial knee flexion,
and cutting with soft landing conditions for males ... 328
B.62. Knee flexion (+) - extension (-) velocity during cutting with maximum speed, cutting with increased initial knee flexion,
and cutting with soft landing conditions for females ... 329
B.63. Knee internal (+) - external (-) rotation angle during cutting with maximum speed, cutting with increased initial knee
flexion, and cutting with soft landing conditions for males ... 330
B.64. Knee internal (+) - external (-) rotation angle during cutting with maximum speed, cutting with increased initial knee
flexion, and cutting with soft landing conditions for females ... 331
B.65. Knee varus (+) - valgus (-) angle during cutting with
maximum speed, cutting with increased initial knee flexion,
and cutting with soft landing conditions for males ... 332
B.66. Knee varus (+) - valgus (-) angle during cutting with
maximum speed, cutting with increased initial knee flexion,
B.67. Knee flexion (+) - extension (-) moment during cutting with maximum speed, cutting with increased initial knee
flexion, and cutting with soft landing conditions for males ... 334
B.68. Knee flexion (+) - extension (-) moment during cutting with maximum speed, cutting with increased initial knee
flexion, and cutting with soft landing conditions for females ... 335
B.69. Knee internal (+) - external (-) rotation moment during cutting with maximum speed, cutting with increased initial knee flexion, and cutting with soft landing conditions
for males ... 336
B.70. Knee internal (+) - external (-) rotation moment during cutting with maximum speed, cutting with increased initial knee flexion, and cutting with soft landing conditions
for females ... 337
B.71. Knee varus (+) - valgus (-) moment during cutting with maximum speed, cutting with increased initial knee flexion,
and cutting with soft landing conditions for males ... 338
B.72. Knee varus (+) - valgus (-) moment during cutting with maximum speed, cutting with increased initial knee flexion,
LIST OF ABBREVIATIONS AND SYMBOLS
ACL = Anterior cruciate ligament
AA = Ankle plantarflexion (+) - dorsiflexion (-) angle
AH = Hip flexion (+) - extension (-) angle
AK = Knee flexion (+) - extension (-) angle
ASIS = Anterior superior iliac spines
FACL = ACL force
FAS = Tibial anterior shear force
FGAS = Gastrocnemius force
FGM = Gluteus maximus force
FHAM = Hamstring force
FK,AP = Knee resultant force in the anterior-posterior direction
FK,SI = Knee resultant force in the superior-inferior direction
FPT = Patella tendon force
FSOF = Knee soft tissue force
FSOL = Soleus force
FTF = Tibiofemoral contact force
F100 = ACL force with a 100 N tibial anterior tibia force
F10_ER = ACL force with a 10Nm knee external rotation moment
F10_IR = ACL force with a 10Nm knee internal rotation moment
F10_VAL = ACL force with a 10Nm knee valgus moment
GRF = Ground reaction force
MA,P = Ankle plantarflexion moment
MER = Knee external rotation moment
MH,E = Hip extension moment
MIR = Knee internal rotation moment
MK,EF = Knee extension - flexion moment
MVAL = Knee valgus moment
MVAR = Knee varus moment
PSIS = Posterior superior iliac spines
rAT = Achilles tendon moment arm for ankle joint
rGAS = Gastrocnemius moment arm for knee joint
rGM = Gluteus maximus moment arm for hip joint
rHAM,H = Hamstring moment arm for hip joint
rHAM,K = Hamstring moment arm for knee joint
rPT = Patellar tendon moment arm for knee joint
δ = Posterior tibial plateau slope angle
α = Patellar tendon - tibial shaft angle
β = Hamstring-tibial shaft angle
CHAPTER I
INTRODUCTION
Anterior cruciate ligament (ACL) injuries are common sports related knee
injuries. The estimated annual incidence rate of ACL injury is 1 in every 3,000
citizens in the United States and Norway (Miyasaka et al., 1991; Granan et al.,
2008). A majority of ACL injuries occur during the landing phase of sudden
deceleration maneuvers with a non-contact mechanism (Boden et al., 2000;
Krosshaug et al., 2007).
Female athletes have greater ACL injury rates per sports exposure than male
athletes in most sporting events (Agel et al., 2005; Hootman et al., 2007). Previous
researchers have attempted to identify risk factors for non-contact ACL injury by
comparing movement patterns between males and females (Malinzak et al., 2001;
Chappell et al., 2002; Yu et al., 2006; Chappell et al., 2007). These studies have
shown that females have restricted sagittal plane joint motion and increased joint
motion in the frontal and coronal planes compared to males when performing jump
landing and cutting tasks (Malinzak et al., 2001; Chappell et al., 2002; Yu et al.,
2006; Chappell et al., 2007). The findings of motion analysis studies are consistent
with in vitro and in vivo studies which have shown that the biomechanical movement
patterns demonstrated by females induce greater ACL loading compared to males
In the studies which compared gender differences, as well as other studies
that investigated ACL injury risk factors (Hewett et al., 2005) and evaluated training
effects (Myer et al., 2005), jump landing and cutting tasks were commonly used to
evaluate movement patterns. For example, strength and technique training
decreased knee anterior shear forces and increased knee flexion angles during a
stop-jump task in female recreational athletes (Herman et al., 2009). Modifications in
foot placement and body position reduced peak valgus moments during a
side-cutting task in male team sport athletes (Dempsey et al., 2007). However, while
many investigators have focused on the effects of interventions on ACL loading
factors, reports of changes in performance were lacking (Prapavessis and McNair,
1999; Onate et al., 2005; Onate et al., 2005; Dempsey et al., 2007). Most
investigators only used jump height and running speed as the performance variables
when evaluating jump landing and cutting tasks (Hewett et al., 1996; Yu et al., 2004;
Myer et al., 2005; Sigward and Powers, 2006b; Vescovi et al., 2008; Dempsey et al.,
2009; Herman et al., 2009). Only a few investigators reported stance time as a
performance variable (Chappell and Limpisvasti, 2008; Myers and Hawkins, 2010;
Wannop et al., 2010).
During real competition, achieving optimal performance is important for
athletes. For example, a basketball player with a higher jump height and a shorter
take-off time will have advantages in scoring, rebounding, and blocking. In addition,
reducing energy expenditure during each movement should allow athletes to play
longer with a greater intensity. From the injury prevention perspective, reducing ACL
flexion angles are important (Meyer and Haut, 2005; Jordan et al., 2007; Yu and
Garrett, 2007; Taylor et al., 2011). On the other hand, from the performance
perspective, faster running speed and greater jump height, short take-off time, and
low energy expenditure are desirable in most sports events. However, while
increasing performance and decreasing ACL loading are both important for athletes,
the underlying relationships between them are unknown.
The relationships between performance and ACL loading can be studied
between individuals or within individuals. Comparing ACL loading between
individuals with different performance levels might introduce other factors other than
performance. For example, male athletes usually perform at a higher level than
female athletes (Ziv and Lidor, 2009). Because of the differences in movement
patterns (Malinzak et al., 2001; Chappell et al., 2002) and internal ACL risk factors
(Nunley et al., 2003; Chandrashekar et al., 2005; Chandrashekar et al., 2006)
between genders, males have a lower ACL injury rate than females (Agel et al.,
2005; Hootman et al., 2007). Indeed, ACL injuries are not likely related to skill levels
(Harmon and Dick, 1998). No difference in ACL injury rate was found among
different NCAA division levels in men’s or women's basketball or soccer (Harmon
and Dick, 1998). However, studying the relationships between performance and ACL
loading within individuals can partition out factors other than performance.
To determine the relationships between performance and ACL loading within
individuals, at least two questions need to be answered. The first question is how
changes in performance demands affect ACL loading. The second question is how
outcomes. decrease ACL loading affect performance outcomes. Previous
investigators who studied the effects of performance demands on lower extremity
biomechanics focused on the effects of drop height on landing biomechanics.
Generally, impact ground reaction forces increased as drop heights increased
(Dufek and Bates, 1990; Zhang et al., 2000; Elvin et al., 2007; Yeow et al., 2010). In
addition, the impact ground reaction forces increased during a drop jump task when
subjects jumped at a faster speed (Walsh et al., 2004). However, the focus of
previous studies was not ACL loading. It was unknown how ACL loading changed
when the drop height increased or the support phase of a jump decreased. In
addition, drop landing or drop vertical jump from a box were rarely performed during
real competitions. Compared to drop landing and drop vertical jump from a box, stop
jump and cutting tasks were commonly performed in sports such as basketball and
soccer. In addition, because of a fast initial approach speed, the landing phase of
stop-jump and cutting tasks involve sharp decelerations in the anterior-posterior
direction which might increase the ACL loading (Yu et al., 2006). However, it is
unknown how different performance demands such as jump height and stance time
affect ACL loading during stop-jump and cutting tasks.
In terms of the effects of changes in movement patterns that should decrease
ACL loading on the performance outcomes, different researchers have investigated
the effects of landing techniques (Dufek and Bates, 1990; Zhang et al., 2000; Elvin
et al., 2007; Yeow et al., 2010) on stance time (Walsh et al., 2007), jump height
(Walsh et al., 2007), and mechanical work (Devita and Skelly, 1992; Zhang et al.,
that soft landing decreased the impact force without changing jump height during a
drop vertical jump task in females. However, the stance time increased. The authors
stated that the increase in stance time would put athletes at a competitive
disadvantage. In biomechanical studies, energy expenditure was usually quantified
using mechanical work (McCaulley et al., 2007). Previous investigators have
demonstrated that soft landing reduced peak ground reaction forces and peak joint
moments but increased lower extremity mechanical work when compared to stiff
landing (Devita and Skelly, 1992; Zhang et al., 2000). A similar trade-off between
injury risk and energy expenditure was suggested in running. Running with
increased knee flexion angles can decrease impact forces, but will increase energy
expenditure that might reduce performance (Derrick, 2004). Previous researchers
have demonstrated that changes in technique such as soft landing and landing with
increased knee flexion are effective in decreasing ACL loading factors. However, the
changes in performance outcomes were largely unknown in each study. The
combined results of previous studies suggest that decreases in ACL loading induced
by soft landing are likely to increase stance time and mechanical work during drop
landing and drop vertical jump tasks. However, no study has comprehensively
examined how changes in ACL loading induced by soft landing affect performance
during athletic tasks with great decelerations such as stop-jump and cutting tasks.
The previously mentioned studies suggest potential trade-off relationships
between performance and ACL loading during athletic tasks. However, because
those relationships are not completely understood, many researchers have treated
evaluations. For example, investigators have identified that neuromuscular training
decreased ACL loading factors during a jump landing test and increased vertical
jump height during a maximum vertical jump test (Hewett et al., 1996; Myer et al.,
2005; Myer et al., 2006a; Myer et al., 2006b; Chappell and Limpisvasti, 2008).
Evaluating ACL loading and maximum jump height using two different tasks might
favor one aspect without considering the other. Actually, by using a single jump
landing task to evaluate both ACL loading factors and jump height simultaneously,
several investigators did not find training improved lower extremity biomechanics or
jump height (Grandstrand et al., 2006; Vescovi et al., 2008; Lim et al., 2009). The
discrepancies among previous studies in training effects on performance and ACL
loading might be caused by different training programs and characteristics of
subjects. However, the differences in testing protocols should also be noticed. Many
studies considered performance and ACL loading as two independent factors and
had them tested during two different tasks. A lack of consideration of the relationship
between performance and loading could also contribute to the discrepancies among
previous studies.
Although previous investigators have documented some relationships
between performance and ACL loading factors, no study has systematically studied
their relationships simultaneously. A lack of comprehensive consideration of the
relationships between performance and ACL loading might mislead the actual
training effects on ACL loading in real practice and competitions. Previous
investigators have documented that the ACL injury rate for NCAA women’s soccer,
(Agel et al., 2005). ACL injury rate for 15 sports was increasing by an average of
1.3% each year 1988 to 2004 (Hootman et al., 2007). These findings suggest that
either the implementation of prevention programs is ineffective or lacking, or
improvements are needed for the current prevention programs for ACL injury.
Studying the underlying relationships between performance and ACL loading can
provide important information in understanding injury mechanism as well as
Statement of Purposes and Hypotheses
The purpose of the current study was to determine the relationships between
the performance of recreational athletes in selected athletic tasks and their ACL
loading while performing the athletic tasks. Performance was quantified using jump
height, approach speed, take-off speed, stance time, and lower extremity
mechanical work. ACL loading was quantified using biomechanical ACL loading
factors including GRF, 3 dimensional knee angles, and knee moments. ACL loading
was also quantified using peak ACL force estimated from a musculoskeletal model.
This purpose was achieved by addressing the following two specific aims:
Specific Aim 1: to determine the effects of changes in performance demands on ACL
loading in recreational athletes while performing stop-jump and side-cutting tasks.
Hypothesis 1: ACL loading would increase when the athletes jumped with a higher
jump height and a shorter stance time during a stop-jump task. ACL loading would
increase when the athletes cut with a faster speed and a shorter stance time during
a side-cutting task.
Specific Aim 2: to determine the effects of changes in movement patterns that
should decrease ACL loading on the performance outcomes.
Hypothesis 2: Soft landing and landing with increased knee flexion at initial contact
would decrease ACL loading, but also decrease jump height and cutting speed and
increase stance time and mechanical work compared to regular landing during
Significances of the Study
1. Understanding the effects of performance demands on ACL loading could
provide insight of ACL injury mechanisms, and set the targets for injury risk
screening and injury prevention. ACL injuries usually occur during sharp
deceleration athletic tasks, but how performance demands during these
athletic tasks affect ACL loading and which aspect of performance demands
has the greatest influence to ACL loading are unknown. Previous
investigators generally screened and trained athletes with maximum jump
height as the performance demand with the assumption that jump height was
the factor mostly associated with ACL loading. However, it was still unknown
whether jump height was a sensitive performance demand to ACL loading. In
addition, movement speed, which was more likely to be associated with a
sharp deceleration, had received little attention during injury risk screening.
Screening and training athletes without knowing whether the task demands
really representing the ACL injury scenario might set the wrong target in injury
risk screening and injury prevention. The findings of the current study would
provide information in ACL injury mechanism in terms of whether
performance demands was associated with ACL loading and which
performance demand had the greatest effect on ACL loading. The goal of
training is to decrease injury risk factor during high risk tasks. Performance
Injury risk screening and prevention should be conducted with a
comprehensive consideration of performance demands.
2. Knowing the effects of changes in ACL loading induced by changes in
techniques on performance would give us a better understand of the
generalizations of certain training methods to the real world. Changes in
techniques such as soft landing and landing with increased knee flexion were
effective in decreasing ACL loading factors and had been an important
component in many ACL prevention programs. However, many investigators
only focused on the decreases in ACL loading caused by changes in
techniques without a full understanding of the changes in performance. No
study had comprehensively and consistently investigated the effects of soft
landing and landing with increase knee flexion on performance. In addition,
previous studies only studied drop landing and drop vertical jump from a box
which were rarely performed during real competitions. Different from a lab
setting, performance was very important during real competitions for athletes
to achieve their sports goals. The improvements in movement patterns
induced by changes in techniques could vanish during real competitions if the
new movement patter causes a decrease in performance. The findings of the
current study might reveal the limitations of certain training methods and
3. Examining the relationships between performance and ACL loading would
provide implications to the future development of movement evaluation tests
and criteria for reporting intervention effects on movement patterns in ACL
injury prevention programs. Many previous investigators had evaluated
performance and ACL loading as two independent factors. In addition, reports
in changes in performance were usually incomplete. Evaluating performance
and ACL loading individually might favor one aspect without considering the
other during different tests. The findings of the current study would
demonstrate whether we need to consider performance and ACL loading as a
single unit during movement evaluations and injury prevention training. In
addition, the relationships between performance and ACL loading would
suggest the importance of presenting a complete report of interventions
CHAPTER II
REVIEW OF LITERATURE
The incidence rates of ACL injuries and consequences of ACL injuries have
been reviewed to justify the importance of studying and preventing ACL injuries. The
characteristics of ACL injuries have been reviewed to justify the strategies that are
chosen to evaluate ACL injury risks. ACL loading mechanisms have been reviewed
to justify the biomechanical ACL loading factors. Previous studies that investigated
performance and lower extremity biomechanics during athletic tasks have been
critically reviewed to justify the novelty of the current study and provide background
information to build the hypotheses for the current study.
2.1. Incidence Rates of ACL Injuries
Previous researchers have demonstrated that the annual incidence rate of
ACL injury is approximately 1 in every 3,000 citizens. A majority of ACL injuries
occur during sports activities. In Norway, 2714 primary ACL reconstructions were
performed from 2004 to 2006 with an annual incidence rate of 34 per 100, 000
citizens (Granan et al., 2008). One thousand and seven hundred of the 2714 (65%)
injuries occurred in soccer, team handball, and alpine skiing. In New Zealand, 7375
incidence rate of 37 per 100,000 citizens (Gianotti et al., 2009). In addition, 3997 of
the 7375 (54%) injuries were sports related injuries. In the United States, no national
registry exists for ACL injury, so the ACL injury rate in general population is
estimated from insurance data within each medical center. Three hundred and two
ACL injuries were reported at Kaiser-Permanente Medical Center in San Diego from
1985 to 1988 resulting in an estimated annual incidence rate of 36 per 100,000
citizens (Miyasaka et al., 1991). 204 of the 302 (68%) injuries were sports related.
4485 ACL reconstructions were performed within Kaiser-Permanente Southern
California between 2001 and 2005 corresponding to an estimated annual incidence
rate of 29 per 100000 citizens (Csintalan et al., 2008).
The ACL injury rates in sporting events are usually reported as the number of
injuries per 1000 exposures to normalize the sports exposure effects. Prodromos et
al. (Prodromos et al., 2007) conducted a Meta-analysis study and reviewed recent
literature of ACL injury rates during different sports. The ACL injury incidence rates
(injuries / 1000 exposures) are 2.78 in general population indoor soccer, 0.49 in
general population alpine skiing, 0.33 in elite handball, 0.25 in collegiate wrestling,
0.22 in collegiate rugby, 0.21 in collegiate soccer, 0.18 in collegiate lacrosse, 0.17 in
collegiate basketball, and 0.07 in adult recreational soccer.
Previous investigators have documented that the ACL injury rate for NCAA
women’s soccer, men’s basketball, and women’s basketball remained unchanged
from 1990 to 2002 (Agel et al., 2005). ACL injury rate for 15 NCAA sports was
2.2. Consequences of ACL Injuries
Approximately 200,000 ACL reconstructions are performed annually in the
United States at an average cost of $20,000 per surgery. This translates to an
estimated annual cost of $4 billion for surgical costs alone (Brophy et al., 2009). ACL
injuries not only bring financial burden to the health service and society, but also
have devastating consequences on patients’ quality of life and result in secondary
injuries and disorders (Ingersoll et al., 2008).
2.2.1. Physical and Psychological Consequences
ACL injuries have long-term hazardous effects on patients’ physical
capabilities. Patients following ACL injuries usually demonstrate decreases in
quadriceps strength, knee proprioception, and physical activity levels compared to
pre-injury (Keays et al., 2001; de Jong et al., 2007; Ingersoll et al., 2008; Lautamies
et al., 2008). Keays et al. (2001) measured quadriceps and hamstring strength in
ACL injured patients 1 week before and 6 month after their ACL reconstructions.
Before the surgery, 9-12% deficits of quadriceps strength were found on the surgical
knee compared to non-surgical knee. However, after the surgery and rehabilitation
training, the deficits of quadriceps increased to 22-28%. de Jong et al. (2007)
measured the quadriceps and hamstring strength in ACL injured patients from
pre-surgery to 12 month post-pre-surgery. Quadriceps strength asymmetries were 10-20%
post-to 12 month post-surgery. Lautamies et al. (2008) assessed quadriceps and
hamstring strength and knee function in patients 5 years after ACL reconstruction.
The strength deficits for quadriceps were 5-10% between surgical and non-surgical
knees. More than 30% of the patients had a greater than 10% asymmetry in a single
leg hop test. Fischer-Rasmussen and Jensen (2000) compared the proprioception
and performance between an ACL injured group and a control group. The
performance was tested using one-leg leap test and triple jump test. In a one-leg
triple test, the subjects jumped up and down a step until exhausted and the number
of jumps was recorded. During a triple jump test, subjects performed three
continuous jumps and the total jump distance was measured. The ACL injured group
had less performance in one-step leap test and triple jump test on the surgical leg
compared to the control group. Proprioception was tested by reproducing 60
degrees of knee flexion and detecting passive movements. The ACL injured group
had less scores on both proprioceptive tests than the control group. Ingersoll et al.
(2008) summarized evidences that ACL injuries had hazardous effects on
somatosensory, muscle activation, muscles strength, atrophy, balance,
biomechanics, and patient-oriented outcomes.
ACL injured patients also show a fear of ACL re-injury. Kvist et al. (2005)
followed ACL injured patients for 3-4 years post-surgery. Sixty-two patients
completed a questionnaire including the Tampa Scale of Kinesiophobia, the Knee
Injury and Osteoarthritis Outcome Score, and general questions. Only 53% of the
associated with low rate of activity level and low knee-related quality of life (Kvist et
al., 2005).
2.2.2. Neuromuscular Control
One goal in rehabilitation following ACL injuries is to restore patients’
neuromuscular control patterns with an aim to return patients to pre-injury activity
level. However, previous studies have demonstrated that ACL injured patients had
abnormal neuromuscular control patterns during athletic tasks even after
rehabilitation training.
Bush-Joseph et al. (2001) compared the physical functions and lower
extremity biomechanics between ACL injured patients with an average of 22 month
following surgery and a healthy control group. The patients’ surgical knees had good
range of motion, strength, and stability compared to nonsurgical knees and the
control group. No difference was observed in knee extension moments between two
groups during light and moderate tasks including walking and stair climbing.
However, decreased knee extension moments on the patients’ surgical side were
found during great demanding tasks including jogging and cutting. Decker et al.
(2002) compared the landing strategies between ACL injured patients more than 1
year following surgery and a healthy control group. The ACL injured group had
increased ankle range of motion but decreased hip flexion. The time to peak vertical
ground reaction force was delayed in the ACL injured group. The ACL injured group
biomechanics during a single-leg drop landing task in ACL injured patients 21 month
following surgery. No significant differences were observed in summated lower
extremity extension moments. However, the surgical side had less peak vertical
ground reaction forces and increased peak hip flexion angles compared to the
surgical side. Paterno et al. (2007) studied the peak ground reaction forces and
loading rates during a drop vertical jump task in patients 27 month following ACL
surgery. The surgical side had less peak ground reaction forces during both landing
and take-off phases and less loading rate during the landing phase compared to the
nonsurgical side.
Paterno et al. (2010) conducted a prospective study to predict ACL re-injuries
from landing biomechanics and postural stability in young athletes. Although the
comparisons between surgical and nonsurgical sides were not presented in detail,
the investigators found that increased hip internal rotation moments during early
landing phase, increased valgus movements, increased asymmetries in knee
extension moments at initial contact, and poor postural stability of the involved limb
predicted the ACL re-injuries with great sensitivity and specificity.
In summary, individuals with ACL injuries demonstrated asymmetries in lower
extremity kinematics and kinetics during athletics tasks. In addition, the limb
asymmetries became more pronounced when the task demands increase. The
asymmetries in neuromuscular control could be caused by decreases in strength,
proprioception, and a fear of ACL re-injury. The asymmetries might contribute to the
2.2.3. Osteoarthritis
Osteoarthritis is a common age-related disorder which is characterized by
loss of articular cartilage in synovial joints. However, ACL injuries can cause the
early onset and great prevalence of knee osteoarthritis (Lohmander et al., 2004;
Lohmander et al., 2007). The loss of cartilage at the knee joint can expose and
damage the bone and lead to tremendous pain and functional impairments
(Lohmander et al., 2007). von Porat et al. (2004) followed 219 ACL injured male
soccer players for 14 years following surgery. Among the 122 patients who had
radiography 14 years following surgery, 41% of the injured knees reached the
criterion of radiographic knee osteoarthritis compared to only 4% of the contralateral
knee. Lohmander et al. (2004) followed 84 ACL injured soccer players 12 years
following surgery. Among the 67 patients who received a knee radiograph 12 years
following surgery, 82% had radiographic changes in the surgical knee and 51%
reached the criterion of radiographic knee osteoarthritis. Lohmander et al. (2007)
showed that an average of 50% patients with ACL or meniscus tear had
osteoarthritis with associated pain and functional impairments 10-20 years following
injury.
2.2.4. ACL Re-injuries
The ACL re-injury rate was much greater than the primary ACL injury rate,
the risk of injuring the contralateral ACL is as great as reinjuring the ACL graft
(Shelbourne et al., 2009).
Two studies with large sample sizes have shown that the incident rates of
ACL graft rupture and contralateral ACL rupture were both 5-6% in general patients
2-5 years following ACL reconstruction (Salmon et al., 2005; Shelbourne et al.,
2009). Shelbourne et al. (2009) followed 413 ACL injured adolescent basketball and
soccer players for a mean of 10 years. The ACL graft tear rate was 10% and the
contralateral ACL injury rate was 16%. A study followed 56 young athletes with ACL
injuries for one year after they returned to sports (Paterno et al., 2010). The
investigators showed a re-injury rate of 5% for the graft rupture and 18% for the
contralateral ACL.
2.3. Characteristics of ACL Injuries
2.3.1. Non-contact Mechanism
Previous researchers used video analysis and questionnaire surveys to
understand the nature of ACL injury mechanisms. The investigators have found that
the majority of ACL injuries occur with no direct contact with other players or external
objects. Boden et al. (2000) reviewed 27 videos of ACL injuries and surveyed 89
ACL injured athletes. More than 70% of the injuries occurred with a non-contact
mechanism. Krosshaug et al. (2007) analyzed 39 videos of ACL injuries during
basketball games. More than 70% of the injuries happened with a non-contact
basketball. 65% of the injuries were non-contact injuries. Fauno and Wulff Jakobsen
(2006) performed a retrospective survey study and found that more than 80% of
ACL injuries in soccer occurred with a non-contact mechanism. In addition, the New
Zealand injury claim data revealed that 58% of the sports related ACL injuries were
non-contact ACL injuries. The registry data for Norwegian elite handball teams
showed that more than 90% of the ACL injuries were non-contact ACL injuries
(Myklebust et al., 1997).
In summary, previous researchers have found that 58-90% of ACL injuries
occurred with a non-contact mechanism. The non-contact nature of most ACL
injuries suggested that inappropriate neuromuscular control which resulted in
awkward postures and imbalance force distributions were likely the major causes of
most ACL injuries. ACL injuries might be preventable through appropriate
neuromuscular and technique training.
2.3.2. Tasks and Timing
Studying the tasks and timing when ACL injuries occur is important to
understand the mechanism of ACL injuries. Previous researchers have
demonstrated that non-contact ACL injuries usually occur during the early phase of
landing, cutting, pivoting, and other athletic tasks with sudden decelerations. Boden
et al. (2000) found that most non-contact ACL injuries occurred at foot strike with the
injured knee close to extension during a sharp deceleration or landing maneuvers.
found the estimated timing of ACL injuries was 17 to 50 milliseconds after initial foot
contact with the ground. The knee flexion angles were less than 20 degrees at the
time of injury. Valgus knee collapse happened more often in females compare to
males. By using a model-based image matching technique for 10 ACL injury cases,
Koga et al. (2010) found the timing of ACL injury was approximately 40 milliseconds
after initial foot contact with the ground. During the initial 40 milliseconds of ground
contact, decreased knee flexion angles and increases in knee valgus and knee
internal rotation angles were observed.
The previously mentioned evidence suggests that ACL injuries usually occur
during the impact phase of landing when the knee is close to full extension.
Seventeen to 50 milliseconds typically correspond to the first 20% of the landing
phase of jumping and cutting tasks. Studies with an aim to understand ACL injury
mechanism and prevent ACL injuries should focus on the early phase of landing,
cutting, and other maneuvers with sharp decelerations.
2.3.3. Gender
Gender disparity in ACL injury rates have been observed by previous
investigators. Females are considered more likely to sustain non-contact ACL
injuries compared to males (Prodromos et al., 2007). However, it should be noticed
that males actually have greater absolute incidence rate of ACL injury than females
(Granan et al., 2008; Gianotti et al., 2009). When the injury rates are normalized by
sports exposures, females have greater ACL injury rates than males in most sporting
The Norwegian registry data showed that 57% of ACL injured patients were
males (Granan et al., 2008). The New Zealand injury compensation data
demonstrated that 60% of ACL injured patients were males (Gianotti et al., 2009).
The Kaiser-Permanente Southern California data showed that 69% of ACL injured
patients were males (Csintalan et al., 2008). Another study that analyzed 8215
cases of ACL injuries from insurance data revealed that 59% of injured patients were
males (Shea et al., 2004). The higher absolute incidence rate of ACL injury in males
could be caused by more males participating in sports activities.
On the other hand, when the ACL injury rates are normalized to sports
exposures, the female-male ratios of ACL injuries are 5:1 for elite team handball,
4.5:1 for high school basketball, 4:1 for collegiate wrestling, 4:1 for collegiate softball
/ baseball, 3.6:1 for collegiate basketball, 2.8:1 for general population indoor soccer,
2.7:1 for collegiate soccer, 1.9:1 for collegiate rugby, and 1.2:1 for collegiate
lacrosse (Agel et al., 2005; Hootman et al., 2007).
2.3.4. Age
ACL injuries are more like to happen at younger age, especially for females.
The Norwegian Registry data showed that the number of ACL reconstructions for
males were similar from 15 to 34 years of age, while females had the most ACL
reconstructions in the 15 to19 years old age group (Granan et al., 2008). The New
Zealand injury compensation data demonstrated males had the greatest number of
Southern California database demonstrated that the greatest ACL injury
reconstruction number for females occurred in the 14 to17 years of age group, while
the reconstruction number for males were similar from 18 to 34 years of age
(Csintalan et al., 2008). Shea et al. (2004) analyzed ACL injury claim data for 553
pediatric and adolescent ACL injured patients. ACL injury claim frequency increased
at age of 11 years for both genders and reached a peak at 16 to17 years of age.
2.4. ACL Loading Mechanism
An ACL injury occurred when the forces applied on the ACL exceed its
maximum loading (Chandrashekar et al., 2006). Previous investigators have
demonstrated that proximal tibial anterior shear force, knee valgus / varus moments,
knee internal rotation moment, compressive force along the tibia, knee flexion
angles, and hamstring force are important ACL loading mechanisms (Berns et al.,
1992; Markolf et al., 1995; Markolf et al., 1996; Li et al., 1999; Meyer and Haut,
2005; Meyer and Haut, 2008).
2.4.1. Anterior Shear Force
Anterior shear force applied on the proximal tibia is the major loading
mechanism of ACL. Durselen et al. (1995) found that an application of a 140 N
quadriceps force significantly increased the ACL strain from 20 to 60 degrees of
knee flexion. DeMorat et al. (2004) demonstrated that a 4500 N quadriceps muscle
recorded the ACL resultant forces when a 100 N of tibial anterior shear force was
applied to the cadaver knees from 90 degree to 5 degrees of flexion. The
investigators found that the anterior shear force was the most direct loading
mechanism of ACL. The ACL resultant force was equal to the anterior shear force
when the knee flexion was 30 degrees and increased to 150% of the anterior shear
force when the knee was fully extended. Berns et al. (1992) measured the ACL
strain when a 200 N tibial anterior shear force was applied to the tibia in vitro. The
ACL strain was primarily caused by the anterior shear force. ACL strain was
positively correlated with anterior shear force at 0 degree and 30 degrees of knee
flexions. The ACL strain under a 200 N anterior shear force was 2% at 0 degree of
knee flexion and 4.7% at 30 degree of knee flexion. Fleming et al. (2001) tested the
effects of tibial anterior shear force on ACL strain in vivo. A 130N anterior shear
force was applied to the subjects’ tibia when the knee was flexed at 20 degrees with
and without weight bearing. For both weight bearing and non-weight bearing
conditions, ACL strain increased as the anterior shear force increased.
During athletic tasks, the tibial anterior shear force is mainly generated by the
quadriceps muscle force and is a result of muscle forces and joint reaction forces.
During sudden deceleration tasks, quadriceps can be highly activated to generate
landing and braking forces and the large quadriceps force can significantly load the
2.4.2. Valgus / Varus and Internal / External Rotation Moments
Previous researchers have found that knee valgus, varus, and internal
rotation moments significantly contributed to ACL loading when the tibial anterior
shear force was applied (Berns et al., 1992; Markolf et al., 1995). In the study of
Markolf et al. (1995), an additional load of 10Nm valgus, varus, internal rotation, or
external rotation moment was combined with the 100N anterior shear force load.
The addition of internal rotation moment to the anterior shear force produced the
greatest ACL force, while the addition of external rotation moment actually
decreased the ACL force. The addition of varus moments to the anterior shear force
increased the ACL force when the knee flexion angle was less than 30 degrees and
more than 50 degrees, while the addition of valgus moment to the anterior shear
force increased the ACL force when the knee flexion angle was more than 5
degrees. In the study of Bern et al. (1992), valgus / varus moments which range
from 20 Nm to 20 Nm and internal / external rotation moments which ranged from
-10 Nm to -10 Nm were applied to the cadaver knee. However, neither pure valgus /
varus moments nor internal / external rotation moment had significant effects on the
ACL strain. In the study of Fleming et al. (2001), valgus / varus moments which
ranged from -10 Nm to 10 Nm and internal / external rotation moments which ranged
from -9 Nm to 9 Nm were applied to the knee in vivo. As the knee internal rotation
moments increased, ACL strain increased. However, valgus / varus moments and
external rotation moments had very small effects on ACL strain.
A recent study applied dynamic loading during a single leg landing to a knee
ACL strain increased when valgus moments or internal rotation moments increased.
In addition, combined knee valgus and internal rotation moments generated greater
ACL strain than either alone. However, it should be noticed that during a single leg
landing task, the quadriceps is activated and generate an anterior shear force to the
tibia. In addition, previous investigators have demonstrated that medial collateral
ligament is the primary structure resisting knee valgus moment, and valgus moment
is not likely to significantly load the ACL or rupture the ACL until the medial collateral
ligament is completely ruptured (Matsumoto et al., 2001; Mazzocca et al., 2003; Shin
et al., 2009). Actually, only 6% patients who had ACL injuries completely ruptured
their medial collateral ligaments (Fayad et al., 2003). This evidence suggests that
the anterior shear force is the major loading mechanism of ACL, while valgus
moments should be considered a secondary loading mechanism.
2.4.3. Knee Flexion Angle
The effect of anterior shear force on ACL loading is largely dependent on
knee flexion angles. The major mechanics that cause great ACL loading at small
knee flexion angle are patella tendon-tibial shaft angle (Nunley et al., 2003),
hamstring tendon-tibia shaft angle (Nunley et al., 2003; Lin et al., 2009), and ACL
elevation angle (Li et al., 2005) (These angles have been defined in Figure 3.2).
In the study of Markolf et al. (1995), the ACL forces decreased when the knee
flexion angles increased under the 100 N anterior shear force load. In the study of
vivo. The length of the ACL decreased when the knee flexion angles increased from
30 to 135 degrees.
Markolf et al. (1996) demonstrated that solely extending the knee without
other external loading could load the ACL. However, the ACL forces caused by pure
knee extension were only approximately 50 N at 0 degree of knee flexion and less
than 30 N after 10 degrees of knee flexion. Nunley et al. (2003) showed that the
patella tendon-tibial shaft angle increased when the knee flexion angles decreased.
With a certain quadriceps force, an increase in patella tendon-tibia shaft angle will
increase the anterior shear force. In addition, hamstring tendon-tibia shaft angles
decrease when the knee flexion angles decrease (Nunley et al., 2003; Lin et al.,
2009). With a certain hamstring force, a decrease in hamstring tendon-tibia shaft
angle will decrease the posterior shear force. Li et al. (2005) found that the ACL
elevation angles increased as the knee flexion angles decreased. To generate a
certain posterior force, a greater ACL elevation angle will require a greater ACL
force.
These in vitro and in vivo studies suggest that knee flexion angle is a key
component of ACL loading mechanism. During athletic tasks, small knee flexion can
cause great ACL loading. Increasing knee flexion might be an effective technique to
reduce ACL loading and prevent ACL injuries.
2.4.4. Compressive Force
Compressive force along the tibia longitudinal axis has been shown to load