Rethinking Archetypal Branding:
Investigating the Effects of Authenticity and Flawed Archetypes on Brand Attachment, Self-Congruence and Purchase Intent
By Paige Roberts
Senior Honors Thesis School of Media and Journalism
Abstract
Introduction
The marketing and advertising industries have long relied on Jungian archetypes and archetypal marketing strategies to enhance product marketing and build strong and unique brands. Swiss psychologist Carl Jung’s study of cultural mythologies led him to develop a conceptual framework of archetypal characters and tropes that, according to Jung, innately exist within the human mind, regardless of culture or geography (as cited in Siraj & Kumari, 2011). While the innate existence of archetypes in the human subconscious has been called into
question, marketing scholars have found that various Jungian archetypes—such as the “hero” or the “lover”—are recognizable and resonant in advertising across cultures (Tsai, 2006).
Successful advertising and marketing campaigns have relied on archetypal constructs as the basis of brand or product messaging. For example, Nike’s “Just Do It” campaigning strategy,
showcasing unstoppable athletes and a tagline that resembles a heroic call to action, aligns with the archetypal hero. Companies such as Levi’s, Patagonia, and Victoria’s Secret have channeled Jungian archetypes—the rebel, explorer, and lover, respectively—to develop a distinct and recognizable brand image, allowing these brands to differentiate themselves from competitors and achieve mass-market success.
on brand personality, brand attachment and the consumer-brand relationship when used in marketing, advertising and branding efforts. The positive relationship between a consumer’s self-concept, brand personality, and brand attachment has been documented, revealing that
consumers tend to seek and form a bond with a brand that possesses personality traits congruent with their own self-schema. Noting this congruence, marketing and advertising scholars have praised and recommended advertising campaigns modeled on the basis of Jung’s archetypes, given that Jungian archetypes are argued to have cross-cultural relevance, and their universality can allow for a distinctive and powerful marketing approach (Johnson, 2016; Mark & Pearson, 2001; Roberts, 2010; Siraj & Kumari, 2011; Tsai, 2006).
Millennial generation’s gravitation toward figures in popular culture with humanistic flaws, such as the popularity of television series figures like Breaking Bad’ssympathetic criminal Walter White and House of Cards’ engagingly connivingFrank Underwood (Martin, 2013).
Therefore, a key question for marketers and advertisers to ask is: How can my brand successfully differentiate itself in the market, while resonating with a generation of consumers that seem to crave authenticity and “real-ness” over superficiality and the ideal?
Previous research has shown that brands have successfully used archetypes to
The purpose of this study is to examine and explore the effect that authenticity in Jungian archetypal advertising has on consumer self-congruence, brand attachment, and purchase intent. I will quantitatively examine whether the introduction and exploitation of “humanistic” flaws related to a brand’s existing archetype can enable a brand to achieve an increased actual self-brand congruence and increased self-brand attachment with the consumer and forge a stronger consumer-brand relationship, perhaps leading to increased purchase intent. I want to explore and understand the resonance of archetypal advertising techniques with Millennial (18-34 year-old) consumers and determine whether authenticity allows archetypal branding to resonate on a deeper level with this increasingly powerful generation of consumers.
Literature Review Jungian Archetypal Theory
Psychologist Carl Jung defined archetypes as “forms or images of a collective nature which occur practically all over the earth as constituents of myths and at the same time as individual products of unconscious origin” (Jung, 1938, p. 63). According to Jung, archetypes should be viewed as components of the “collective unconscious, deeply embedded personality patterns that resonate within us and serve to organize and give direction to human thought and action” (Jung, 1954, p. 77). Jung believed that archetypes served as a structural, unconscious basis for human thought pattern, and human actions were subconsciously directed by basic structural archetypes. Thus, in Jungian archetype theory, our perception of the world and of ourselves is subconsciously shaped by ingrained archetypes.
psychological existence (Tsai, 2006). Jung developed the “imagination theory” that is critical to the conscious manifestation of archetypes in the individual. Jung posits that archetypes exist in the collective unconscious before individuals are born, and their “creative imagination” releases these archetypes and helps to apply their meaning to specific contexts across cultures (as cited in Tsai, 2006). While the subconscious and innate presence of archetypes within the human
consciousness has been debated and criticized by scholars and psychologists alike, archetypal imagery and constructs are undeniably common across literature, popular culture, and cultural myths, making Jungian archetypes a compelling framework through which to structure
advertising or marketing campaigns and branding efforts.
In The Hero and the Outlaw, Mark and Pearson (2001) provide a framework of twelve key Jungian archetypes that are common in current advertising and marketing campaigns. These archetypes include: Creator, Caregiver, Ruler, Jester, Regular Guy, Lover, Hero, Outlaw,
Magician, Innocent, Explorer, and Sage (Mark & Pearson, 2001). Mark and Pearson’s (2001) archetypal framework has been predominant in Jungian archetypal analysis in advertising and marketing research.
Mark and Pearson (2001) define the twelve dominant Jungian archetypes in the following ways:
• The Innocent: The core desire of “the innocent” is to experience paradise by doing things right with a goal of being happy. The innocent fears doing something wrong or bad that will provoke punishment. The innocent possesses strong faith and optimism.
o Brand examples: Coca-Cola, McDonald’s
more authentic life through seeking and experiencing new things as well as journeying. However, the explorer must watch out for aimless wandering or becoming a misfit. The explorer’s greatest fears are becoming trapped, conforming, or having inner emptiness. Autonomy, ambition, and ability to be true to oneself are they explorer’s key gifts.
o Brand examples: Starbucks, Patagonia
• The Sage: The core desire of “the sage” is the discovery of the truth. Blessed with
wisdom and intelligence, the sage seeks to use intelligence and analysis to understand the world. They seek out information and knowledge, becoming self-reflective and
understand thought processes. The sage’s greatest fear is being misled or being ignorant, and they can become too focused on studying issues without acting upon them.
o Brand examples: Procter & Gamble, Barnes & Noble
• The Hero: The core desire of “the hero” is to prove one’s worth through courageous and difficult action. Using their competence and courage, the hero exerts mastery in a way that improves the world. The hero’s strategy is to become as strong, competent and powerful as possible. The hero fears weakness and vulnerability, and the hero can be trapped by arrogance and the constant pursuit of an enemy.
o Brand examples: Nike, FedEx
• The Outlaw: The core desire of “the outlaw” is revenge or revolution. Outlaws often possess characteristics of outrageousness and radical freedom, and they often seek to disrupt or destroy what is not working for themselves or society as a whole. The outlaw fears being powerless or inconsequential, and they may have a tendency to turn to the “dark side” or engage in criminal behavior if left unchecked.
• The Magician: The core desire of “the magician” is to gain knowledge of the
fundamental laws of how the universe works. They seek to make dreams come true by finding win-win outcomes and developing vision. The magician fears unanticipated negative consequences, and they have a chance of becoming manipulative.
o Brand examples: MasterCard, Lucent Technologies
• The Regular Guy/Gal: The core desire of the “regular guy/gal” is to connect with others. This everyman figure seeks belonging through the development of ordinary, solid virtues. They are gifted with realism and empathy, but they may give up their own self in order to blend in. The biggest fear of the regular guy/gal is to stand out from others and be exiled or rejected as a result.
o Brand example: Saturn
• The Lover: The core desire of “the lover” is to attain intimacy and experience sexual pleasure. The lover seeks to be in a relationship with the people, work, experiences, or surroundings that they love by becoming more physically and emotionally attractive. They have passion, gratitude, and commitment, but they may fall into the trap of doing anything to please others and losing their own identity. They fear being alone, unwanted and unloved.
o Brand examples: Chanel, Hallmark Cards
• The Jester: The core desire of “the jester” is to live in the moment with full enjoyment. The jester seeks to have a great time and light up the world by making jokes and being funny, playful, and joyful. The joker fears boredom and being boring, and they may fall into the trap of squandering away their life.
• The Caregiver: The core desire of “the caregiver” is to protect others from harm and to help others. The caregiver is gifted with compassion and generosity. They fear selfishness an ingratitude, and may fall into the trap of self-martyrdom.
o Brand examples: Nordstrom, Marriott
• The Creator: The core desire of “the creator” is to create something of enduring value by giving form to their visions. They are gifted with creativity and imagination, but over time, they may become perfectionists. Creators fear having a mediocre vision or execution.
o Brand examples: “Sesame Street,” Serta, Biltmore Estate
• The Ruler: The core desire of “the ruler” is to exert and maintain control, as well as to create a prosperous and successful family, company, or community. The ruler fears chaos and being overthrown, and they may fall into the trap of being overly authoritarian.
o Brand example: Ralph Lauren
For the purposes of this study, I will be using the Jungian archetype of the “Hero” to investigate Millennial consumer perceptions of archetypal brands, as well as to explore the effect of humanistic flaws within archetypal marketing campaigns on brand attachment and the
consumer-brand relationship. I will be using two brands in my research that have been repeatedly associated with the “Hero” archetype in Mark and Pearson’s (2001) work as well as in the
Brand Personality
In the context of marketing and advertising research, brand personality has often been defined as “the set of human characteristics associated with a brand” (p. 347) in recent research (Aaker, 1997). For example, a brand such as Ford can use brand personality attributes such as “rugged,” “tough” or “strong” to craft their brand image and give it human-like personality. Aaker (1997) developed a generalizable brand personality framework, which defined five major brand personality dimensions, referred to as Aaker’s “Big Five”: sincerity, excitement,
competence, sophistication, and ruggedness (p. 351). Scholars have viewed Aaker’s research as a framework by which brands can establish relevance in the eyes of consumers (Bechter, Farinelli, Daniel, & Frey, 2016).
The concept of brand personality has also been shown to have an effect on brand loyalty. The work of Kim, Han, and Park (2001) indicated that the positive relationships between
attractiveness, distinctiveness, and self-expressive value of brand personality have a statistically significant effect on consumers’ identification with a brand, as well as on consumers’ word-of-mouth reports and brand loyalty. Brand personality can serve as a key market differentiator, and a distinctive and attractive brand persona can have a positive impact on brand loyalty (Kim et al., 2001).
The notion of brand personality has also been extended to include the concept of the brand-as-partner (Fournier, 1998). Fournier conceptualized the brand-consumer relationship as a dyadic relationship similar to that between two people, and treated the brand as an “active, contributing partner” in the relationship (1998, p. 344). A strong brand-as-partner relationship is ideally characterized by a strong connection between the brand and self, a high degree of
interdependence, a high level of commitment, and intimacy in the relationship (Fournier, 1998). While some scholars have critiqued Fournier’s (1998) brand-as-partner model for the implicit assumptions of using interpersonal relationship theory to describe consumer-brand relationships (Bengtsson, 2003), the brand-as-partner framework may allow for a unique understanding of the relationship between brand personality and the consumer-brand relationship, where consumers perceive brands as having specific relationship roles that can evolve and strengthen over time through changes in marketing tactics and branding (Fournier, 1998).
Figure 4: Bechter et al.’s archetype and brand personality framework. Reprinted from “Advertising between Archetype and Brand Personality,” by C. Betcher et al., in Administrative
Sciences, 2016. Retrieved from http://doi.org/10.3390/admsci6020005. Copyright 2006 by MDPI.
Bechter et al. (2016) used this original framework to evaluate international advertising
personality dimensions with their respective archetypes, their model provides an interesting and useful framework to combine Jungian archetypes and Aaker’s (1999) brand personality
dimensions, and may be useful in considering personality traits to highlight or even invert in archetypal marketing campaigns.
Brand Attachment, Self-Concept, and Self-Congruity
Brand attachment is another key component of the consumer-brand relationship. Park, MacInnis, and Priester (2006) define brand attachment as “the strength of the cognitive and affective bond connecting the brand with the self” (p. 4). Park et al. (2006) showed that brand attachment is a key driver of brand equity, and noted that brand attachment is also related to the customer’s willingness to pay a price premium, a willingness to forgive brand mishaps, and the development of brand loyalty (Park et al., 2006; Sheth & Parvatiyar, 1995). Consumer
statements that reflect brand attachment include references to the brand as “‘part of me,’ ‘an extension of myself,’ or ‘emotionally relating to me’” (Park et al., 2010, p. 5).
Sirgy (1981; 1982) developed a self-image/product-image congruity theory, in which product cues activate a self-schema, and an individual’s self-schema will influence the value placed on the product by the consumer. A self-schema has been defined in recent literature as a self-conceptualization which is “comprised of cognitive information representing generalizations about one’s self” (Barone, Shimp, & Sprott, 1999, p. 77). Sirgy (1982) developed the following four self-image/product-image congruity states (p. 289):
• Positive self-congruity: A comparison between a positive product-image perception and a positive self-image belief.
• Positive self-incongruity: A comparison between a positive product-image perception and a negative self-image belief.
• Negative self-congruity: A comparison between a negative product-image perception and a negative self-image belief.
• Negative self-incongruity: A comparison between a negative product-image perception and a positive self-image belief.
Figure 1. Sirgy’s self-esteem and self-consistency purchase motivation model. Reprinted from “Self-Concept in Consumer Behavior: A Critical Review,” by M. J. Sirgy, in Journal of Consumer Research, 1982. Retrieved from http://www.jstor.org/stable/2488624. Copyright 1982
by Oxford University Press.
Building on the work of Sirgy (1982), Aaker (1997), and Fournier (1998), Kim, Lee, and Ulgado (2005) explored the relationship between brand personality, consumer-brand
customers’ self-concept can, thus, work to create feelings of brand attachment and commitment among target consumers (Kim et al., 2005).
Additionally, Sheth and Parvatiyar (1995) posited that strong brand-customer attachments derive from the brand’s success at creating strong brand self-connections by gratifying, enabling and/or assuring the self. Brands can enable and strengthen brand-self connections by
symbolically representing the consumer’s past, present, or future self and attempting to connect with the core self (Sheth & Parvatiyar, 1995), which supports the findings of Sirgy and Kim et al. (2005).
In addition to brand personality, consumers can also experience congruity with product personality, defined by Govers and Mugge (2004) as “the set of human personality
characteristics used to describe a specific product variant” (p. 4). When consumers view the product as congruent with their self-schema, this high level of product-consumer congruence increases the product’s symbolic meaning to the consumer, increasing the consumer’s attachment to the product (Govers & Mugge, 2004).
Recent research has indicated that actual congruence, rather than ideal
brand is part of a person’s self-definition or self-concept, the closer the emotional bond. Malär et al. (2011) found that in general, brands with actual self-congruence generated higher levels of emotional brand attachment—especially when combined with high consumer-product
involvement and high consumer self-esteem—while brands with ideal self-congruence were less successful in increasing emotional brand attachment. Malär et al. (2011) emphasized that
authenticity in branding is becoming an important marketing and branding strategy, citing both psychology and consumer research literature. According to Harter (2002), a person’s authenticity is reaffirmed when he or she act in ways that reflect their “true self” (as cited in Malär et al., 2011), and an authentic relationship involves presenting one’s “genuine” self to someone (Erickson, 1995, as cited in Malär et al., 2011). When considered in the context of Fournier’s (1998) brand-as-partner framework, authenticity in the consumer-brand relationship may be of great significance.
Archetypes and Branding
Building on the work of Jung, mythologist Joseph Campbell (1949) described archetypes as basic, recurring symbols across the collective unconscious. Given the importance of the consumer-brand connection in branding literature, archetypal branding has been a frequently discussed and debated mechanism for enhancing the consumer-brand relationship and producing effective marketing strategies and branding tactics. Caldwell, Henry, and Alman (2010) proposed than there are three ways that an archetype can manifest itself in marketing strategy: advertising, brand logo and brand symbols, and the products themselves (p. 87).
resonate because of their connection to the unconscious” (p. 23)—and the conceptualization of iconic brands. Holt (2004) defined an iconic brand as one that is valued for what it represents as well as what it does. Bengtsson and Firat (2006) defined an iconic brand as one that “constellates images that serve as a means by which people have life experiences and meanings, and through which these cultural values and meanings are communicated” (p. 376). An iconic brand
resonates with consumers by connecting with the lived experiences and the subconscious value-based framework of consumers and, thus, becomes a symbolic icon in the minds of consumers. Through the use of archetypes, a brand may be able to achieve icon brand status and forge deeper connections and resonance in the minds of consumers. Tsai (2006) argues that by combining symbolic concepts of archetypes in the representation of a brand, products and brands can be transformed into icons that are “exciting, aspirational, and meaningful” (p. 651).
Tsai (2006) used the Jungian idea of “creative imagination” as a basis for developing a framework to evaluate how brands can be transformed into icons through the use of archetypes. Tsai (2006) defined the function of creative imagination in contemporary consumer culture as “to enhance the anchoring of meaning and value derived from the direct and indirect encounters with the product brand” (p. 652).
Figure 2. Tsai’s brand archetype-icon transformation framework. Reprinted from “Investigating archetype-icon transformation in brand marketing,” by S. Tsai, in Marketing Intelligence & Planning, 2006. Retrieved from http://doi.org/10.1108/02634500610701708. Copyright 2006 by
Emerald Group Publishing Limited.
contribute to the development and use of consumer imagination, which is the determinant of the brand archetypal representation becoming a brand icon.
Figure 3: Tsai’s brand archetype-icon transformation model. Reprinted from “Investigating archetype-icon transformation in brand marketing,” by S. Tsai, in Marketing Intelligence & Planning, 2006. Retrieved from http://doi.org/10.1108/02634500610701708. Copyright 2006 by
Emerald Group Publishing Limited.
Tsai’s (2006) study produced conflicting results. While his findings did support the fact that the consumer imagination mechanism is crucial to whether or not consumers perceive a brand’s archetypal symbolism as a brand icon, his investigation of the Jungian hero archetype in Nike Air Jordan branding revealed that consumer identification with the brand and the consumer perception of the brand archetype itself were more volatile than expected. Tsai (2006) found that the Nike Air Jordan archetype was seen as an icon by only half of the loyal consumers studied, and almost a quarter characterized the archetype as a “has-been” representation (p. 656).
individuals—at least some of the time—enact brands as archetypal icons through naturally occurring blog communications. While Woodside et al.’s research was restricted to narrative storytelling theory in archetypal branding research, their research also alludes to the strength of the consumer-brand relationship and the resonance of archetypes and archetypal branding in the minds of consumers.
Johnson’s (2016) recent research investigated the use of archetypal branding in terms of brand differentiation techniques. Johnson (2016) used a combination of expert interviews, consumer surveys and content analysis to explore different manifestations of the hero archetype and the explorer archetype when applied to different brands—The North Face and Patagonia (explorer archetype), as well as Nike and Under Armor (hero archetype). Johnson (2016) concluded that brands employing similar archetypes within their marketing strategies can differentiate themselves in the market by “owning” an aspect of the archetype—e.g., Under Armor owned “bravery” while Nike owned “mastery” within the hero archetype (p. 50). Johnson concluded that archetypal branding remains an effective technique, and brands can use facets and traits of various archetypes to carve out their unique market space apart from their competitors.
Justification of Study
attachment and self-congruity, the research has been confined to traditional, idealistic
conceptualizations of archetypes, seemingly with a mindset that the “perfect” iteration of these Jungian archetypes within branding is the only way to have success in archetypal branding strategy. However, previous research indicates that consumers may be yearning for authenticity in advertising and branding. Given that actual self-congruence with brand personality resulted in higher brand attachment than ideal self-congruence (Malär et al., 2011), actual self-congruence should be examined further in relation to marketing strategy, specifically Jungian archetypal branding and advertising, given the close relationship between brand personality and Jungian archetypes.
This research study aims to explore and understand the relationship between the level of authenticity present within Jungian archetypal advertising and brand attachment, consumer self-concept, self-congruence, and purchase intent. I aim to explore and understand the actual and ideal self-congruence of young millennial consumers, their perception of popular brands that use Jungian archetypal branding strategies, and their level of attachment to these brands, to better understand the relationship between brand attachment, self-congruity, and the presence of authentic, humanistic elements in archetypal branding strategy.
My research questions are:
1. How do Millennial consumers perceive themselves according to Jungian archetypes,
specifically the “hero”?
2. How do Millennial consumers perceive “hero” brands that employ Jungian archetypal advertising techniques?
o Does it influence or strengthen self-congruence?
o Does it influence or strengthen consumer purchase intent?
Methodology Reason for Survey Research
As defined by Jugenheimer, Kelley, Hudson, and Bradley (2015), the term “survey” is used to describe methods of asking questions of respondents. In this study, I conducted analytical surveys, which Wimmer and Dominick (2011) define as surveys that attempt to describe and explain why situations exist. Analytical surveys are often used in marketing and advertising research to investigate research questions and test research hypotheses, making surveys an ideal method by which to investigate all of the research questions at hand (Wimmer & Dominick, 2011).
My survey research was conducted online through Qualtrics, which is provided by the University of North Carolina at Chapel Hill. Online survey research has a multitude of benefits. Respondents will be able to take the survey from their home or a setting of their choosing, eliminating the need for an artificial or laboratory setting. Natural settings may allow
respondents to answer survey questions more realistically (Wimmer & Dominick, 2011, p. 185). Online surveys also allow a large amount of data to be collected with relative ease and low cost to the researcher (Wimmer & Dominick, 2011).
Sample
Millennials ages 18-34—the age range typically defined for this generation as per Pew Research Center (Fry, 2016). Although my convenience sample primarily consists of respondents at the lower end of that age range—undergraduate and graduate college students typically fall between the ages of 18 and 24—this age group is still within my target age bracket. However, given the fact that a convenience sample will be used, and neither the complete age range nor nationally representative demographics will be used, the results will not be generalizable across the target population. However, the results will help to inform future research on the topic.
I recruited students through a variety of methods: through word of mouth, through the School of Media and Journalism’s listserv and email notifications, through the School of Media and Journalism’s research pool, and through email promotion and distribution by other
departments at UNC-Chapel Hill. The study does not have a gender or demographic-based requirement to participate, so respondents did not need to be screened for certain qualifications before participating. Through the use of the School of Media and Journalism’s research pool, as well as other recruiting methods, I obtained 288 respondents for my first survey, and 269 respondents for my second survey. Respondents were only able to access the second survey if they had taken the first survey, ensuring that respondents for the second survey were recruited from respondents of the first survey. Given that I am examining respondent brand attachment, brand-self congruence and purchase intent before and after exposure to several advertisements, this allowed my sample to remain as consistent as possible across both surveys.
of research participation credit for their participation in each survey. These incentives helped to increase respondent participation and keep response rates high.
Survey Structure and Design
In this study, I used two surveys that are longitudinal in nature. As defined by Jugenheimer et al. (2014), longitudinal surveys compare the relationships among a set of important variables at time intervals. While my study did not involve recurring surveys given over an extended period of time, e.g. months or years, I used two surveys that examined changes in respondent attitudes over the span of a week and utilized samples from the same respondent pool.
My first survey (Appendix A) examined consumer self-concept, brand recognition, brand attachment, and respondent perception of Jungian archetypal attributes—as well as level of authenticity—in the brands presented. Throughout this study, I will be examining the hero archetype, common in advertising and branding. I chose two well-known brands for this archetype that have been repeatedly associated with the hero archetype in the existing
literature—Nike and Microsoft (Mark & Pearson, 2001; Siraj & Kumari, 2011; Johnson, 2016; Tsai, 2006). The attributes that I used to assess brand personality and consumer self-concept, as well as the questions used to assess brand attachment, were drawn from relevant marketing and branding literature on the subject (Huang et al., 2012; Malär et al., 2011; Park, C. W., MacInnis, D. J., Priester, J., Eisingerich, A. B., & Iacobucci, D., 2010).
entitled “Find Your Greatness,” depicts an overweight preteen boy jogging along a deserted road. The voiceover discusses how greatness is not reserved for the ‘heroes’ among us—it is something that everyone has inside of them, and something that can be achieved by anyone. This advertisement introduces a ‘flawed,’ imperfect character—the young man—rather than the perfectly fit athletes of many Nike advertisements, and champions a message of greatness within all people, rather than an elite few. The Microsoft advertisement, entitled “The Browser You Loved to Hate,” focused on one of Microsoft’s products, Internet Explorer. Playing off of the negative reputation surrounding Internet Explorer, this advertisement bluntly acknowledges the flaws of Internet Explorer by focusing on the story of a man who could not stop himself from uninstalling the product from others’ computers. As the man sits in a mock therapy session for hating the browser, he acknowledges that latest Internet Explorer version is “actually good” (00:45). Unlike Microsoft advertisements that showcase the ‘heroic’ strength, speed, and ability of Microsoft products, this advertisement showcased a “flawed” character in therapy and
acknowledged the flaws in its own products using self-deprecatory humor. After viewing each advertisement, respondents were then asked to answer the same questions regarding consumer self-concept, brand recognition, brand attachment, and respondent perception of Jungian archetypal attributes in order to ascertain if there is any meaningful and significant change in consumer attitude caused by the advertisements.
relation to various archetypal and brand personality attributes that have been established in the literature, as well as measuring brand attachment. These questions were followed by multiple-choice questions assessing levels of actual and ideal brand-self congruence in relation to the brands in question. Finally, I ended the questionnaire with demographic questions, including age, gender, ethnicity, and income. Identifying information—such as PID and name for School of Media and Journalism research participation credit—was protected and obtained in a separate linked survey, so that it was separated from all responses. Email addresses that were obtained for the purposes of the gift card drawing were also collected and stored separately from all
participant responses.
The purpose of the second survey was to expose respondents to short, 30-second to one-minute advertisements for the aforementioned brands—Nike and Microsoft—that include elements of authenticity or flawed archetypes. First, I used Likert scale questions to assess respondents’ archetypal personality traits. Immediately afterwards, respondents were exposed to the Nike advertisement, followed by a set of questions related to the Nike brand. Then,
respondents were exposed to the Microsoft advertisement, which was followed by the same set of questions, but related to the Microsoft brand. This set of questions consisted of the following: overall impression questions to assess respondents’ purchase intention, willingness to
research participation credit—was protected and obtained in a separate linked survey, so that it was separated from all responses. Email addresses that were obtained for the purposes of the gift card drawing were also collected and stored separately from all participant responses.
Safety Procedures
In order to protect the identity of respondents, I used the “Anonymous Link” option in Qualtrics. This option does not save any identifying information on respondents. In order to provide students in the School of Media and Journalism with research participation credit for classes, I had to collect these students’ names and university identification numbers. However, I embedded a link to separate Qualtrics survey at the end of each survey to allow School of Media and Journalism students to enter in their identifying information while protecting respondent identities and keeping them separate from all survey responses. In order to inform respondents if they have won the gift card drawing, I collected respondent email addresses. However, to further protect respondent identities and keep responses anonymous, I embedded a link to separate Qualtrics survey at the end of each survey to collect these email addresses while keeping this identifying information separate from all survey responses. Additionally, I used the “Prevent Ballot Box Stuffing” setting in Qualtrics in order to ensure that respondents can take each survey only one time.
Limitations of Survey Research
As previously discussed, there are several limitations of online surveys and survey research that I attempted to mitigate through my survey design. Although a lack of a controlled and monitored setting can pose a risk in any kind of research, the use of online surveys that can be easily accessed remotely on a respondent’s computer or cellular device can encourage increased respondent participation, as well as allow respondents to complete the surveys in a natural and comfortable setting of their choosing. Additionally, the use of Qualtrics to structure and manage my survey allowed me to ensure that respondents can only take the survey one time, through the use of the “Prevent Ballot Box Stuffing” option. However, there will always be the risk that a respondent will allow another person to complete the survey for them, or the
respondent may fill out the surveys with “bogus responses” (Wimmer & Dominick, 2014). While respondent anonymity and the lack of a controlled setting makes such deception unpreventable, the use of a large convenience sample (approximately 250-300 respondents) helped to offset this.
Additionally, generalizability issues accompany the use of a convenience sample for this research. However, given the fact that the surveyed population primarily consisted of 18-24 year old college students—a respondent group that is within my target segment of 18-34 year-olds— the data will serve to reveal some primary insights into my target population and research questions, and will serve to guide and inform future research.
Findings Millennial Archetypal Self-Perception
Across both surveys, Millennial respondents were asked to state the level of perceived fit between a set of Jungian hero archetype attributes and themselves (Appendices A and B). Survey 1 Survey 2
Mean Two Box % Top Maximum Freq. of Mean Two Box % Top Maximum Freq. of
Genuine 4.18 82.66 105 4.18 83.97 86
Kind 4.03 77.86 75 4.03 78.39 65
Competent 3.93 81.48 40 3.94 76.79 47
Intelligent 3.75 69.01 32 3.85 74.68 38
Strong 3.51 54.24 18 3.60 58.23 25
Table 1: Highest-ranking attributes among Millennial respondents in Survey 1 (271 respondents) and Survey 2 (236 respondents). Criteria included mean, top-two box, and frequency of maximum.
Survey 1 Survey 2
Mean % Bottom
Two Box
Freq. of
Minimum Mean
% Bottom Two Box
Freq. of Minimum
Vengeful 1.66 82.66 153 1.59 84.39 146
Weak 1.73 86.61 117 1.72 85.65 108
Arrogant 1.78 80.07 131 1.76 79.32 118
Shy 2.42 57.4 63 2.40 59.74 62
Vulnerable 2.54 54.07 35 2.36 59.57 49
Table 2: Lowest-ranking attributes among Millennial respondents in Survey 1 (271 respondents) and Survey 2 (236 respondents). Criteria included mean, bottom-two box, and frequency of minimum.
attributes that connoted mental and physical strength, compassion, and authenticity. Although the five highest-ranking attributes are hero attributes, it should be noted that they reflect a different kind of strength than the traditional Jungian hero—a strength that is less overtly physical, and more mental and emotional. Additionally, respondents tended to disassociate from attributes that connoted some form of weakness, haughtiness, or anger—a collection of traits that were
included as either foils to hero attributes, or traits that reflect hero attributes taken to the negative extreme (e.g., vengeful). It is especially notable that the attribute of “genuine” had the highest mean, top-two box ranking and frequency of maximum across both surveys. This pattern repeated itself when the data was segmented by gender, income, and ethnicity. The fact that respondents identified most strongly with a sense of authenticity—even above ‘heroic’ qualities such as strength and competence—reflects and affirms other scholarship in the field that has indicated a trend toward authenticity within Millennial self-perception. Given that an authentic relationship involves presenting one’s “genuine” self to someone (Erickson, 1995, as cited in Malär et al., 2011), Millennial self-definition as “genuine” may signal an opportunity to exploit this attribute in advertising to develop a more “genuine” and strong consumer-brand relationship.
Archetypal Brand Perception
A. Customer Satisfaction and Opinion of Nike Brand
Mean % Top-Two Box
Overall Impression 4.40 91.88
Likelihood to Recommend 4.16 78.60
Purchase Satisfaction 4.49 94.83
Table 3: Mean and top-two-box percentages for three questions assessing brand opinion from Survey 1 (271 respondents) regarding the Nike brand. Responses were on a 5-point scale.
Customer satisfaction with the Nike brand —comprised of purchase satisfaction and likelihood to recommend—was very high overall, with means above 4 on a 5-point Likert scale and top-two-box percentages well over three-quarters of respondents. Overall impression was overwhelmingly positive as well, with a mean of nearly 4.5 on a 5-point scale, and a top-two-box percentage nearing 100. Survey 2 results are not presented in Table 3 because there was no statistically significant difference in overall impression, likelihood to recommend, and purchase satisfaction between Survey 1 and Survey 2.
B. Archetypal Brand Perception of Nike
Survey 1: Nike Survey 2: Nike
Mean % Top
Two Box
Freq. of
Maximum Mean
% Top Two Box
Freq. of Maximum
Strong 4.30 88.56 123 Strong 4.28 87.12 106
Powerful 4.28 90.04 119 Powerful 4.21 83.83 102
Tough 4.04 77.77 94 Tough 4.10 78.39 87
Adventurous 4.04 78.6 89 Adventurous 4.05 75.85 85
Competent 3.90 74.91 60 Courageous 4.02 79.23 68
Table 4: Highest-ranking attributes among Millennial respondents in Survey 1 (271
respondents) and Survey 2 (236 respondents) regarding the Nike brand. Criteria included mean, top-two box, and frequency of maximum. Responses were on a 5-point scale.
Survey 1: Nike Survey 2: Nike
Mean % Bottom Two Box Minimum Freq. of Mean % Bottom Two Box Minimum Freq. of
Weak 1.18 94.47 243 Weak 1.21 95.76 197
Vulnerable 1.32 91.10 216 Shy 1.36 92.80 173
Shy 1.33 92.99 212 Vulnerable 1.49 88.14 161
Vengeful 1.55 84.87 177 Vengeful 1.53 84.74 159
Arrogant 2.69 43.71 70 Arrogant 2.40 55.32 73
Table 5: Lowest-ranking attributes among Millennial respondents in Survey 1 (271 respondents) and Survey 2 (236 respondents) regarding the Nike brand. Criteria included mean, bottom-two box, and frequency of minimum. Responses were on a 5-point scale.
Unlike their own self-perception according to Jungian hero attributes, Millennial respondents viewed Nike as a traditional Jungian “hero,” choosing attributes that focused more on physical strength and ability in Survey 1. However, shared top attributes between respondents and Nike included “competent” and “strong.” After advertisement exposure, “courageous” moved into the five highest-ranking attributes, signaling that perhaps the inclusion of an
increasingly brave. Additionally, respondents distanced both themselves and Nike from the same attributes—weak, vulnerable, shy, vengeful, and arrogant—albeit in a different order. Although respondents seemed to view themselves as a less physical kind of “hero” than Nike, they shared the aversion to weakness, arrogance, and an unforgiving nature.
Table 6: Statistically significant differences in Jungian attribute perception for the Nike brand between Survey 1 (271 respondents) and Survey 2 (236 respondents). Responses were on a 5-point scale.
*A two-sample t-test was used due to respondent attrition in Survey 2.
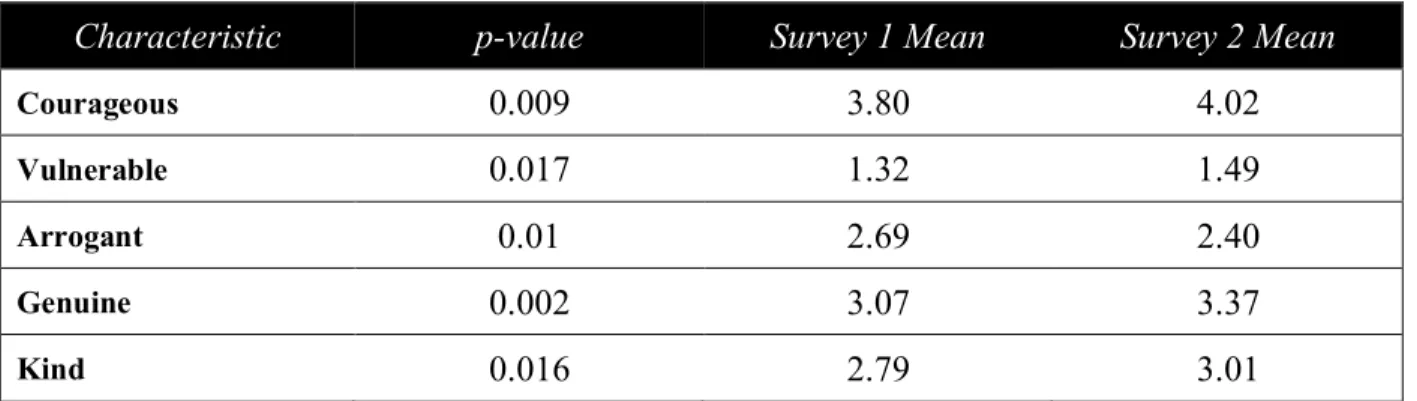
Table 6 shows the statistically significant differences in Jungian attribute perception for the Nike brand between Survey 1 and Survey 2. The significance of these differences indicates that introducing authenticity and imperfect, flawed figures into Hero archetype advertising can influence and change Millennial consumers’ brand perception. Nike was seen as significantly more courageous, genuine, and kind after respondent exposure to the advertisement—all positive attributes that benefit brand perception. It is notable that genuine and kind were the top two of the five highest-ranking hero attributes in respondents’ self-perception. The significant increase in means of these shared positive attributes suggests that there may also be an increase in actual self-congruence with Nike. Additionally, there was a statistically significant difference in the perception of Nike as arrogant, indicating that such authenticity in advertising has the potential to decrease negative brand perception as well as increase positive brand perception. The only
Characteristic p-value Survey 1 Mean Survey 2 Mean
Courageous 0.009 3.80 4.02
Vulnerable 0.017 1.32 1.49
Arrogant 0.01 2.69 2.40
Genuine 0.002 3.07 3.37
negative change in attributes was the difference in perception of Nike as vulnerable. This increase in perception of vulnerability may be due to the fact that the physically ‘imperfect’ figure in the advertisement—the young boy who was overweight and jogging at a slow pace— may have been perceived as physically vulnerable, and this may have impacted some
respondents’ perception of the brand.
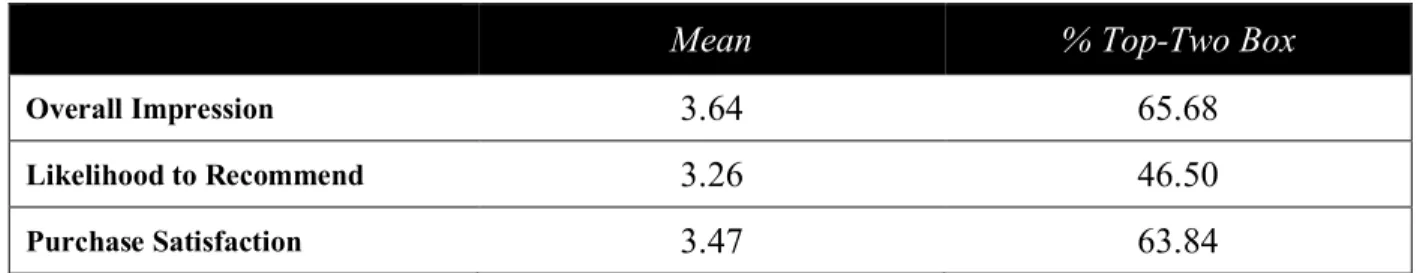
C. Customer Satisfaction and Opinion of Microsoft Brand
Mean % Top-Two Box
Overall Impression 3.64 65.68
Likelihood to Recommend 3.26 46.50
Purchase Satisfaction 3.47 63.84
Table 7: Means and top-two-box percentages for three questions assessing brand opinion from Survey 1 (271 respondents) regarding the Microsoft brand. Responses were on a 5-point scale.
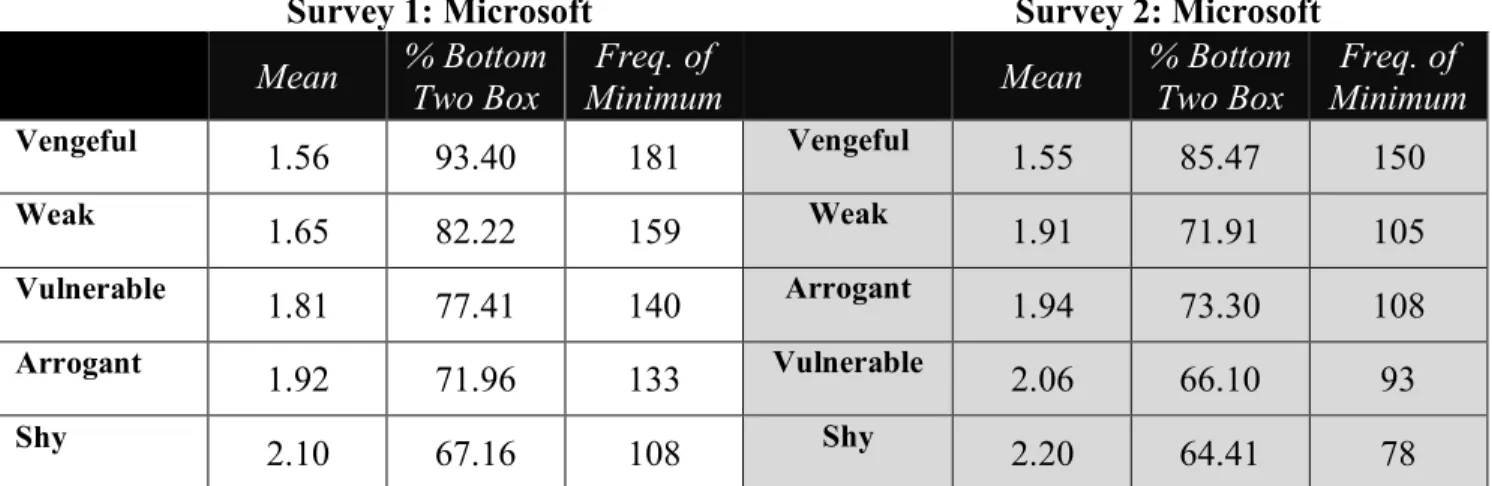
D. Archetypal Brand Perception of Microsoft
Across both surveys, respondents were asked to state the level of perceived fit between a set of Jungian hero archetypal attributes and the Microsoft brand (Appendices A and B). Survey 1 results reflect respondent perception pre- advertisement exposure, and Survey 2 results reflect respondent perception post- advertisement exposure. The five highest-ranking and lowest-ranking attributes are summarized below.
Survey 1: Microsoft Survey 2: Microsoft
Mean Two Box % Top Maximum Freq. of Mean Two Box % Top Maximum Freq. of
Intelligent 4.10 74.91 122 Intelligent 3.92 67.79 89
Competent 3.80 65.55 86 Competent 3.49 53.42 54
Powerful 3.14 44.07 36 Genuine 2.98 36.76 24
Genuine 3.00 35.42 28 Powerful 2.88 30.63 26
Kind 3.78 34.73 13 Kind 2.77 26.39 14
Table 8: Highest-ranking attributes among Millennial respondents in Survey 1 (271
respondents) and Survey 2 (236 respondents) regarding the Microsoft brand. Criteria included mean, top-two box, and frequency of maximum. Responses were on a 5-point scale.
Survey 1: Microsoft Survey 2: Microsoft
Mean % Bottom Two Box Minimum Freq. of Mean % Bottom Two Box Minimum Freq. of
Vengeful 1.56 93.40 181 Vengeful 1.55 85.47 150
Weak 1.65 82.22 159 Weak 1.91 71.91 105
Vulnerable 1.81 77.41 140 Arrogant 1.94 73.30 108
Arrogant 1.92 71.96 133 Vulnerable 2.06 66.10 93
Shy 2.10 67.16 108 Shy 2.20 64.41 78
Unlike their perception of Nike as a traditional Jungian “hero,” Millennial respondents viewed Microsoft as a kind of hero similar to themselves, describing Microsoft with four of the five highest-ranking attributes from their own self-perception—intelligent, competent, genuine, and kind. In this way, respondents defined the Jungian hero in two different ways—the
physically strong and masterful hero of Nike, and the emotionally and mentally strong hero of Microsoft and of Millennial respondents themselves. Interestingly, respondents distanced Microsoft from the same attributes that they distanced themselves and Nike from—weak, vulnerable, shy, vengeful, and arrogant—albeit in a different order. This pattern indicates that these attributes are seen as antithetical to the Millennial perception of the hero and the Millennial himself.
Table 10: Statistically significant differences in Jungian attribute perception for the Microsoft brand between Survey 1 (271 respondents) and Survey 2 (236 respondents). Responses were on a 5-point scale.
*This p-value is almost significant at a 95% CI (p-value = 0.05). It is included here as an indicator of a potentially statistically significant difference.
**A two-sample t-test was used due to respondent attrition in Survey 2.
Table 10 shows the statistically significant differences in Jungian attribute perception for the Microsoft brand between Survey 1 and Survey 2. The statistical significance of these
differences, along with the statistically significant differences observed among Nike’s archetypal perception, further strengthens the argument that introducing authenticity and imperfect, flawed figures into hero archetypal advertising can influence and change Millennial consumers’ brand
Characteristic p-value Survey 1 Mean Survey 2 Mean
Competent 0.002 3.80 3.49
Powerful 0.017 3.14 2.88
Weak 0.002 1.65 1.91
Vulnerable 0.006 1.81 2.06
perception. However, unlike Nike, the kind of honesty and flaws that were presented in the Microsoft advertisement had a negative effect on consumer perception and increased the perception of low-ranking attributes in the Microsoft brand—attributes that respondents distanced themselves from in their self-perception. After exposure to the Microsoft
advertisement, perceptions of Microsoft as weak and vulnerable increased, and Microsoft was seen as less intelligent, less powerful, and less competent. Although this did not change the highest- and lowest-ranking attributes, these differences suggest that the approach of using self-deprecating humor to create a sense of authenticity and honesty may not resonate with
Millennials and may actually harm brand perception and consumer-brand attachment.
Brand Attachment
personal connection statement is an alternate phrasing of the original statement in the brand-self connection section.
A. Brand Attachment – Nike
Table 11: Differences in brand attachment for the Nike brand between Survey 1 (271
respondents) and Survey 2 (236 respondents). Responses were on a 5-point scale. Differences with statistically significant p-values (< 0.05 with 95% CI) are bolded, and these significant results are highlighted in gray.
Statement p-value Survey 1 Mean Survey 2 Mean
Nike is a part of me and
who I am. < 0.0001 2.72 3.40
I feel personally
connected to Nike. < 0.0001 3.04 3.75
I feel emotionally
bonded to Nike. < 0.0001 2.88 3.57
Nike says something to other people about who I
am. 0.295 3.62 3.78
My thoughts and feelings about Nike
come to mind naturally. 0.009 4.06 4.44
My thoughts and feelings about Nike come to mind so naturally and instantly that I don’t have control over them.
< 0.0001 3.10 3.70
The word “Nike” evokes good thoughts and
feelings. 0.015 4.55 4.87
I have many thoughts
about Nike. 0.001 3.53 4.03
I would be distressed if Nike went out of
business. 0.011 3.77 4.17
Life would be hard to
Statement p-value Survey 1 Mean Survey 2 Mean
I feel like I have a personal connection with
Nike.* < 0.0001 2.87 3.31
Table 12: Differences in personal connection for the Nike brand between Survey 1 (271 respondents) and Survey 2 (236 respondents). Responses were on a 5-point scale. Differences with statistically significant p-values (< 0.05 with 95% CI) are bolded, and these significant results are highlighted in gray.
*Alternate phrasing of the original personal connection statement in the brand-self connection section.
B. Brand Attachment – Microsoft
Table 13: Differences in brand attachment for the Microsoft brand between Survey 1 (271 respondents) and Survey 2 (236 respondents). Responses were on a 5-point scale. Differences with statistically significant p-values (< 0.05 with 95% CI) are bolded, and these significant results are highlighted in gray.
*This p-value is almost significant at a 95% CI (p-value = 0.05). It is included here as an indicator of a potentially statistically significant difference.
Statement p-value Survey 1 Mean Survey 2 Mean
Microsoft is a part of me
and who I am. 0.037 2.40 2.68
I feel personally
connected to Microsoft. 0.051* 2.51 2.79
I feel emotionally
bonded to Microsoft. 0.052* 2.27 2.25
Microsoft says something to other
people about who I am. 0.97 2.65 2.65
My thoughts and feelings about Microsoft
come to mind naturally. 0.12 3.18 3.42
My thoughts and feelings about Microsoft come to mind so naturally and instantly that I don’t have control over them.
0.007 2.62 3.01
The word “Microsoft” evokes good thoughts
and feelings. 0.25 3.22 3.39
I have many thoughts
about Microsoft. 0.18 2.85 3.03
I would be distressed if Microsoft went out of
business. 0.20 3.58 3.37
Life would be hard to imagine without
Statement p-value Survey 1 Mean Survey 2 Mean
I feel like I have a personal connection with
Microsoft.* 0.75 2.40 2.36
Table 14: Differences in personal connection for the Microsoft brand between Survey 1 (271 respondents) and Survey 2 (236 respondents). Responses were on a 5-point scale. Differences with statistically significant p-values (< 0.05 with 95% CI) are bolded, and these significant results are highlighted in gray.
*Alternate phrasing of the original personal connection statement in the brand-self connection section.
The results presented in Table 13 and Table 14 reveal that two of the differences in brand attachment between Survey 1 and Survey 2 are statistically significant and meaningful, and two differences are less than two-hundredths of a point away from being meaningful. Overall, exposure to the advertisement had a moderate effect on respondent brand attachment to the Microsoft brand—while the brand-self connection and brand prominence aspects of brand attachment were affected, the statistical significance varies slightly among these aspects. While the presence of significance in these results, along with the strong meaningful differences present within Nike brand attachment results, point to the ability of authenticity and flaws in Jungian archetypal advertising can influence and strengthen brand attachment, I posit that the difference in levels of statistically significant difference between the two hero brands is due largely to the difference in messaging tactics. While the Nike advertisement used the inclusion of flawed and imperfect figures to create an authentically empowering message, the Microsoft advertisement used self-deprecating humor to create a sense of authenticity and honesty that may not have resonated with Millennial respondents.
Self-Congruence
Malär et al. (2011). The first two statements for each brand measure actual self-congruence, and the second two statements for each brand measure ideal self-congruence.
A. Actual and Ideal Self-Congruence – Nike
Table 15: Differences in actual self-congruence for the Nike brand between Survey 1 (271 respondents) and Survey 2 (236 respondents). Responses were on a 5-point scale. Differences with statistically significant p-values (< 0.05 with 95% CI) are bolded, and these significant results are highlighted in gray.
Table 16: Differences in ideal self-congruence for the Nike brand between Survey 1 (271 respondents) and Survey 2 (236 respondents). Responses were on a 5-point scale. Differences with statistically significant p-values (< 0.05 with 95% CI) are bolded, and these significant results are highlighted in gray.
*This p-value is almost significant at a 95% CI (p-value = 0.05). It is included here as an indicator of a potentially statistically significant difference.
The results presented in Tables 15 and 16 reveal that Millennial respondents lacked a strong actual or ideal self-congruence with Nike. While the means for ideal self-congruence with Nike are slightly higher than those for actual self-congruence, the only truly statistically
significant difference occurred in the second actual self-congruence statement. A truly
meaningful difference between actual and ideal self-congruence for Nike did not fully manifest
Statement p-value Survey 1 Mean Survey 2 Mean
The personality of Nike is consistent with how I
see myself. 0.54 2.91 2.97
The personality of Nike
is a mirror image of me. 0.047 2.13 2.32
Statement p-value Survey 1 Mean Survey 2 Mean
The personality of Nike is consistent with how I
see my ideal self. 0.055 3.31 3.50
The personality of Nike is a mirror image of my
across each set of measures, which is in line with the mixed results of Nike’s archetypal brand perception analysis.
B. Actual and Ideal Self-Congruence – Microsoft
Table 17: Differences in actual self-congruence for the Microsoft brand between Survey 1 (271 respondents) and Survey 2 (236 respondents). Responses were on a 5-point scale. Differences with statistically significant p-values (< 0.05 with 95% CI) are bolded, and these significant results are highlighted in gray.
Table 18: Differences in ideal self-congruence for the Microsoft brand between Survey 1 (271 respondents) and Survey 2 (236 respondents). Responses were on a 5-point scale. Differences with statistically significant p-values (< 0.05 with 95% CI) are bolded, and these significant results are highlighted in gray.
The results presented in Tables 17 and 18 reveal that Millennial respondents lacked a strong actual and ideal self-congruence with Microsoft. Both means are under 3, showing a weak self-congruence, and there was no statistically significant difference between the pre- and post-advertisement exposure results. This may have been due, in part, to the lack of resonance and messaging tactics of the Microsoft advertisement.
Statement p-value Survey 1 Mean Survey 2 Mean
The personality of Microsoft is consistent
with how I see myself. 0.49 2.28 2.22
The personality of Microsoft is a mirror
image of me. 0.20 1.94 2.06
Statement p-value Survey 1 Mean Survey 2 Mean
The personality of Microsoft is consistent with how I see my ideal self.
0.70 2.29 2.25
The personality of Microsoft is a mirror
Across both the Nike and Microsoft self-congruence results, there was a lack of strong self-congruence, as well as a lack of statistically significant differences between Survey 1 and Survey 2 self-congruence measures. While flawed and authentic advertising may have had little impact on actual and ideal self-congruence in this survey, further research should explore this relationship with a larger, more representative sample of Millennials and various archetypal brands and advertisements.
C. Actual/Ideal Self-Congruence and Brand Attachment
The personality of Nike is consistent
with how I see myself.
The personality of Nike is a mirror
image of me.
The personality of Nike is consistent with how I see my
ideal self.
The personality of Nike is a mirror image of my ideal
self. Nike is a part of
me and who I am. 0.37 0.43 0.22 0.24
I feel personally
connected to Nike. 0.40 0.40 0.29 0.29
I feel emotionally
bonded to Nike. 0.42 0.46 0.26 0.29
Nike says
something to other people about who I am.
0.41 0.42 0.32 0.37
My thoughts and feelings about Nike come to mind naturally.
0.26 0.19 0.23 0.16
My thoughts and feelings about Nike come to mind so naturally and instantly that I don’t have control over them.
0.22 0.25 0.18 0.14
The word “Nike” evokes good thoughts and feelings.
I have many thoughts about
Nike. 0.24 0.28 0.17 0.14
I would be distressed if Nike went out of business.
0.26 0.31 0.23 0.23
Life would be hard to imagine without
Nike. 0.24 0.29 0.13 0.16
Table 19: Pearson correlation matrix for the Nike brand between Survey 1 (271 respondents) and Survey 2 (236 respondents). Correlations above 0.40 are bolded.
The personality of Microsoft is consistent with how I see myself.
The personality of Microsoft is a mirror image of
me.
The personality of Microsoft is consistent with how I see my ideal
self.
The personality of Microsoft is a mirror image of my
ideal self.
Microsoft is a part of me and who I
am. 0.51 0.49 0.55 0.45
I feel personally connected to
Microsoft. 0.46 0.39 0.48 0.40
I feel emotionally bonded to
Microsoft. 0.53 0.45 0.52 0.47
Microsoft says something to other people about who I am.
0.52 0.40 0.51 0.44
My thoughts and feelings about Microsoft come to mind naturally.
0.23 0.17 0.20 0.19
My thoughts and feelings about Microsoft come to mind so naturally and instantly that I don’t have control over them.
The word
“Microsoft” evokes good thoughts and feelings.
0.49 0.43 0.52 0.49
I have many thoughts about
Microsoft. 0.29 0.29 0.29 0.27
I would be distressed if Microsoft went out of business.
0.29 0.23 0.33 0.27
Life would be hard to imagine without
Microsoft. 0.31 0.24 0.28 0.28
Table 20: Pearson correlation matrix for the Microsoft brand between Survey 1 (271 respondents) and Survey 2 (236 respondents). Correlations above 0.40 are bolded.
Malär et al. (2011) posited that brands with stronger actual self-congruence generated higher levels of emotional brand attachment than brands with stronger ideal self-congruence. As a partial investigation into this statement, I used Pearson correlations to investigate the
correlations between actual and ideal self-congruence measures and brand attachment aspects across Survey 1 and Survey 2 for both brands. For the Nike brand, actual self-congruence measures resulted in the strongest correlations (> 0.40). These correlations were clustered in the brand-self connection brand attachment metric. While my analysis of self-congruence revealed slightly higher means for ideal self-congruence as opposed to actual self-congruence in the case of Nike, my archetypal brand perception analysis of Nike revealed that exposure to the
advertisement resulted in a statistically significant increase in attributes that matched with respondents’ actual self-perception. Although there is no definitive self-congruence for the Nike brand, brand attachment seems to have a stronger correlation with actual self-congruence.
Microsoft brand, it makes sense that one form of self-congruence does not have stronger correlations than another.
Overall, self-congruence seems to have the strongest impact on the brand-self connection aspect of brand attachment, as opposed to the brand prominence and brand attitude strength aspects. However, given that self-congruence was relatively weak and inconclusive across both brands, stronger correlations may occur in additional research using a larger, more representative sample of Millennials and various brands and advertisements.
Purchase Intent
A. Purchase Intent – Nike and Microsoft
Table 21: Differences in purchase intent for the Nike brand between Survey 1 (271 respondents) and Survey 2 (236 respondents). Responses were on a 5-point scale. Differences with statistically significant p-values (< 0.05 with 95% CI) are bolded, and these significant results are highlighted in gray.
Table 22: Differences in purchase intent for the Microsoft brand between Survey 1 (271 respondents) and Survey 2 (236 respondents). Responses were on a 5-point scale. Differences with statistically significant p-values (< 0.05 with 95% CI) are bolded, and these significant results are highlighted in gray.
Statement p-value Survey 1 Mean Survey 2 Mean
Purchase intent 0.75 4.37 4.34
Purchase intent versus
competitor products 0.40 4.01 4.08
Statement p-value Survey 1 Mean Survey 2 Mean
Purchase intent 0.83 3.25 3.23
Purchase intent versus
The results presented in Tables 21 and 22 reveal that there is no statistically significant difference in purchase intent pre- and post-advertisement exposure across Survey 1 and Survey 2 for both brands. However, the indirect effects of authentic advertisement exposure on purchase intent are explored in the following section.
B. Impact of Brand-Self Connection, Customer Satisfaction, and Self-Congruence on Purchase Intent
To further explore the factors that influence purchase intent, I ran stepwise regressions for both brands to explore whether self-congruence, customer satisfaction, and brand-self connection helped to explain the variance in purchase intent. Survey 2 data was used to explore the indirect influence of authentic advertisement exposure. The outputs from my stepwise
regressions are presented as appendices for both Nike (Appendix C) and Microsoft (Appendix D). In the stepwise regression involving the Nike brand (Appendix C), the R2 value was
0.387, meaning that 38.7% of the variance in purchase intent can be explained by three statistically significant factors: level of satisfaction, brand-self connection, and actual self-congruence. Level of satisfaction had the greatest impact on purchase intent variance, followed by brand-self connection and actual self-congruence. Given that the R2 value for this regression
was lower than 0.45, it cannot be said to be predictive, but it can be directionally useful. The inclusion of actual self-congruence as a statistically significant factor in this regression provides some potential evidence that actual self-congruence may directly or indirectly affect purchase intent, a prediction raised by both Sirgy (1982) and Malär et al. (2011).
In the stepwise regression involving the Microsoft brand (Appendix D), the R2 value was
self-congruence. Level of satisfaction had the greatest impact on purchase intent variance, followed by brand-self connection and ideal self-congruence. Given that the R2 value for this regression
was greater than 0.45, it can be said to be predictive. Since Microsoft had very weak results for actual and ideal self-congruence, the implications for ideal self-congruence in this regression cannot be clearly determined. However, the fact that both forms of self-congruence were factors in both regressions indicates that further research is needed into the impact of actual and ideal self-congruence on Millennial purchase intent for Jungian archetypal brands.
While level of purchase satisfaction is a fairly obvious factor in explaining variance in purchase intent, the inclusion of brand-self connection as a factor that influences purchase intent is interesting, especially in light of the fact that there was no statistically significant difference in purchase intent before and after advertisement exposure. While its influence may not have been direct, the strong influence of advertisement exposure in strengthening brand-self connection and brand attachment (Tables 12 and 13), and the subsequent influence of brand-self connection on purchase intent, makes authentic advertisement exposure a factor that has potential to indirectly impact purchase intent among Millennials.
Implications of Research Implications for Brand Perception and Brand Attachment
The results of my study revealed a discrepancy between Millennial respondents’