Age, Size, and Ownership: Firm Growth in India from 1995-2005
By: Sagar Shukla
Honors Thesis Economics Department
The University of North Carolina at Chapel Hill
April 2015
Abstract
This paper examines the impact of age, size, and ownership structure of Indian firms on the transition to different size distributions from 1995 to 2005, in addition to the impact on 10-year growth rate of sales. Over this period, the size distributions of small and medium firms widen while large firms tend to shrink. New entrants have a high
Acknowledgements
I. Introduction
This paper examines the impact age, size, and ownership structure of Indian firms have on 10-year growth rates in sales as well as the transition probability of firms moving into different size categories from 1995 to 2005. This time period is of interest because India underwent a massive de-licensing process in 1991, where the government opened up the economy and allowed foreign investments, removed regulations that previously governed price and quantity of sales, adjusted hiring and firing processes that hindered growth, and retracted from their previous import-substitution policies. Therefore,
studying Indian firm growth more than a decade after de-licensing is an effective way to determine how the country is progressing in its economic objectives, since industry comprises almost one third of yearly GDP output.
Important firm characteristics to consider when it comes to growth are size, age, and ownership. Is a particular firm size “ideal” when it comes to mobility and growth potential? Do younger or newer firms have a higher growth rate than older or already existing firms? Answering these questions can indicate whether or not the
question can indicate if there is an ownership type that is strongly associated with firm growth.
Thus, this paper seeks to explain the impact of age, size, and ownership of Indian firms on transition probabilities using a conditional multinomial logit model, in addition to using a quantile regression to determine the impact of these variables on 10-year growth rates. Sales are a good proxy for a firm’s overall size (Heshmati, 2001); therefore, this study uses firm-level panel data from the Prowess database, which includes annual sales figures from 1989-2005.Understanding what impact age, size, and ownership have on transition probabilities and growth rates can provide insights into firm mobility and the state of the Indian economy. Additionally, ownership structure is very important as it can explain how private, government, foreign, or business group ownership fares in the market with respect to growth rates.
There is rich literature about the effects of age and size on firm growth in developed countries (Heshmati, 2001; Nichter, 2009), but not as many papers written about these variables in developing countries. Shanmugan (2002) focuses on Indian firms, but this paper focuses on the pre-delicensing and short-term post-delicensing periods of 1989-1990 and 1992-1993, respectively. As this study shows in Section V, the size distribution of firms has changed greatly since 1992-1993. Therefore, this study seeks to contribute to the literature by examining the impact of firm age and size on 10-year growth rates in the long-term post-delicensing period of India’s economic history, from 1995-2005. This study will also contribute to the firm growth literature by
impacts exit and entry of firms in the market, which has not been studied before in the context of the Indian economy.
The key findings from this study include an increasing level of variation in the size distribution of small firms from 1995-2005. Small and medium firms tend to stay the same size while large firms tend to shrink with age. New entrants during this time have a high likelihood of becoming large. Foreign and business group ownership significantly increases the likelihood of becoming larger and improves the growth rate, in addition to increasing the likelihood of exit for small and medium firms, respectively. Government ownership does not have a significant impact on transition probabilities or growth rates, except for new entrants. This study reveals the benefit of being a new entrant into the market, as well as foreign-ownership for both new and existing firms. These findings are important to the firm growth literature because they highlight the strong impact of both foreign and domestic ownership on the growth rates of firms. This has policy
implications, as leaders may want to provide tailored incentives to different ownership structures in order to spur growth.
This paper is contains the following sections: a literature review that summarizes relevant papers and theories in the field of firm growth; data section that describes the Prowess database and how each variable used in the analysis is constructed and
interpreted, as well as concerns with the database; empirical methodology that explains in detail how the conditional multinomial logit model and quantile regressions are
results and findings for the multinomial logit model; results and findings for the quantile regression; and finally, conclusions of the study.
II. Literature Review
This section seeks to discuss relevant literature to this study, namely the impact of size, age, and ownership on firm growth rates. One foundational theory in the firm
growth literature is Gibrat’s law, which states that firm growth is independent of size, which is usually measured by sales volume (Hart and Prais, 1956; Simon and Bonini, 1958).In other words, a small firm should theoretically have the same proportionate sales growth as a large firm, in relative, not absolute, terms. The idea behind this is that if two firms are operating in the same market, the market forces should determine the growth rate rather than size. Many studies have proven Gibrat’s law wrong and shown a negative relationship between firm size and growth rates; as firms get larger, they grow at a slower rate (Evans, 1987; Hall, 1987; Variyam & Kraybill, 1992). Similarly, studies have shown that smaller firms in developed countries grow more quickly (Evans, 1987; Hesmati, 2001; Variyam & Kraybill, 1992). This contradicts Gibrat's law that the growth rate is independent of size.
While Gibrat’s law deals with the relationship between firm size and growth rates, a theory proposed by Jovanovic, in a seminal paper on this topic, presents a relationship between firm age and growth rates. His theory states that a firm’s growth rate will
inefficient firms decline and fail. Empirical studies supporting Jovanovic’s theory have found that enterprises in their third year of operation experience major growth (Kantis et al., 2004), and younger firms in Sweden have had faster employment growth than older
ones (Heshmati, 2001). Other studies have shown growth rates decrease as firms age (Burki & Terrell, 1998; Evans, 1987; Heshmati, 2001; Variyam & Kraybill, 1992).
As explained above, age and size of firms are two highly studied factors in the developed country firm growth literature. A hallmark study on this topic by Evans (1987) examined three firm characteristics, age, size, and number of plants that the firm
operates, to determine the impact on firm growth rates (Evans, 1987). He studied 100 U.S. manufacturing firms between 1976 and 1980 in the Small Business Data Base (SBDB) and found that firm growth is negatively correlated with size and age. As a firm gets larger or older, the growth rate decreases. These findings established that firm age is an important determinant in understanding growth rates of firms in developed countries. The results from the study supports Jovanovic’s theory, since firm growth rates and age are inversely related, and negates Gibrat’s Law, since firm size and growth rate are inversely related.
growth, but finds that age positively impacts growth, contrary to Evans’ findings. Finally, the study finds that smaller and older firms grow faster than larger and younger firms.
While both Shanmugan and Evans used firm size and age as explanatory variables to estimate growth of firms, other studies have shown that structure of ownership can significantly estimate the growth rate (Variyam & Kraybill, 1992; Lang et al., 1996; Liu et al., 1999). In conclusion, age, size, ownership are variables that impact firm growth rates and this study investigates them in depth.
III. Data
This section seeks to explain the database used in the study and how each variable employed in the analysis was created. This study uses firm-level data from the Prowess database that is compiled by the Centre for Monitoring Indian Economy (CMIE) Pvt. Ltd., Bombay. The dataset contains firm level panel data from over 27,000 firms, both public and private, in India from 1989-2005. This is a highly rich database that includes a codebook of thousands of variables, derived from an original survey under rigorous methodological framework known as normalization of the database, due to lack of uniformity across annual company accounts. The PROWESS datafields include: Basic Background, Financial Performance, Capital History, Stock Prices, Products
Manufactured, and Raw Materials Consumed.
CMIE company code and observation year are used as identifier variables. All sales data are converted from nominal to real values using the Indian Consumer Price Index from the Government of India’s Labor Bureau (Labor Bureau, Government of India). Using 1982 as the base year, all nominal variables from 1989 to 2005 are divided by the price index starting in 1989.
Because Prowess is a panel database that includes annual sales data for each firm, rather than being cross-sectional and lacking continuous coverage for firms over a long period, firm growth can be studied over periods of time. In this paper, the period of interest is from 1995-2005 because it has not been studied in previous literature. In addition, this time period allows for calculation of a 10-year growth rate, which is standard among papers in the literature, and it uses the most recent data available in the database. Besides the 10-year growth rate, this period of interest also allows for study of firm transition; however, a concern associated with this is the potential of new entrants and firm exit from the market. Firm transition and the inclusion of new entrants and exits in the analysis is discussed in Section IV.
The variables used in the analysis are age, ownership, industry, region, and log sales (Data Appendix 1), where age, ownership, and log sales are the independent variables of interest, while industry and region are fixed effects. Firm age is calculated using the year of the first sales data observed between 1989-2005. For example, if a firm exists during the entire period, it would be recorded as one year old in 1989 and
seventeen years old in 2005.
Business group represents a firm owned by either a foreign or Indian business conglomerate, government represents ownership by a co-operative, state, or central government, foreign represents ownership by an individual or group outside India, and private represents ownership by an individual or group within India. Each one of these four ownership types is constructed as a dummy variable, where “1” is recorded if the firm’s ownership group code matches the ownership type and “0” otherwise. This allows for estimation of the impact of each ownership type on the dependent variable. Data Appendix 2 depicts how the ownership categorical variable is constructed.
The fixed effect variables, region and industry, are generated similarly to ownership, in that forty-four states of registration and twenty-three NIC codes are
recoded to reflect five unique regions of India and six unique industry types, respectively. Again, each of the five regions and six industries is constructed as a dummy variable to determine the impact of each region and industry on the dependent variable. Data appendices 3 and 4 depict how the region and industry categorical variables are
constructed, respectively. Finally, log sales are calculated by taking the log of each of the available sales observations, by the company code and year.
IV. Empirical Methodology
of the data set during this period. The quantile regression employs a balanced panel of firms, as firms must exist in both 1995 and 2005 in order to calculate a 10-year growth rate. This regression also examines firm size in 1995 as an independent variable.
To examine the impact of firm age, ownership type, industry, and region on transition probabilities, the panel of firms in 1995 is split into three quantiles, also known as tertiles, based on size. Sales data is used as a proxy for size, and the first tertile
represents the smallest third of firms in the data set, the second tertile represents the middle third, and the last tertile represents the largest third. The study hereafter refers to the firms in these three tertiles as “small,” “medium,” and “large” firms, respectively. A fourth category that firms during this period could belong to is “new entrants.” These are firms that did not exist in 1995, but did exist sometime between 1995 and 2005. An entry is represented as the first instance of sales data in the panel.
Once the panel is split into the categories, the multinomial logit model can estimate the coefficients of the independent variables conditioned on which of the four categories the firm was in in 1995. The conditional multinomial logit specification, for firm i conditioned upon its size in 1995 is regressed upon the following variables,
𝑌!,!""#|!,!""# =𝛼! +𝐴𝑔𝑒! +𝑂𝑤𝑛𝑒𝑟𝑠ℎ𝑖𝑝! +𝐼𝑛𝑑𝑢𝑠𝑡𝑟𝑦!+𝑅𝑒𝑔𝑖𝑜𝑛!+𝜀! (1)
data in the panel. The variable 𝐴𝑔𝑒! represents the age of the firm based on sales data. The variable 𝑂𝑤𝑛𝑒𝑟𝑠ℎ𝑖𝑝! is a categorical variable that includes four ownership types: private, government, business group, and foreign. The 𝐼𝑛𝑑𝑢𝑠𝑡𝑟𝑦! and 𝑅𝑒𝑔𝑖𝑜𝑛! variables represent the industry type and region in which the firm operates. These are included to control for industry and region fixed effects. See Data Appendix 2, 3, and 4 for details on how each categorical variable was created and which dummy variables each includes. Finally, the expected value of the error term 𝜀! is zero and the model assumes
homoscedasticity.
The multinomial logit model is a good model to test the hypothesis that firm size, age, and ownership impact the firm’s transition probabilities, including probability of exit, since the coefficient estimates explain the transition probability from being in one category in 1995 to staying in that category or moving to a new one in 2005.
To examine the impact of firm size, age, ownership type, industry, and region on 10-year growth rates from 199-2005, a quantile regression is used to estimate the
coefficients on these variables,
𝐿𝑛 𝑆𝑎𝑙𝑒𝑠!,!""# −𝐿𝑛(𝑆𝑎𝑙𝑒𝑠!,!""#) =𝛼! +𝐿𝑛 𝑆𝑎𝑙𝑒𝑠!,!""# + 𝐴𝑔𝑒! +𝑂𝑤𝑛𝑒𝑟𝑠ℎ𝑖𝑝!+
𝐼𝑛𝑑𝑢𝑠𝑡𝑟𝑦! +𝑅𝑒𝑔𝑖𝑜𝑛!+𝜀! (2)
categories as in equation (1), the quantile regression organizes coefficient estimates into three size tertiles in 1995 to see how being in each tertile impacts the coefficient
estimates of the 10-year growth rate. The coefficients are interpreted normally as OLS coefficient estimates would be interpreted and can be plotted by quantile to observe how size distribution impacts the coefficients of size, age, and ownership type on growth rates. The assumptions on the error term remain the same as in equation (1), however there is a concern with endogeneity in this model, as 𝐿𝑛 𝑆𝑎𝑙𝑒𝑠!,!""# appears on both sides of the model, although it is used as part of the equation to calculate the 10-year growth rate dependent variable.
The quantile regression model is a good model to test the hypothesis that firm size distribution impacts the firm’s 10-year growth rate since the coefficient estimates of size, age, and ownership explain the growth rate for different size tertiles.
V. Descriptive Analysis
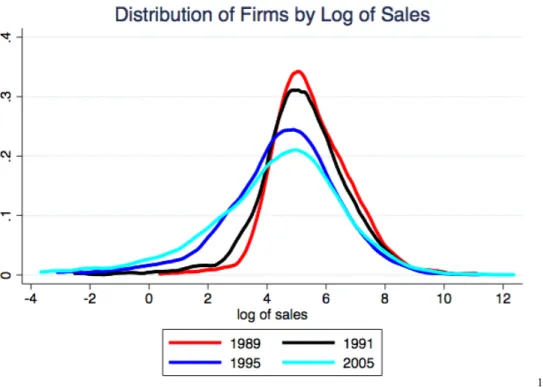
Table 1 presents summary statistics for all the firms in the panel over the period of time the data has been collected, 1989-2005 (Column 1). Column 2 displays the number of observations for each year. Column 3 depicts how the log sales of 10th percentile of the size distribution changes over this time period. Striking is that the 10th percentile in 2005 are 35% of the size they used to be in 1989, as the log sales
observation decreases each year reported in this table. Columns 4 and 5 present the statistics for the mean across all firms and firms at the 50th percentile, respectively. Here the mean in 2005 is 78% of the size it used to be in 1989 while the median firms are 85% of the size they used to be. This suggests that the firms below the mean must be getting proportionately smaller than the firms above the mean.
Columns 6 and 7 in Table 2 present results for 90th percentile and the largest firm in the panel, respectively. The log sales for the 90th percentile are 95% of what they used to be in 1989, while the maximum firms are actually larger than in 1989 by 11%. These results show that small firms get much smaller than their larger counterparts, while the largest firms actually grow during this period, when the mean of log sales is falling. The shrinking of firms is not independent of firm size; small firms are disproportionately affected.
size distribution over this period. Since small firms are getting smaller and the largest firms are getting larger, it makes sense that the size distribution gets wider.
Tables 2 and 3 organize the entire panel into size tertiles that explains in greater detail how the size distribution is changing from 1989 to 2005. Table 2 presents the entire panel of firms from 1989-2005, while Table 3 presents the panel in specific time periods: pre-delicensing (1989-1990), post-delicensing (1991-2005), short-term post-delicensing (1991-1995), and long-term post-delicensing (1995-2005).
Column 3 in Table 2 presents the 10th percentile of the size distribution, by size tertile. The 10th percentile of medium and large firms are 10.7 and 14.6 times larger than the 10th percentile of small firms, respectively. As firms get larger within each tertile, the gap between the small, medium, and large firms drop. For the mean, median, 90th
percentile, and largest firm in each tertile, the medium firms are 1.9, 1.6, 1.4, and 1.2 times larger than the small firms, respectively (Columns 4, 5, 6, and 7). Meanwhile, the large firms are 2.6, 2.2, 2.0, and 2.5 times larger than the small firms, respectively (Columns 4, 5, 6, and 7). This suggests that the 10th percentile of the small firms are proportionately much smaller than their medium and larger counterparts than compared to the mean, median, 90th percentile, and largest firm. Column 7 is interesting in that the largest firm in the entire panel is significantly larger than the largest “small” firm, as the gap between small and large firms decreases to 2.0 for the 90th percentile but increases to 2.5 for the maximum.
largest tertile, 0.15, across all years in the panel (Column 9). This suggests that large firms tend to have less variation in size than small firms.
Table 3 provides more clarity by segmenting the data into four time periods. Since this study focuses on 1995-2005, the last two sections of Table 3 are particularly
important. For 1991-1995, the 10th percentile of medium and large firms are 3.4 and 4.4 times larger than the 10th percentile of small firms, respectively. As firms get larger within each tertile, the gap between the small, medium, and large firms drop. For the mean, median, 90th percentile, and largest firm in each tertile, the medium firms are 1.6, 1.4, 1.3, and 1.2 times larger than the small firms, respectively (Columns 4, 5, 6, and 7). Meanwhile, the large firms are 2.2, 1.9, 1.8, and 2.4 times larger than the small firms, respectively (Columns 4, 5, 6, and 7).
0.46 to 0.67 (Column 9). Meanwhile, large firms experience less than a 0.07% increase during the same time, with a change from 0.14 to 0.15 (Column 9).
The small firms seem to be disproportionately affected during the period of study when the average firm is getting smaller; small firms get much smaller than their medium sized or large counterparts. Table 4 displays the percent change in mean log sales for all size tertiles from pre-delicensing, to both short-term and long-term post-delicensing. The small firms have a drop of 27% and 45% in the short-term and long-term, respectively, compared to a drop of 6% and 7% for the large firms. Because of the large drop in log sales for small firms in the long-term period (1995-2005), this becomes the focus for the conditional multinomial logit and quantile regressions. The study seeks to explain why small firms are more impacted than larger firms.
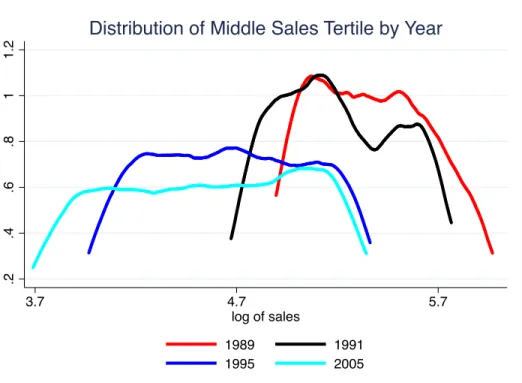
Figure 1 provides a graphic to illustrate the trend seen in Table 1, and Figures 2, 3, and 4 provide graphics for the changing size distributions for small, medium, and large firms, respectively. Figure 1 depicts the widening of the size distribution over time. Beginning in 1989, the peak of each distribution drops and the left tail becomes longer, suggesting a much higher percentage of smaller firms in 1991, 1995, and 2005,
variation in the distribution increases, but the drop is about half the size of small firms. Comparing these results to Figure 4, it becomes apparent that large firms do not
experience as intense a shrinking and spreading effect. The distribution here shifts left by about 0.7 units and the variation decreases, suggesting that large firms tend to stay the same size over time, relative to small and medium firms.
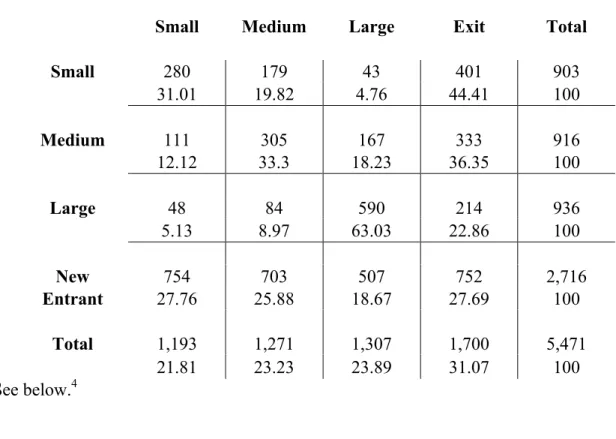
Table 5 is a transition matrix of firms from 1995-2005. It presents transition probabilities over a 10-year period, or how likely firms in each category in 1995 are to either stay in that category or transition to another in 2005. The row headings are firm categories in 1995, while the column headings are firm categories in 2005. The top number in each cell is the frequency of firms and the bottom is the percentile of total firms transitioning to that category.
Column 4 shows a 22.9% chance of exit. Large firms are much more likely to stay large than transition into any other category. This is also the only category of existing firms (as opposed to new entrants) where the chance of staying the same size is more likely than exiting the market. Small and medium firms tend to stay that size or exit the market, while large firms stay large.
Row 4 depicts the transition probabilities of new entrants. Column 1 shows a 27.8% chance of staying small in 2005, Column 2 shows a 25.9% chance of becoming medium, Column 3 shows an 18.7% chance of becoming large, and Column 4 shows a 27.7% chance of exiting the market. Since the chance of being small is largest for new entrants of all the categories, this study assumes that new entrants are also small when they enter (which is described in more detail in Section VI). New entrants are also less likely to exit than to be small. During this period, there are 2,716 new entrants coming into the market, which is nearly the amount of small, medium, and large firms combined. This could explain Figure 2 and why the distribution becomes much flatter through this period. New entrants tend to start off small and increase the spread of the small firm size distribution.
large or small, respectively. This suggests that there is a characteristic particular to large firms and new entrants that decreases their likelihood of exit, while the opposite is true for small and medium firms.
What is contributing to these transitions? What factors explain why small firms are disproportionately affected when it comes to size transitions over 1995-2005? The next section of the study analyzes the conditional multinomial logit and quantile regressions, which attempt to explain these transition probabilities and 10-year growth rates.
VI. Conditional Multinomial Logit
This section seeks to explain the probability of a firm transitioning from one size category in 1995 to another in 2005, or exiting the market, through estimating a
conditional multinomial logit model. Tables 6, 7, 8, and 9 in the appendix present estimation results from four multinomial logit regressions that were conditioned upon firms in the panel being in the smallest, middle, or largest size tertile in 1995, or entering the market between 1995 and 2005, respectively.
transitions to either a medium or large firm, or exits the market, divided by the probability that the firm stays small. If the RRR is greater than 1, the probability of transitioning to a new category is higher than staying in the same category. Likewise, if the RRR is less than 1, the probability of transitioning to a new size category is lower than staying in the same size category.
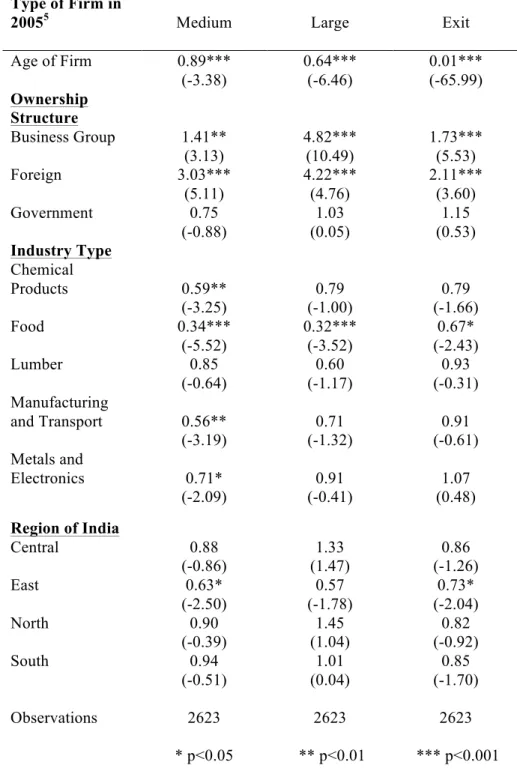
Table 6 depicts that firm age is significant at the p<0.001 level for small firms transitioning to each category in 2005. The coefficient for age in transitioning to a medium or large firm is 0.89 and 0.64, respectively, implying that as small firms age by one year, the probability of becoming larger is less than the probability of staying small (Columns 2 and 3). This trend is reflected in the transition matrix (Table 5), which shows that small firms have only a 4.8% chance of becoming large versus a 19.8% chance of becoming medium. Table 7 presents a similar result for medium sized firms. When these firms age by one year, the probability of becoming a large firm versus staying medium is 0.85, which is higher than the transition probability for small firms (Column 3).
These results provide two insights, the first of which is that small firms tend to stay small as they get older. This is also seen in Figure 2, where the size distribution of small firms widens from 1995 to 2005 – there are more firms that are smaller than the mean in 2005 than in 1995. The second insight is that it is more likely for firms to
to compete with the large firms, which have established economies of scale and a commanding market share.
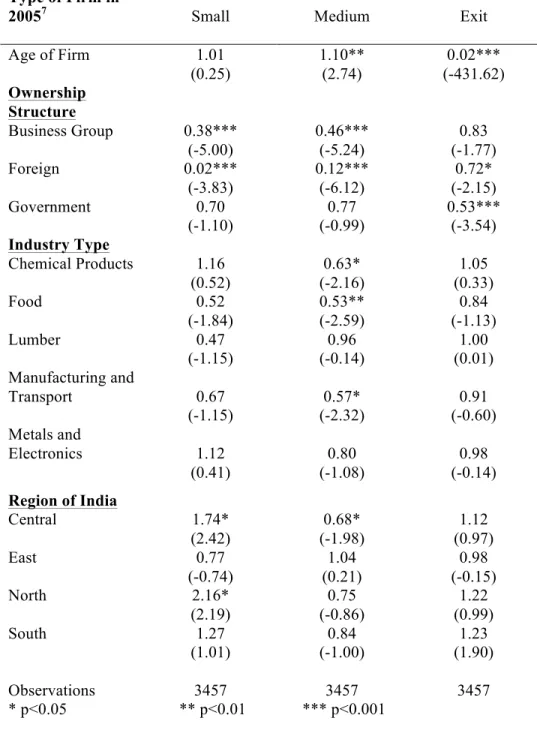
However, even large firms are not immune because of their size and position in the market. An interesting finding for the coefficient on age is seen in Table 8, where the transition probability for large firms to become medium is 1.10 with a one year increase in age, at the p<0.01 significance level (Column 3). This means that as large firms get older, there is a higher probability that they become medium sized, than stay large. This trend is seen in Figure 1, as the size distribution of all the firms in the panel becomes wider from 1995 to 2005.
A reason for this could be the addition of 2,716 new entrants in the market during this period, as the coefficient on age in Table 9 shows. With each additional year, the probability of a new entrant transitioning to a large firm is 1.14 (Column 3), relative to staying small (this study assumes that new entrants are small when they enter the market, therefore using small firm category as its base). This finding is hugely significant as the RRR is greater than one, suggesting that new entrants are more likely to become large than to stay small, compared to small and medium firms which are more likely to stay that size (since their RRR is less than one). Why would this be the case for new entrants? One reason is that these firms could be introducing novel product mixes that compete with established and larger firms, which allows the new entrants to take market share and grow quickly.
aging a year suggests firms have the resources and revenue to continue operations, decreasing the likelihood that they fail.
After age of firms, the next variable of interest in this study is ownership structure and its impact on transition probabilities. For the ownership categorical variables,
“Private” is omitted because it had the highest frequency of observations, meaning that the interpretation of the ownership variables is relative to being privately owned. In Table 6, the coefficients on business group and foreign are both greater than one and significant at the p<0.05 level for the transition of a small firm to a medium or large firm. If a firm is part of a business group, ceteris paribus, the probability that a small firm will become medium or large is 1.41 and 4.82 times higher, respectively, than if the firm were privately held (Columns 2 and 3). Similar for foreign-owned firms, the probability of becoming medium or large relative to privately owned firms is 3.03 and 4.22,
respectively (Columns 2 and 3). Being in a business group or foreign-owned increases the likelihood that a small firm will become medium or large, relative to a private firm.
Table 7 confirms this result for medium firms that are in business groups or foreign-owned. The probability for these firms to become large is 2.24 times higher for business group and 2.56 times higher for foreign-owned than being privately held
(Column 3). These results do not suggest that privately held firms hinder the transition to a larger size tertile, but because the coefficients on the business group and foreign
dummy variables are greater than one, the results suggest that they impact the transition more than being privately held.
the coefficients are higher than being part of a business group. The probability of
transitioning to being a medium firm if small in 1995 is nearly double if you are foreign-owned, with a coefficient of 3.03 versus 1.41 for a business group (Table 6, Column 2). Similarly, there is a 25% increase in the probability of transitioning from a medium to a large firm. While foreign ownership increases the likelihood of existing firms becoming larger, it also increases the likelihood for new entrants.
The coefficients for business group and foreign on a new entrant becoming large in Table 9 are significant at the p<0.001 level with values of 3.17 and 7.01, respectively (Column 3). This suggests that new entrants that are foreign owned are nearly 7 times more likely to transition to a large firm than if they were privately owned. Why does foreign ownership have such a strong impact on firm transition, both for existing firms and new entrants? For existing firms, one reason could be that foreign investors buy already large and successful firms. Table 11 depicts firm category by ownership type in 1995 and large firms are 54% of all foreign-owned firms (Column 3). Again in 2005, large firms make up the largest share of foreign-owned firms at 44% (Table 12, Column 3). These results provide evidence that foreign investors may be self-selecting and “cherry-picking” the best firms to buy. This could be why the coefficient on foreign seems much higher than business group for existing firms. But this does not necessarily explain why foreign-owned new entrants have a very high probability of becoming large.
(greater than one) of transition to a medium firm, 3.03, as well as exit, 2.11 (Columns 2 and 4). In both cases, the probability is higher than being part of a business group. This seems contradictory initially, but considering the strategy of a foreign investor it may not seem so.
Assuming that the foreign owner is a profit-maximizing investor with options to invest in multiple countries of choice and proprietary information about the Indian market, deciding to own an Indian firm suggests that the investor will continue to do business while opportunity exists in the market. However, if profits are not being made, the investor can decide to liquidate and move the investment elsewhere. This could explain why foreign-owned new entrants have a high likelihood of becoming large and small firms have a high likelihood of exit. With proprietary information, the investor could aggressively grow a new company that competes with a larger firm; on the other hand, an investor could shut down a small firm that is not performing well and look to invest elsewhere. Exiting a small firm would be easier than exiting a large firm, since the latter could have larger liabilities and be more entrenched in the economy and
community. This explanation is also supported by evidence from Table 8, where the coefficient on foreign for large firms exiting is 0.72. This suggests that for large, foreign-owned firms, exit is less likely than if the firm were privately foreign-owned (RRR is less than one). Foreign firms may be less incentivized to exit a large firm than a small firm.
than if privately owned, respectively (Column 4). Since business groups are
conglomerates with many subsidiary firms, they could function like the foreign investor looking for the right market opportunity. When the business is performing, the business group can help it grow to a medium or large firm. On the other hand, business groups can exit if the firm is not doing well and invest resources somewhere else.
An important finding in this section is that the coefficients for government
ownership are insignificant for firms becoming large at the p<0.05 level (Tables 6, 7, and 8). While this does not suggest that being government owned prevents small or medium firms from transitioning to a large firm, there is no significant evidence that it helps already existing firms, as is seen in the business group and foreign-owned firms. The only exception is the result in Table 9, where the coefficient for government is 2.67 for new entrants becoming large (Column 3). This could be a result of government policies put in place to incentivize the growth of new firms.
While industry type and region were included as fixed effects, many of the variables were not significant. As a result, this study does not place much focus on them.
VII. Quantile Regression
This section seeks to explain the 10-year growth rates of firms in the smallest, middle, and largest size tertiles from 1995 to 2005 through a quantile regression. Table 10 in the appendix presents estimation results from the regression. The coefficients on 1og sales in 1995 are -0.135 and -0.377 for medium and large firms, respectively, which are significant at the p<0.001 and p<0.01 levels (Columns 3 and 4). For every 1%
Similarly for large firms, a 1% increase in sales decreases the 10-year growth rate by 37.7%. This suggests that the growth rate of larger firms is more negatively impacted by an increase in sales than for medium sized firms.
The coefficients on firm age are -0.0573 and -0.0649 for small and medium firms, respectively, which are significant at the p<0.01 and p<0.001 levels (Columns 2 and 3). For each year a small firm ages, the 10-year growth rate decreases by 5.7%. Similarly for medium firms, an additional year the firm ages, the 10-year growth rate decreases by 6.5%. Figure 5 plots the coefficients of log sales and firm age for all three tertiles of firms. It depicts that as firms get larger, log sales has a greater negative impact on the 10-year growth rates. Alternatively, the impact of firm age gets less negative as firm size increases.
A possible explanation for the negative relationship between age and growth rate is that these aging firms must compete with fast growing new entrants, which can take up market share and prevent existing firms from maintaining aggressive growth rates. This hypothesis is supported by results from the conditional multinomial logit estimations. The coefficient on firm age for new entrants being greater than one suggests that as new entrants age, the probability of transitioning to a large firm is greater than staying small.
percent higher than a government owned firm. If a firm is foreign owned, its 10-year growth rate is 72.4% higher for small firms than being government owned, 49.0% higher for medium firms, and 334.0% higher for large firms.
This suggests that business groups improve 10-year growth rates for small firms, but foreign ownership improves growth rates for all sizes of firms. The notably high result for the foreign ownership coefficient for large firms suggests that large government firms may be very slow growing bureaucratic institutions, since the coefficient is relative to a firm being government owned. While this does not suggest that being government owned decreases your 10-year growth rate, being owned by a business group or foreign significantly improves it.
As in the multinomial logit, the estimation did not produce many significant coefficients for the industry type or region categorical variables. As a result, this study does not place much focus on them in this section.
VIII. Conclusion
This study examines the impact of firm age, size, and ownership on the
investors having proprietary information and resources, which allow them to improve growth over private and government owned firms, this result could also be due to a selection bias of foreign firms predominantly owning large firms in 1995 and 2005.
Foreign ownership is also good for new entrants, as the probability of transition to a large firm is nearly seven times higher than being privately owned. This suggests that foreign ownership helps these “startup” firms more so than any other ownership type, potentially by bringing expertise and proprietary knowledge of the Indian market into the firm’s operations. However, the probability of exit for foreign-owned small firms is more likely than private firms, while the probability of exit for foreign-owned large firms is less likely. These contradictory results, that foreign ownership can both help new entrants grow but increase the chance that small firms exit, implies that foreign ownership may view the Indian firms as part of an investment portfolio. If investments are not doing well, they can easily exit the market, as in the case of small firms. On the other hand, certain investments may be too large and entrenched in the market that exit is not an attractive option, as in the case of the large firms.
The impact of government ownership was not significant, except in the case of new entrants. While this does not suggest that being government owned prevents small or medium firms from transitioning to a large firm, there is no significant evidence that it helps already existing firms, as is seen in the business group and foreign-owned firms.
References:
Audretsch, David B., and Talat Mahmood. “New Firm Survival: New Results Using a Hazard Function.” The Review of Economics and Statistics 77, no. 1 (February 1, 1995): 97–103. doi:10.2307/2109995.
Ayyagari, Meghana, Thorsten Beck, and Asli Demirguc-Kunt. “Small and Medium
Enterprises Across the Globe.” Small Business Economics 29, no. 4 (December 1, 2007): 415–34. doi:10.1007/s11187-006-9002-5.
Beck, Thorsten, Asli Demirgüç-Kunt, and Vojislav Maksimovic. “Financial and Legal Constraints to Growth: Does Firm Size Matter?” The Journal of Finance 60, no. 1 (February 1, 2005): 137–77. doi:10.1111/j.1540-6261.2005.00727.x.
Burki, Abid A., and Dek Terrell. “Measuring Production Efficiency of Small Firms in Pakistan.” World Development 26, no. 1 (January 1998): 155–69. doi:10.1016/S0305-750X(97)00122-8.
Cefis, Elena, and Orietta Marsili. “A Matter of Life and Death: Innovation and Firm Survival.” Industrial and Corporate Change 14, no. 6 (December 1, 2005): 1167–92.
doi:10.1093/icc/dth081.
———. “Survivor: The Role of Innovation in Firms’ Survival.” Research Policy 35, no. 5 (June 2006): 626–41. doi:10.1016/j.respol.2006.02.006.
Coad, Alex, and Jaganaddha Pawan Tamvada. “Firm Growth and Barriers to Growth among Small Firms in India.” Small Business Economics 39, no. 2 (September 2012): 383–400. Evans, David S. “Tests of Alternative Theories of Firm Growth.” Journal of Political
Economy 95, no. 4 (August 1, 1987): 657–74.
———. “The Relationship Between Firm Growth, Size, and Age: Estimates for 100
Manufacturing Industries.” The Journal of Industrial Economics 35, no. 4 (June 1, 1987): 567–81. doi:10.2307/2098588.
Hart, P. E., and S. J. Prais. “The Analysis of Business Concentration: A Statistical Approach.” Journal of the Royal Statistical Society. Series A (General) 119, no. 2 (January 1, 1956): 150–91. doi:10.2307/2342882.
Heshmati, Almas. “On the Growth of Micro and Small Firms: Evidence from Sweden.” Small Business Economics 17, no. 3 (November 1, 2001): 213–28.
Jovanovic, Boyan. “Selection and the Evolution of Industry.” Econometrica 50, no. 3 (May 1, 1982): 649–70. doi:10.2307/1912606.
Kantis, Hugo, Pablo Angelelli, and Virginia Moori Koenig. "Desarrollo
emprendedor." América Latina y la experiencia internacional (2004): 35-198.
Labor Bureau, Government of India. “Monthly All India Consumer Price Index (General) for Industrial Workers.” http://labourbureau.nic.in/indtab.html.
Lang, Larry, Eli Ofek, and RenéM. Stulz. “Leverage, Investment, and Firm Growth.” Journal of Financial Economics 40, no. 1 (January 1996): 3–29.
doi:10.1016/0304-405X(95)00842-3.
Liu, Jin-Tan, Meng-Wen Tsou, and James K Hammitt. “Do Small Plants Grow Faster? Evidence from the Taiwan Electronics Industry.” Economics Letters 65, no. 1 (October 1999): 121–29. doi:10.1016/S0165-1765(99)00126-3.
Mitra, Reshmi, and Venugopal Pingali. “Analysis of Growth Stages in Small Firms: A Case Study of Automobile Ancillaries in India.” Journal of Small Business Management 37, no. 3 (July 1999): 62–75.
Nichter, Simeon, and Lara Goldmark. “Small Firm Growth in Developing Countries.” World Development 37, no. 9 (September 2009): 1453–64. doi:10.1016/j.worlddev.2009.01.013. Shanmugam, K. R., and Saumitra N. Bhaduri. “Size, Age and Firm Growth in the Indian
Manufacturing Sector.” Applied Economics Letters 9, no. 9 (July 15, 2002): 607–13. doi:10.1080/13504850110112035.
Simon, Herbert A., and Charles P. Bonini. “The Size Distribution of Business Firms.” The American Economic Review 48, no. 4 (September 1, 1958): 607–17.
IX. Appendix
Data Appendix 1: Description of Variables
Short name
Variable name
Long definition Sources
Sales Real sales in 1989 prices in millions of Rupees
Annual sales data for firms in panel format. Years of collection are 1989-2005. Data are converted to real values from nominal using a 1989 price index.
Prowess Database; and Labor Bureau, Government
of India Ln(Sales) Log of real sales Calculated by taking the log of sales after converting to real values. DatabaseProwess
Ownership
Ownership structure of firm
Constructed by recoding ownership group code variables from Prowess into categorical variable comprised of four ownership types (Business Group, Foreign, Private, and Government). Each ownership type is coded as a dummy variable, where “1” represents that a firm is owned by that particular ownership type and “0” means it is not. This allows for estimation of the impact of each ownership type on the transition probability and 10-year growth rate.
Prowess Database
Age
Age of firm based on sales data
Calculated by observing sales data from 1989-2005. The first year there is sales data recorded, the firm age is recorded as one. Each subsequent year of sales data, the firm ages by one year.
Prowess Database Industry Industry in which firm operates
Constructed by recoding NIC codes (three digit codes indicating industry types) into categorical variable
comprised of six industry types (Food, Textiles, Lumber, Chemical Products, Metals and Electronics, and
Manufacturing and Transport). Each industry type is coded as a dummy variable, where “1” represents that a firm operates in that particular industry and “0” means it does not. This allows for estimation of the impact of each industry on the transition probability
and 10-year growth rate.
Region
Region in which firm is started
Constructed by recoding state of registration variable into categorical variable comprised of five regions in India (North, South, East, West, Central). Each region is coded as a dummy variable, where “1” represents that a firm was registered in that particular region “0” means it was not. This allows for estimation of the impact of each region on the transition
probability and 10-year growth rate.
Prowess Database
Data Appendix 2: Ownership Classifications
Ownership Type
Dummy Variable in Model
Business group (Indian)
Business Group Business group (Foreign)
Co-operative
Government Government (State)
Government (Central)
Private (Indian) Private
Data Appendix 3: Region Classifications
State of Registration Region State of Registration Region
Andheri-E
West
Avenue, Vasant Kunj,
Central
Maharashtra New Delhi
Goa Delhi
Chhattisgarh Haryana
Chunabhatti Sion Madhya Pradesh
Dadra & Nagar Haveli Orissa
Daman & Diu Rajasthan
Gujarat Uttar Pradesh
Gujarat Ahmedab Vasant Kunj
Marol, Andheri-E
North Gujarat Chandigarh
North Umbhel,
Taluka-Kamrej Himachal Pradesh
Jammu & Kashmir
Andhra Pradesh
South
Punjab
Belgaum, Karnataka Uttarakhand
Karaikal Uttaranchal
Karnataka
Kerala
Puducherry
Tamil Nadu
Andaman & Nicobar
Data Appendix 4: Industry Classifications
Industry Type Dummy Variable in Model
Food
Beverages Food
Tobacco
Textiles
Apparel Textiles
Leather
Wood
Paper Lumber
Printing
Refined petroleum
Chemical Products
Chemicals
Rubber and plastic Pharmaceuticals Mineral products
Metals and Electronics
Basic metals
Metal products
Electronics
Electrical equipment Motor vehicles
Manufacturing and Transport
Machinery
Other manufacturing
Furniture
Table 1: Log Sales of All firms 1989-2005
Log Sales1
Year N p10 mean p50 p90 max sd cv
Full Sample
1989 977 4.05 5.51 5.37 7.25 11.12 1.32 0.24
1990 1102 3.98 5.48 5.39 7.26 11.16 1.41 0.26
1991 1396 3.53 5.23 5.19 7.09 11.11 1.53 0.29
1995 2878 2.27 4.53 4.67 6.72 11.27 1.91 0.42
2000 3333 2.09 4.50 4.65 6.69 11.84 1.96 0.44
2005 4175 1.40 4.32 4.56 6.87 12.36 2.25 0.52
Table 2: Log Sales of Firms by Tertile for All Years
Log Sales2 Sales
Tertile N p10 mean p50 p90 max sd cv
All Years (1989-2005)
1 15380 0.38 2.50 2.93 3.90 4.94 1.54 0.61
2 15366 4.08 4.72 4.74 5.28 5.97 0.46 0.10
3 15362 5.53 6.53 6.30 7.84 12.36 0.96 0.15
1 Values are log sales for all the firms in the panel for each year. The constant of variation term (CV) is the standard deviation (sd) divided by the mean. This term describes the magnitude of size variation among all the firms.
2 The sales tertiles represent the entire panel of firms divided into thirds by size
Table 3: Log Sales by Firm Tertile and Period
Log Sales Sales
Tertile N p10 mean p50 p90 max sd cv
Pre-delicensing (1989-1990)
1 694 3.36 4.12 4.35 4.80 4.94 0.84 0.20
2 693 5.00 5.39 5.38 5.82 5.97 0.30 0.06
3 692 6.10 6.96 6.75 8.10 11.16 0.87 0.13
Log Sales Sales
Tertile N p10 mean p50 p90 max sd cv
Post-delicensing (1991-2005)
1 14686 0.32 2.43 2.88 3.82 4.67 1.52 0.63
2 14673 4.07 4.69 4.71 5.25 5.77 0.44 0.09
3 14670 5.52 6.51 6.27 7.82 12.36 0.96 0.15
Log Sales Sales
Tertile N p10 mean p50 p90 max sd cv
Short-term Post-delicensing (1991-1995)
1 3418 1.27 2.99 3.38 4.28 4.67 1.38 0.46
2 3411 4.31 4.89 4.91 5.41 5.77 0.41 0.08
3 3412 5.63 6.58 6.35 7.81 11.27 0.92 0.14
Log Sales Sales
Tertile N p10 mean p50 p90 max sd cv
Long-term Post-delicensing (1995-2005)
1 11268 0.13 2.26 2.72 3.67 3.98 1.52 0.67
2 11262 4.03 4.63 4.64 5.20 5.45 0.43 0.09
Table 4: Percent Change in Log Sales From 1989-1991
Sales
Tertile3 (1991-1995) (1995-2005)
1 -27% -45%
2 -9% -14%
3 -6% -7%
Table 5: Transition Matrix of Firms from 1995-2005
Small Medium Large Exit Total
Small 280 179 43 401 903
31.01 19.82 4.76 44.41 100
Medium 111 305 167 333 916
12.12 33.3 18.23 36.35 100
Large 48 84 590 214 936
5.13 8.97 63.03 22.86 100
New 754 703 507 752 2,716
Entrant 27.76 25.88 18.67 27.69 100
Total 1,193 1,271 1,307 1,700 5,471
21.81 23.23 23.89 31.07 100
See below.4
3 The percent changes in mean log sales are from the pre-‐delicensing period (1989-‐
1990) to the periods in the columns.
Table 6: Multinomial Logit Regression Conditional Upon Being Small in 1995
Type of Firm in
20055 Medium Large Exit
Age of Firm 0.89*** 0.64*** 0.01***
(-3.38) (-6.46) (-65.99)
Ownership
Structure
Business Group 1.41** 4.82*** 1.73***
(3.13) (10.49) (5.53)
Foreign 3.03*** 4.22*** 2.11***
(5.11) (4.76) (3.60)
Government 0.75 1.03 1.15
(-0.88) (0.05) (0.53)
Industry Type
Chemical
Products 0.59** 0.79 0.79
(-3.25) (-1.00) (-1.66)
Food 0.34*** 0.32*** 0.67*
(-5.52) (-3.52) (-2.43)
Lumber 0.85 0.60 0.93
(-0.64) (-1.17) (-0.31)
Manufacturing
and Transport 0.56** 0.71 0.91
(-3.19) (-1.32) (-0.61)
Metals and
Electronics 0.71* 0.91 1.07
(-2.09) (-0.41) (0.48)
Region of India
Central 0.88 1.33 0.86
(-0.86) (1.47) (-1.26)
East 0.63* 0.57 0.73*
(-2.50) (-1.78) (-2.04)
North 0.90 1.45 0.82
(-0.39) (1.04) (-0.92)
South 0.94 1.01 0.85
(-0.51) (0.04) (-1.70)
Observations 2623 2623 2623
* p<0.05 ** p<0.01 *** p<0.001
Table 7: Multinomial Logit Regression Conditional Upon Being Medium in 1995
Type of Firm in
20056 Small Large Exit
Age of Firm 1.04 0.85*** 0.02***
(1.06) (-6.38) (-165.26)
Ownership
Structure
Business Group 0.73* 2.24*** 1.26*
(-2.38) (8.62) (2.39)
Foreign 0.21*** 2.56*** 1.44
(-3.31) (5.29) (1.86)
Government 0.46 0.74 0.74
(-1.93) (-1.13) (-1.11)
Industry Type
Chemical Products 0.95 0.93 1.18
(-0.26) (-0.49) (1.12)
Food 0.92 1.44* 1.25
(-0.34) (2.10) (1.35)
Lumber 0.68 0.63 0.91
(-1.29) (-1.93) (-0.43)
Manufacturing
and Transport 0.51** 1.10 1.39
(-2.70) (0.61) (1.91)
Metals and
Electronics 0.91 1.03 1.16
(-0.51) (0.17) (1.07)
Region of India
Central 0.91 1.43** 1.09
(-0.51) (2.81) (0.66)
East 0.55** 0.50*** 0.62**
(-2.99) (-4.32) (-3.26)
North 0.37* 1.25 0.77
(-2.49) (1.11) (-1.25)
South 0.83 0.99 1.12
(-1.20) (-0.09) (0.97)
Observations 2965 2965 2965
* p<0.05 ** p<0.01 *** p<0.001
Table 8: Multinomial Logit Regression Conditional Upon Being Large in 1995
Type of Firm in
20057 Small Medium Exit
Age of Firm 1.01 1.10** 0.02***
(0.25) (2.74) (-431.62)
Ownership
Structure
Business Group 0.38*** 0.46*** 0.83
(-5.00) (-5.24) (-1.77)
Foreign 0.02*** 0.12*** 0.72*
(-3.83) (-6.12) (-2.15)
Government 0.70 0.77 0.53***
(-1.10) (-0.99) (-3.54)
Industry Type
Chemical Products 1.16 0.63* 1.05
(0.52) (-2.16) (0.33)
Food 0.52 0.53** 0.84
(-1.84) (-2.59) (-1.13)
Lumber 0.47 0.96 1.00
(-1.15) (-0.14) (0.01)
Manufacturing and
Transport 0.67 0.57* 0.91
(-1.15) (-2.32) (-0.60)
Metals and
Electronics 1.12 0.80 0.98
(0.41) (-1.08) (-0.14)
Region of India
Central 1.74* 0.68* 1.12
(2.42) (-1.98) (0.97)
East 0.77 1.04 0.98
(-0.74) (0.21) (-0.15)
North 2.16* 0.75 1.22
(2.19) (-0.86) (0.99)
South 1.27 0.84 1.23
(1.01) (-1.00) (1.90)
Observations 3457 3457 3457
* p<0.05 ** p<0.01 *** p<0.001
Table 9: Multinomial Logit Regression Conditional Upon Entry Between 1995-2005
Type of Firm in
20058 Medium Large Exit
Age of Firm 1.03 1.14*** 0.00***
(1.31) (5.71) (-623.47)
Ownership
Structure
Business Group 1.09 3.17*** 1.34*
(0.52) (7.37) (2.19)
Foreign 1.80 7.01*** 1.64
(1.66) (5.88) (1.65)
Government 2.04 2.67* 2.19
(1.63) (2.05) (1.64)
Industry Type
Chemical Products 0.81 0.88 0.73*
(-1.25) (-0.58) (-2.10)
Food 0.99 1.81* 1.15
(-0.04) (2.53) (0.82)
Lumber 0.67 0.61 0.70
(-1.50) (-1.40) (-1.50)
Manufacturing and
Transport 1.22 1.84* 1.14
(0.94) (2.53) (0.70)
Metals and
Electronics 1.33 1.96** 1.11
(1.61) (3.18) (0.69)
Region of India
Central 0.91 1.54** 1.09
(-0.64) (2.60) (0.68)
East 0.60** 0.85 0.95
(-2.68) (-0.74) (-0.30)
North 1.27 1.56 1.56
(0.82) (1.28) (1.33)
South 0.65** 0.65** 0.78*
(-3.18) (-2.59) (-2.12)
Observations 2698 2698 2698
* p<0.05 ** p<0.01 *** p<0.001
8 The “small” category is left out in 2005 since it is the base for this regression. In addition, “Private,” “Textiles,” and “West” are the dummy variables omitted for ownership structure, industry type, and region of India, respectively.
Table 10: Quantile Regression on 10-Year Growth Rate
Quantile9 q33 q66 q99
Log Sales in 1995 -0.0659 -0.135*** -0.377**
(-0.0429) (-0.159) (-0.159)
Age of firm -0.0573** -0.0649*** -0.02
(-0.0246) (-0.159) (-0.159)
Ownership Structure
Business Group 0.416* 0.267 -0.831
(-0.225) (-0.159) (-0.159)
Foreign 0.724*** 0.490** 3.340***
(-0.257) (-0.159) (-0.159)
Private -0.00134 -0.0457 -0.662
(-0.232) (-0.159) (-0.159)
Industry Type
Chemical Products -0.008 0.0706 -1.24
(-0.123) (-0.159) (-0.159)
Lumber -0.0308 -0.057 -2.126
(-0.248) (-0.159) (-0.159)
Manufacturing and
Transport 0.240** 0.223** -1.182
(-0.112) (-0.159) (-0.159)
Metals and Electronics 0.153 0.155* -1.413
(-0.103) (-0.159) (-0.159)
Textiles -0.139 -0.0548 0.0962
(-0.203) (-0.159) (-0.159)
Region of India
Central -0.0491 0.0167 2.545
(-0.185) (-0.159) (-0.159)
East -0.360* -0.440*** 3.97
(-0.202) (-0.159) (-0.159)
South -0.159 -0.152 4.057
(-0.159) (-0.159) (-0.159)
West -0.0193 0.0148 3.888
(-0.159) (-0.159) (-0.159)
Constant 0.755* 2.003*** -6.289**
(-0.159) (-0.159) (-0.159)
Observations 1,800 1,800 1,800
* p<0.05 ** p<0.01 *** p<0.001
Table 11: Firm Categories by Ownership Type (Percentile), 1995
Small Medium Large Entry
Business
Group 0.17 0.29 0.54 0.32
Foreign 0.17 0.29 0.54 0.41
Government 0.24 0.27 0.49 0.36
Private 0.46 0.37 0.17 0.56
Table 12: Firm Categories by Ownership Type (Percentile), 2005
Small Medium Large Exit
Business
Group 0.14 0.18 0.40 0.29
Foreign 0.07 0.17 0.44 0.31
Government 0.15 0.23 0.32 0.29
Private 0.29 0.26 0.15 0.30
See below.10
Figure 1: Kernel Density Plot – Log Sales of All Firms by Year:
11
Figure 2: Kernel Density Plot – Log Sales of Small Firms by Year:
0
.2
.4
.6
.8
1
-4 -2 0 2 4
log of sales
1989 1991
1995 2005
Figure 3: Kernel Density Plot – Log Sales of Medium Firms by Year:
Figure 4: Kernel Density Plot – Log Sales of Large Firms by Year:
.2
.4
.6
.8
1
1.2
3.7 4.7 5.7
log of sales
1989 1991 1995 2005
Distribution of Middle Sales Tertile by Year
0
.2
.4
.6
5 6 7 8 9 10 11 12
log of sales
1989 1991
1995 2005
Figure 5: Quantile Regressions: 10-Year Growth Rate (1995-2005)
See below.12
12 This figure depicts how the impact of increasing size and age on growth rates differs
-‐0.4 -‐0.35 -‐0.3 -‐0.25 -‐0.2 -‐0.15 -‐0.1 -‐0.05 0
q33 q66 q99
β