A TLD based method to estimate bowtie filter shape in
PET/CT
INTRODUCTION
Nowadays, CT systems are routinely used for PET machines by manufacturers for attenuation correction of the PET data, arriving at PET/CT
system (1-3). The number of PET/CT scans
performed has signi$icantly increased in the past
decade and the dose per patient has subsequently also increased from PET/CT
systems (4-5) . One of the most important issues of
managing dose in the CT section of PET/CT is bowtie $ilter shaping that can be con$igured to
absorb radiation from the x-ray source to
control dose to body (4) by reducing the photon
in$luence at the $ield of view (FOV) (7-8).
There are two types of bowtie $ilters for the CT scan: head and body bowtie $ilters. The shape of the bowtie $ilter, typically made of aluminum, is complicated and its manufacturers do not necessarily provide complete data about shape
of the $ilter (6). The main role of X-ray beam
shaping $iltration including bowtie $ilters in the
CT section is to balance the signal given variation of the body thickness across the transverse sections of the body and to reduce
dose to the peripheral region of the body (2). The
bowtie $ilter and beam collimation are used for
multidetector CT (7).
The measurements of CT dose index (CTDI)
value (8) and Monte Carlo simulation studies
N. Ahmadi
1, M.N. Nasrabadi
1, A. Karimian
2*, A. Rahmim
31
Department of Nuclear Engineering, Faculty of Advanced Sciences & Technologies, University of Isfahan, Isfahan, Iran
2
Department of Biomedical Engineering, University of Isfahan, Isfahan, Iran 3
Department of Radiology and Department of Electrical & Computer Engineering Johns Hopkins University, Baltimore, MD21287, USA
ABSTRACT
Background: In CT systems, the machine u lizes a bow e filter to shape the X -ray beam and remove lower energy photons. The shape of this bow e filter is complicated and its geometry is o!en not available in detail. These renders the CT dose index (CTDI) to have different values in measurement versus Monte Carlo simula on studies and other analy cal calcula ons especially in dosimetry of internal organs. In exis ng literature, the bow e filter shape is extracted by using expensive sensors Materials and Methods: In the present work, the shape of the bow e filter of the Biograph 6 PET/CT was derived by using Thermolumenecence dosimeters (TLDs). Subsequently, to evaluate the accuracy of the body bow e filter shape as generated by TLDs, Monte Carlo simula on of CT was performed. 16 X-ray sources in various angles were used within the Monte Carlo code (MCNP-4C) to simulate the CT sec on of the PET -CT Biograph 6 system and to calculate dose. Results: The rela ve difference between simulated and measured CTDI value for the PET/CT Siemens Biograph 6 at 80, 110 and 130 kVp were 4.2, 2.9 and 2.3%, respec vely. Conclusion: In this study, we demonstrate that it is possible to calculate the bow e filter shape by using an inexpensive TLD method. The results showed that it is possible to determine the shape of the bow e filter in PET/CT using TLDs with acceptable accuracy.
Keywords: PET/CT, bowtie filter, TLD dosimeter, dosimetry. *Corresponding authors:
Dr. Alireza Karimian, Fax: +98 313 7932771
E-mail: [email protected]
Revised: March 2017 Accepted: April 2017
Int. J. Radiat. Res., October 2017; 15(4): 383-390
► Original article
DOI: 10.18869/acadpub.ijrr.15.4.383
could be different when the shape of bowtie $ilters is not provided by manufacturers especially in internal dosimetry. To estimate the
shape of the bowtie $ilter, two general approaches have been utilized in few works.
Computer simulations were developed and validated to determine the optimum bowtie $ilter for different patient sizes. A rectangle and an elliptical cutout simpli$ied shape was
assumed for the bowtie $ilter (4). Bowtie $ilter
shape was modeled by de$ining in$lection parameter FW (Filter Isocenter and Width) from
1 to 9 for GE LightSpeed VCT. It should also be emphasized that the drawback of this method
was utilizing a simple shape consisting a rectangle and an elliptical cutout and large image noise errors for diameter more than 35
cm (4). Belinato et al. (9) used the AGMS-D sensor
(Accu-Gold kit Radcal Corporation) to estimate the bowtie $ilter shape of the Siemens Biograph 16 Truepoint and GE Discovery VCT PET/CT systems in 2015. They used 9 measurement
points for estimating the bowtie $ilter by AGMS-D sensor for available kV in both systems.
They showed approximately 4% difference
between measurement and simulation CTDI100
for kVp=110 at the center position (9). Using this
method for estimating the shape of body bowtie $ilter is relatively expensive due to the use of semiconductor sensor technology. Because of the small size of the sensor, for this dosimetry, 9 sensors simultaneously or doing dosimetry for 9 times should be employed.
In the present study, a body CTDI phantom
(PMMA) was used for measuring CTDIw. To
simulate the CT section of the PET-CT Biograph 6 system, 16 X-ray sources were used in the Monte Carlo code for calculating dose.
The goal of this study is to introduce a new and inexpensive method to determine body
bowtie $ilter shape of PET/CT (Biograph 6 Siemens Company) using Thermolumenecence
Dosimeters (TLD). In the CT scan section of PET-CT machine, two types of bowtie $ilter are utilized; head bowtie $ilter and body bowtie $ilter. Te$lon, PMMA or aluminum are common materials used for manufacturing the bowtie $ilter which the aluminum was selected. This study is focused to determine the real shape of
body bowtie $ilter by applying dosimetry method.
MATERIALS AND METHODS
Calculation of the bowtie ilter shape using TLDs
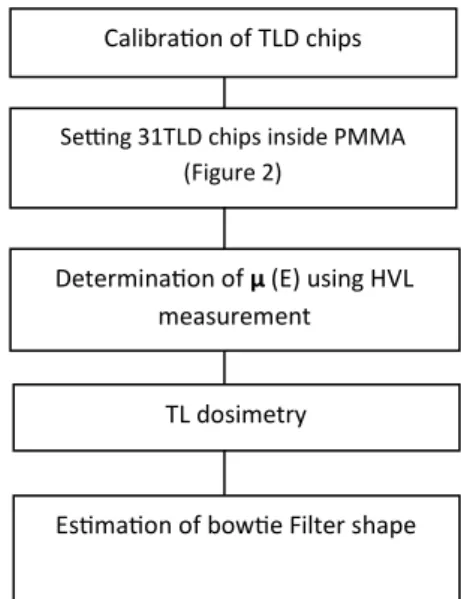
Figure 1 shows the $low diagram to estimate the bowtie $ilter shape for CT component of the Biograph 6 PET/CT using TLDs. Box 1 and 2 of
the diagram show that the TLDs chips are calibrated and set inside the PMMA.
384
Figure 1.The used flow diagram to es mate the bow e shapeof CT of Biograph 6 Siemens PET/CT. Calibra on of TLD chips
Se>ng 31TLD chips inside PMMA (Figure 2)
Determina on of µ (E) using HVL
measurement
TL dosimetry
Es ma on of bow e Filter shape
For calibration of TLD chips and setting, 31TLD chips (GR-200 series) made of LiF: Mg, Cu, and P were utilized. These chips have an extremely low detectable threshold and are near -air or tissue equivalent. The effective atomic number Z is 8.2, and it has a linear dose range 10-7 ~12 Gy.
All chips have circular shape with 4mm in
diameter and 0.9 mm in thickness (10). These
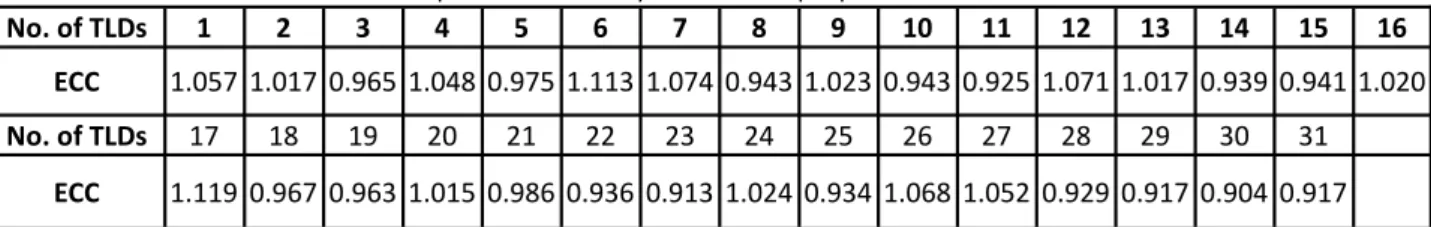
chips calibrated by Cs-137 in SSDL organization and ECC (Element Correction Coef$icient) of them have been reported in table1 using TLD reader Harshaw-4000. The outputs of TLD reader (nano-coulomb (NC)) were corrected by energy dependency response curve of LiF:Mg,
Cu, P dosimeters (11).
These TLD chips are placed in one slice of
PMMA with 3 ×40 cm2 dimensions and 4 mm
thickness. This device has 31 holes with 6mm diameter and 2mmdepth and 1 cm distance ($igure 2).
This device is placed in 20 cm distance from
the gantry isocenter to determine of body bowtie $ilter shape by TL dosimetry. The chip
No.16 was located in the center of the axial $ield of view (FOV). The chips are arranged by laser in the gantry and the pro$ile of CT machine is set to abdomen routine topogram by using kVp=110 and mA=100.
For determination of µ(E) using HVL
measurement, transition X-ray photons through
a bowtie $ilter were calculated using the standard attenuation equation 1:
I(E) =I0(E)exp {-µn(E)Yn} (1)
µn (E) is the liner attenuation coef$icient
which depends on the energy. The X-ray photons
from the CT scan have an energy spectrum I0 (E)
that could be listed by using the SRS-78 software
or as obtained from physical models or
measurements. Yn is thickness within the bowtie
$ilter in the direction of the X-ray photons. For
solving equation 1 and $inding Yn, µ (E) value
was determined by using the following equation 2.
µ= (2)
HVL value was calculated by experimental dosimetry via the ion chamber (Barracuda, RTI Electronics AB, 110 kVp)
The shape of the bowtie $ilter is thus estimat-ed by knowing these parameters and utilizing equations 1 and 2. Y indicates the thickness of the bowtie $ilter where the energy is equal to
110 kVp, and µ is equal to 0.460. Therefore, I0/I
can be calculated by using the maximum value of entry dose to TLD chips in the middle of the bowtie $ilter and normalizing per each value of dose in other chips. Thus, the absorbed dose in each chip can indicate the thickness of bowtie $ilter in direction of X-ray photons. Figure 3 shows the arrangement of TLD chips and bowtie $ilter in X-ray FOV in this study.
385
No. of TLDs 1 2 3 4 5 6 7 8 9 10 11 12 13 14 15 16
ECC 1.057 1.017 0.965 1.048 0.975 1.113 1.074 0.943 1.023 0.943 0.925 1.071 1.017 0.939 0.941 1.020
No. of TLDs 17 18 19 20 21 22 23 24 25 26 27 28 29 30 31
ECC 1.119 0.967 0.963 1.015 0.986 0.936 0.913 1.024 0.934 1.068 1.052 0.929 0.917 0.904 0.917 Table 1. Element Correc on Coefficient (ECC) resul ng from TLD calibrated in SSDL organiza on according to the specified
number of each TLD chip used in this study. Each TLD chips specified with a number from 1 to 31.
Isocenter
Figure 2. Arrangement of GR-200 TLD chips that are placed in a piece of PMMA with 3 ×40 cm2 dimension and 4 mm thickness with index number for each TLD chips.
AGenua on in Bow e filter
TLD chips
Figure 3. Schema c arrangement of TLD chips and the bow e filter in X-ray FOV. The thickness of bow e filter increases X-ray aGenua on at peripheral points.
In this study, the PET-CT Biograph 6 from Siemens was considered (12). This system has 6 CT slices with 16 detector rows and 1472 channels per slice. DURA 422 MV is a type of X-Ray tube with 20-345 mA current tube and 80, 110 and 130kV for supporting tube voltages. The focal spot size according to IEC 60 366 is 0.8×0.5/7° and 0.8×0.7/7°. The $iltration information such as bowtie $ilter shape, according to our researches, was not easily presented by the manufacturer.
Experimental measurements and simulation of CTDI (PET/CT Biograph 6)
One of the most important aims of this study is to de$ine the shape of bowtie $ilter that used in geometry section of Monte Carlo simulation program, which could be used for of CT section of PET-CT simulation. Figure 4 shows the $low diagram which is used to measure and simulate CTDI of CT section PET/CT biograph 6.
phantom surface. Each hole has 90º distance from its neighbor ($igure 5).
The ion chamber is placed serially in the
386
Experimental measurements:CTDIair, CTDI body Phantom
Simula on CTDIair
Conversion Factor (CF)
CTDI Body comparison: Experimental and Simula on
Figure 4. Experimental and simula on of CTDIair, CTDI body Phantom.
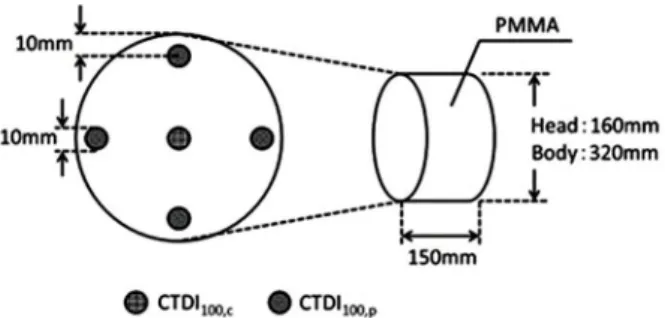
For experimental measurement CTDIair, ion chamber is located in center of FOV with pitch=1 and slice thickness=10 mm in mAs=100 for 80, 110, 130 KVp. Moreover, CTDIw value was measured using body CTDI phantom with 15 cm length and 32 cm diameter. It was made of PMMA with of 1.19 gr.cm-3density. There were holes that could use PMMA plug or pencil ion chamber. One hole was at the center and the other four holes were located 1 cm below the
Figure 5. CTDI value is measured using 32 cm diameter was made of polymethylmethacly late (PMMA) phantom.
center hole and the peripheral hole, and the measurements are combined to produce the
weighted CTDI. The DCT 10 air ionization chamber model with $lat energy response from
RTI (Barracuda, RTI Electronics AB) was utilized for measuring CTDIw.
To simulate CT section of PET/CT Biograph 6 system, 16 X-ray sources were used in Monte Carlo code (MCNP-4C) that are suf$icient sources
to approximate the continuous axial scan without signi$icantly affecting the calculated
dose. In the simulation code, absorbed dose was determined for CT scan with MeV/gram/source particle units and converted into absorbed dose with mGy/100 mAs units by conversion factor
(CF) (9) using equation 3.
(CF)E= (3)
The absorbed dose, in unit of mGy/100 mAs, was obtained by equation 4. ∑N is the deposited energy in MeV/gram/source particle for all
rotation during a PET/CT scan simulation (9):
Dabsolute = Dsimulated CF ∑N (4) In this method, we utilized 31 TLD chips that were located in one slice of PMMA in FOV and
determined µ (E) (material attenuation
coef$icient) by measurement of the HVL value using ion chamber (Barracuda, RTI Electronics
AB, 110KVp). According to the results of TLD
dosimetry, we determined the thickness of bowtie $ilter and body bowtie $ilter shape of
387
PET/CT model Biograph 6 Siemens Company. The CTDIw values, obtained from measurement and simulation using this bowtie $ilter have been compared to each other.
RESULTS
In table 2, the results of nano-coulomb (NC)
measurements from the TLD reader are presented in 2 rows. Also using data in table 1,
the dose (ECC*NC) are determined (table 2). The
thickness (Yn) (n=1, 2, 3 … 31 TLDs numbers) of
bowtie $ilter was calculated by using equations 1
and 2 and has been shown in the 4th row of
table 2.
The used data has been $itted by using equation 5, which indicates the shape of body
bowtie $ilter. Figure 6 indicate shape of bowtie $ilter by X and Y are horizontal distance (cm)
and the thickness of bowtie $ilter (mm Al), respectively)
Y =0.0192x2 - 0.6148x + 5.6564 (5)
Graphical shape of body bowtie $ilter of PET/CT Biograph 6 (present study) is presented in $igure 7a.
For simulation, the X-ray spectrum of sources that are used for CT section of PET/CT system for 80, 110 and 130 kVp is shown in $igure 8, which is obtained from SRS-78 software with anode angle 7.0º and beam opening is 56º.
TLDS No(n) 1 2 3 4 5 6 7 8 9 10 11 12 13 14 15 16
NC 213.2 210.8 237.8 280.5 287.1 382.5 428.5 476.2 583.6 717.7 938.8 1157.7 1349.6 1238.4 1311.3 1166.6
ECC*NC 225.3 214.7 230.0 294.1 280.0 425.8 449.0 449.4 597.5 677.0 868.5 1240.4 1373.1 1163.0 1233.5 1190.3
Thickness(Y) 4.177 4.283 4.133 3.599 3.705 2.794 2.679 2.677 2.058 1.786 1.245 0.470 0.249 0.61 0.482 0.55
TLDS No(n) 17 18 19 20 21 22 23 24 25 26 27 28 29 30 31
NC 1375.6 1182.2 1181.5 985.3 868.2 872.5 641.5 590.1 487.3 395.9 359.7 300.5 265.9 235.2 201.2
ECC*NC 1540.5 1143.3 1138.0 1000.2 856.4 816.8 585.6 604.5 455.2 422.8 378.4 279.0 243.8 212.6 184.4
Thickness(Y) 0.160 0.647 0.657 0.938 1.275 1.378 2.101 2.032 2.64 2.809 3.050 3.713 4.006 4.304 4.614 Table 2. Calculated results of NC (nano-coulomb), Element Correc on Coefficient (ECC), ECC*NC and thickness(Y) of bow e filter
for Biograph 6 PET/CT system.
Figure 6.The results of body bow e filters thicknesses of Siemens Biograph 6 PET/CT (present study) and Siemens Biograph 16 PET/CT in various areas of FOV.
(a) (b)
Figure 7. (a) The graphical Shape of body bow e filter of PET/CT Biograph 6 (present study). (b) Body bow e filter shape of Siemens Biograph 16 true point PET/CT that are es mated by using the Accu-Gold kit Radcal (Radcal Corpora on, Monrovia, CA) with AGMS-Dsensorex.
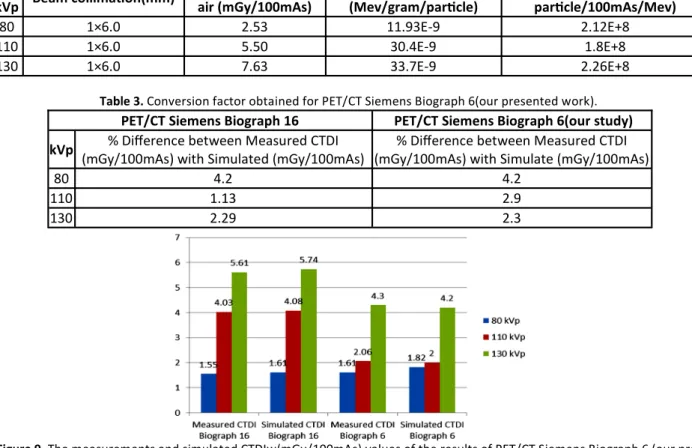
The conversion factors (CF) obtained by simulation code and summarized in Table 3 that
are obtained by simulation code where the simulation took into account 108particles with the 80, 110 and 130 energies related to PET/CT Siemens biograph 6.
The relative difference between
measurement (dm) and simulated (ds) CTDI was computed with equation 6 to obtain disparity
between the simulated and measured value:
∆rel (6)
Table 4 and $igure 9 show the results of the simulated and measured CTDIw values and relative difference for PET/CT Siemens Biograph 6(our study) and Biograph 16in 80, 110 and 130kVp.
388
Int. J. Radiat. Res., Vol. 15 No. 4, October 2017
Figure 8. The X-ray spectra of sources that used for simula on CT sec on of PET-CT Biograph 6 system in 80, 110 and 130 kVp obtained from SRS-78 so!ware.
kVp Beam collima0on(mm)
Measured CTDI100 in
air (mGy/100mAs)
Simulated CTDI100 in air
(Mev/gram/par0cle)
Conversion factor (mGy gram par0cle/100mAs/Mev)
80 1×6.0 2.53 11.93E-9 2.12E+8
110 1×6.0 5.50 30.4E-9 1.8E+8
130 1×6.0 7.63 33.7E-9 2.26E+8
Table 3. Conversion factor obtained for PET/CT Siemens Biograph 6(our presented work).
PET/CT Siemens Biograph 16 PET/CT Siemens Biograph 6(our study)
kVp % Difference between Measured CTDI (mGy/100mAs) with Simulated (mGy/100mAs)
% Difference between Measured CTDI (mGy/100mAs) with Simulate (mGy/100mAs)
80 4.2 4.2
110 1.13 2.9
130 2.29 2.3
Table 3. Conversion factor obtained for PET/CT Siemens Biograph 6(our presented work).
Figure 9. The measurements and simulated CTDIw(mGy/100mAs) values of the results of PET/CT Siemens Biograph 6 (our pre-sented work) and Biograph 16.
DISCUSSION
The shape of bowtie $ilters from Siemens
Company Biograph 16 true point (13) and
Biograph 6 our study ($igures 6, 7a and 7b) was compared and also results of measurements and
simulated CTDIw (mGy/100mAs) value and
relative difference ($igure 9), there is an excellent agreement in comparison of both body
bowtie $ilter Biograph 16 true point and Biograph 6 PET/CT from Siemens Company.
The data of simulation code (MCNP-4C) with
less than 5% error were generally reliable (14).
Thus, simulation of CT section of PET/CT Siemens Biograph 6 (our presented work) with
this shape of body bowtie $ilter ($igure 7a) were
validated with comparing difference values (∆rel)
between the measurements and simulated
CTDIw (mGy/100mAs) in energies available
($igure 9). Patient dose in CT systems is usually indicated in terms of organ dose and effective
dose. According to signi$icant correlation
between CTDIw and organ dose (ratio of organ
dose to CTDIw 1.37 (15)) and results of CTDI value
($igure 9), organs dose in PET/CT Biograph 6 were generally less than PET/CT biograph 16.
A dosimetry method to estimate body bowtie $ilter shape as applied to PET/CT scanner systems was presented and was compared with another frame work. The price range of each
TLD chip is $10-20 and accessible in most dosimetry divisions, compared with the range
price $ 3000-4000 of the Accu-Gold kit Radcal. The proposed method used TLD chips that are accessible and inexpensive whereas using the Accu-Gold kit Radcal system is signi$icantly more expensive in comparison. For similar bowtie $ilter shapes of two PET/CT systems
(this study vs. work by Belinato et al. (9)) at
kVp=110 and 100 mAs, the results show minimum errors between measurements and
simulated CTDIw(mGy/100mAs) values. In this
study, body bowtie $ilter shape for a speci$ic model of PET/CT system was determined and it could be utilized as input into the geometry section of relevant Monte Carlo simulation programs. Consequently, our study may help researchers determine, using very feasible means, the real value of CTDI with minimum
error between experimental measurements and Monte Carlo simulations, especially in dosimetry of internal organs.
Con licts of interest: Declared none.
REFERENCES
1. Bushberg JT, Seibert JA, Leidholdt EM, Boone JM, Gold-schmidt EJ (2003) The Essen al physics of medical
imag-ing. American Associa on of Physicists in Medicine; Med
Phys, 30(7): 1936.
2. Gu J, Bednarz B, Caracappa PF, Xu XG (2009) The develop-ment, valida on and applica on of a mul -detector CT (MDCT) scanner model for assessing organ doses to the pregnant pa ent and the fetus using Monte Carlo
simula-ons. Phys Med Biol, 54(9): 2699–717.
3. Park HH, Park DS, Kweon DC, Lee SB, Oh KB, Lee JD, et al.
(2011) Inter-comparison of 18F-FDG PET/CT standardized
uptake values in Korea. Appl Radiat Isot, 69(1): 241–6.
4. Toth TL, Cesmeli E, Ikhlef A, Horiuchi T (2005) Image quali-ty and dose op miza on using novel x-ray source filters
tailored to pa ent size. In: Flynn MJ, editor. 283.
5. Fan J, Pack JD, Cao GD (2016) Systems and methods for adjustable view frequency computed tomography imag-ing. U.S. Patent No. 20,160,038,113. 14/451616.
6. PaneGa D (2016) Advances in X-ray detectors for clinical
and preclinical Computed Tomography. Nucl Instruments
Methods Phys Res Sect A Accel Spectrometers, Detect As-soc Equip, 809: 2–12.
7. Angel E, Wellnitz C V, GoodsiG MM, Yaghmai N, DeMarco
JJ, Cagnon CH, et al. (2008) Radia on dose to the fetus for
pregnant pa ents undergoing mul detector CT imaging: Monte Carlo simula ons es ma ng fetal dose for a range
of gesta onal age and pa ent size. Radiology,249(1): 220
–7.
8. Jessen KA, Shrimpton PC, Geleijns J, Panzer W, Tosi G (1999) Dosimetry for op misa on of pa ent protec on in
computed tomography. Appl Radiat Isot, 50(1): 165–72.
9. Belinato W, Santos WS, Paschoal CMM, Souza DN. (2005) Monte Carlo simula ons in mul -detector CT (MDCT) for two PET/CT scanner models using MASH and FASH adult
phantoms. Nucl Instruments Methods Phys Res Sect A
Accel Spectrometers, Detect Assoc Equip,784: 524–30.
10. GR-200 TLD. Available from:
hGp://www.csimc-freqcontrol.com/products4.html
11. Carinou E, Boziari A, Askounis P, Mikulis A, Kamenopoulou V (2008) Energy dependence of {TLD} 100 and MCP-N
detectors. Radiat Meas, 43(2–6): 599–602.
12. Jakoby BW, Bercier Y, Con M, Casey ME, Bendriem B, Townsend DW (2011) Physical and clinical performance of
the mCT me-of-flight PET/CT scanner. Phys Med Biol, 56
(8): 2375–89.
13. Belinato W, Santos WS, Paschoal CMM, Souza DN (2013)
389
Monte Carlo simula ons in mul -detector CT (MDCT) for two PET/CT scanner models using MASH and FASH adult phantoms. Nucl Instruments Methods Phys Res Sect A
Accel Spectrometers, Detect Assoc Equip,784: 524–30.
14. Briesmeister JF (2000) MCNP4C: Monte Carlo N-par cle transport code system. MCNP-4C Monte Carlo N-Par cle
Transp Code Syst.
15. Hidajat N, Mäurer J, Schröder RJ, Nunnemann A, Wolf M,
Pauli K, et al. (1999) Rela onships between physical dose
quan es and pa ent dose in CT. BrJ Radiol, 72(858): 556
–61.