Program Plan for Establishment of a Community Health Clinic
in the Clark-Fulton Neighborhood
By
Rachael Ng
A Master’s Paper submitted to the faculty of
the University of North Carolina at Chapel Hill
in partial fulfillment of the requirements for
the degree of Master of Public Health in
the Public Health Leadership Program
Chapel Hill
Spring 2014
[Signature goes here]
Date [Signature goes here]
ii © 2014 Rachael Ng
iii Abstract
Rachael Ng: Program Plan for Establishment of a Community Health Clinic in the Clark-Fulton Neighborhood
(Under the direction of Cheryll Lesneski, DrPH)
With the enactment of the Medicaid expansion in the Affordable Care Act (ACA), many
individuals in the state of Ohio will remain uninsured due to not being able to afford the
option, being an undocumented immigrant, or simply choosing not to purchase it (Kliff,
2013). In Cuyahoga County, the uninsured rate is approximately twelve percent (City of
Cleveland, 2014), with Hispanics making up approximately seventeen percent of this
population (Community, 2014). The west side of Cleveland has one of the largest
concentrations of the Hispanic population in Cleveland, as the Hispanic population
makes up forty-seven percent of the neighborhood (City of Cleveland, 2014). This area,
known as the Clark-Fulton neighborhood, has thirty-eight percent of its population living
in poverty (City of Cleveland, 2014). Scranton Road Ministries Community
Development Corporation (CDC), a faith-based nonprofit organization, has recognized
the needs of this community, already supplying a legal clinic, after-school programs,
and job assistance programs. The organization has held one day health fairs (2004,
2008, 2011, 2012, and 2013) throughout the years, and due to the overwhelming
response and needs of the community, a permanent health clinic has been proposed as
it aligns with the organization’s desire to focus on long-term health impact and
outcomes in the community. As a result, this program plan will be used for an
establishment of a community health center program aimed at improving the needs of
iv
Table of Contents
Abstract ... iii
Purpose ... 1
Background ... 1
The current state of health centers ... 2
Health Needs Assessment ... 4
Primary Data ... 4
Secondary data ... 6
Analysis of the data ... 18
Contextual Issues Affecting the Program Plan for a Community Health Center ... 19
Political Environment ... 20
Consistency with National, State, & Local Priorities ... 20
Acceptability to Providers, Recipients, and Stakeholders ... 21
Financial Resources ... 22
Technical and Administrative Feasibility ... 23
Temporal Issues ... 24
Geography ... 24
Literature Review ... 25
Community Health Center Requirements That Inform Program Planning Activities and Strategies ... 25
Evidence Supporting the Benefits of Community Health Centers ... 28
Strategies for the Integration of Health Care and Public Health Services and Methods ... 31
Community Health Centers and the Social Determinants of Health ... 35
Program Planning Methodology ... 38
Change Theories/Models for Community and Organizations ... 39
Major Findings from Literature ... 43
v
Overview of the Program Plan for a Community Health Center ... 45
History ... 46
Context of the Program Plan ... 48
Relevant Program Theories ... 49
Goals and Objectives ... 51
Logic Model ... 54
Program Implementation... 55
Evaluation and monitoring ... 61
Conclusion ... 61
References ... 62
Appendix A. Timeline of Strategies ... 68
1 Purpose
The purpose of this paper is to develop a program plan for the establishment of a
community health clinic aimed at improving health needs identified in the assessment of
the Clark-Fulton neighborhood.
Background
A recent health needs assessment of the Clark-Fulton neighborhood in Cleveland,
Ohio, identified hypertension and obesity to be prevalent in the neighborhood. The
convenience sample conducted in 2013 resulted in 191 surveys with thirty-two percent
of the participants experiencing hypertension, and approximately forty-two percent were
obese. Hypertension and obesity are risk factors that may contribute to heart disease,
which is currently the leading cause of death in both men and women in the United
States (CDC, 2014). These health needs can be addressed with medications; however,
research has shown that primary care alone has a small impact on shaping physical
health, affecting the overall physical health of an individual by only ten to twenty-five
percent (IAF, 2012). In a report conducted by John Hopkins University, nearly thirty-one
percent of African-Americans and Hispanics had hypertension attributable to social and
environmental responses regardless of racial differences (Thorpe, 2008). Further
research has shown that socio-economic factors, physical environment, and health
behaviors have a large role in influencing the physical health of an individual as well
(IAF, 2012). These social and economic conditions may have a bigger impact on life
expectancy and health status than medical care itself (IAF, 2012). Interventions to
address and improve the conditions in which people live, learn, work, and play can
2
A review of secondary data in the health needs assessment revealed the
Clark-Fulton neighborhood to have the maximum score of socio-economic barriers, with a
Community Needs Index (CNI) of five (Community, 2014). The CNI quantifies
socioeconomic barriers of income, education, insurance, housing, and culture/language
from public health data and literature with an overall score of one representing the
lowest community need and five the highest community need. Additionally, the needs
assessment found that only thirty-seven percent of the neighborhood has a high school
education, thirty-eight percent currently live in poverty, and approximately twelve
percent of the county remain uninsured (City of Cleveland, 2014).
The current state of health centers
The first community health center— “community health center” includes both
federally funded and free health clinics for purposes of this paper—was established in
the 1960s (NACHC, 2013). Community health centers have increased since then
(NACHC, 2013). Community health centers today serve over 9,000 locations, providing
patients with increased access to primary and preventive care, cost-effective therapies,
high quality of care, management of chronic illnesses, improved birth outcomes, and the
creation of jobs while reducing health disparities and stimulating economic growth
(NACHC, 2013).
As one of the four overarching goals of the decade, HealthyPeople 2020 addresses
providing social and physical environments that promote good health for all
(HealthyPeople, 2013). This includes recognizing the economic stability, education,
social and community factors, health and healthcare needs, and the neighborhood
3
lead the effort to address social and physical environments as well as medical care of a
community, focusing more on population health (IAF, 2012).
In 2012 alone, more than twenty-one million individuals utilized community health
centers resulting in improved health outcomes (BPHC, 2014). The Bureau of Primary
Health Care noted that in 2012, seventy percent of patients who utilized a community
health center demonstrated improved control over their diabetes with a hemoglobin A1c
level less than or equal to nine, sixty-four percent of patients with hypertension were
able to maintain blood pressure under normal levels of ≤120/80, the percentage of low
birth weight babies was approximately seven percent lower than the national
percentage of eight percent, and the rate of entry into prenatal care increased to
seventy percent from sixty-five percent in 2008 (BPHC, 2014). In Ohio, in 2012,
community health centers lowered infant mortality rates by at least ten percent
(NACHC, 2013), and effective patient management through the use of community
health centers resulted in reduction of diabetes complications, kidney failure, and
certain forms of heart disease (NACHC, 2011).
The Medicaid expansion of the Affordable Care Act is a promising solution to improve
health outcomes of the underserved by expanding to include almost all U.S. citizens
under the age of sixty-five with incomes up to 133% of the federal poverty level (APHA,
2013). Ohio has been one of the states that have opted into this expansion; however, a
number of individuals will remain uninsured. These individuals include those who cannot
find insurance options for less than eight percent of their modified adjusted gross
income and thus are part of the affordability exemption, undocumented immigrants, or
4
as trust, cultural, or linguistic barriers in the system (Adashi, 2010; Kliff, 2013). For
these individuals, community health centers may be a valuable option as a source of
medical care (Adashi, 2010).
This paper will provide an overview of the needs assessment of the Clark-Fulton
neighborhood, the context of the program plan, literature review, and relevant theories
to be used in the program plan for the community health center. The program plan will
then provide the goals and objectives, logic model, as well as implementation strategies
intended for establishment of a community health center in the Clark-Fulton
neighborhood, under the Scranton Road Ministries Community Development
Corporation (CDC).
Health Needs Assessment
In 2013, a health needs assessment was conducted for the Clark-Fulton
neighborhood, an underserved neighborhood with a medically underserved area (MUA)
score of 52.7 (HRSA, 1995). For the assessment, a convenience sample was used, as
it was less time consuming. Disadvantages of using a convenience sample included
the following: the results were not generalizable, the reliability or precision of the data
could not be estimated, and the sample was more susceptible to selection bias. In
order to assess and understand the factors that may be influencing the community’s
health, as well as mortality and morbidity rates, secondary data were gathered including
data from Cleveland, Cuyahoga County, and Ohio.
Primary Data
A total of 191 surveys were collected at the 2013 Scranton Road Ministries CDC
5
2012. The attendees were predominantly residents of the Clark-Fulton neighborhood.
However, the demographics at the fair were skewed disproportionately towards youth,
with children making up over half of the participants. Male adults were also
underrepresented making up only twelve percent of the convenience sample. In
addition, the Hispanic representation was also lower than the neighborhood average, as
only about a quarter of the health fair attendees were Hispanic although they make up
nearly half of the Clark-Fulton neighborhood. Obesity, calculated by body mass index
(BMI), was prevalent in many of the adults and children at the health fair. A majority of
the adult survey respondents with BMI data were found to be obese, while less than a
quarter were normal or underweight. Approximately thirty-four percent of the BMI
measurements for children were within an overweight or obese category as measured
by Centers of Disease Control (CDC) gender and age specific BMI charts. Hypertension
was also prevalent with approximately a third of the adult attendees found with blood
pressures above normal levels of 120/80. Dental issues were also found to be prevalent
with only one child out of 72 total adults and children screened not recommended for
follow up care. Finally, some participants refused participation in the screenings or the
healthcare personnel failed to write down medical evaluations of participants, and were
6
Figure 1: Primary data participants by Body Mass Index (BMI).
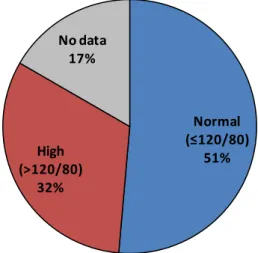
Figure 2: Primary data participants with Hypertension.
Secondary data
In order to comprehend and assess factors that may be influencing the health of the
Clark-Fulton neighborhood, secondary data sources were consulted Secondary data
were collected also for Cleveland, Cuyahoga County, and Ohio—the city, county, and
state, respectively, in which the Clark-Fulton neighborhood is located —when specific
Clark-Fulton neighborhood data were not available.
Underweight, 6.7%
Normal, 35.3%
Overweight, 14.3% Obese, 20.2%
No data, 23.5% Underweight,
4.2%
Normal, 13.9%
Overweight, 11.1%
Obese, 41.7% No data,
29.2%
Adult Children
Normal (≤120/80)
51% High
(>120/80) 32%
7 Total Population
According to the City of Cleveland 2014 Neighborhood Fact sheet briefs, a total of
8,548 people live in the Clark-Fulton area. The neighborhood makes up 2.2% of the
population of the city of Cleveland, and 0.67% of Cuyahoga County (City of Cleveland,
2014).
Table 1: Total 2014 Population of Clark-Fulton, Cleveland, and Cuyahoga County.
Population (2014) Clark-Fulton neighborhood 8,548 City of Cleveland 396,815 Cuyahoga County 1,278,024
The total population has decreased over the past decade, first starting out at 21,701
persons in 1940, 13,363 persons in 2000, and then 11,126 persons in 2010. The
population decrease is reflective of the population in the city of Cleveland since the
1940s (City of Cleveland, 2014).
Figure 3: Population decrease from 1940s to 2014 in the Clark-Fulton and Cleveland.
Age
In terms of age, the Clark-Fulton area has approximately 8% of the population over
the age of 65, 61% of the population between the ages of 18 to 64, and 31% of the
8 Community Need Index
The Cuyahoga County Community Need Index mean score was 3.3. However, the
areas that make up the Clark-Fulton neighborhood had the highest score out of all of
Cuyahoga County, with Clark-Fulton (44102) having a score of 5, and the surrounding
areas of Tremont/Old Brooklyn (44109) and Cleveland-downtown (44113) not much
better (Community, 2012).
Table 2: Community Needs Index of Clark-Fulton and its bordering neighborhoods.
Zip code Neighborhood Community Needs Index
44102 Clark-Fulton 5.0
44109 Tremont/Old Brooklyn 4.8 44113 Cleveland-downtown 5.0
Race/Ethnicity
The Clark-Fulton neighborhood is diverse, but the majority of the population is
Hispanic. In 2014, 47% of the entire Clark-Fulton neighborhood was Hispanic (City of
Cleveland, 2014).
Table 3: Hispanic population in the Clark-Fulton neighborhood in 2014.
Persons Percent
Hispanic 4,032 47%
Non-Hispanic 4,516 53%
The Hispanic population, as well as the African American population, has become a
greater percentage of the Clark-Fulton neighborhood over the past decade. In the 2010
Census Bureau report , the relative Hispanic population has been notably growing,
consisting of 39% of the population in Clark-Fulton in 2000, and 44% in 2010 (Case,
9
Figure 4: Hispanic population in the Clark-Fulton neighborhood and Cleveland, in year 2000 and 2010.
Education
In terms of education, very few individuals in the Clark-Fulton neighborhood have
achieved an educational degree beyond high school. Only 37% of individuals have
achieved a high school degree, and 3% of the population has a bachelor’s degree
(Clark, 2014). This is considerably lower than the national average of almost 90% with
a high school degree (NCES, 2014).
Table 4: Education level of the Clark-Fulton neighborhood in 2000 and 2014.
2000 2014
Age 25+ with high school diploma 48.7% 37.0% Age 25+ with college degree 5.8% 3.0%
Income
The past decade (2000-2014) has shown the Clark-Fulton neighborhood to have a
median household income of about $24,485 (City of Cleveland, 2014). The majority of
the Clark-Fulton population has an income level of less than $29,000. 5,329 6,362 1,191 78 403 Hispanic Non-Hispanic White Non-Hispanic Black Non-Hispanic Asian/Pacific Islander Non-Hispanic Other 4,895 3,901 1,981 59 290 39,533 132,706 208,227 7,283 9,081 34,728 185,641 241,512 6,407 10,115 5,329 6,362 1,191 78403
Clark-Fulton 2010 Clark-Fulton 2000
10
Figure 5: Income of Clark-Fulton by number of households.
Poverty
HealthyPeople2020 states that individuals with certain socioeconomic conditions in
their social environment contribute to worse health outcomes (HealthyPeople, 2013).
According to the city of Cleveland neighborhood data briefs, the poverty level (based on
income, size of family, ages, and poverty threshold) has increased in the Clark-Fulton
neighborhood by approximately ten percent, from 28% to 38%, in the years of 2000 to
2014 (City of Cleveland, 2014).
Health Insurance
HealthyPeople2020 has noted lacking routine medical care may affect health
profoundly (HealthyPeople, 2013). No data were available on the number insured in the
Clark-Fulton neighborhood, but in Cuyahoga County approximately 12% of individuals
are uninsured (Community, 2014). This rate is lower than the national rate of 15%.
Table5: Uninsured population in Cuyahoga County, Ohio, and the United States in 2008-2012.
Population reported for insurance
Total Uninsured Population
Percent Uninsured Population
Cuyahoga County 1,262,199 147,911 11.72%
11
United States 303,984,256 45,206,152 14.87%
Additionally, according to data collected in the Community Health Needs Assessment
(2014) by Community Commons, the Hispanic population had the highest uninsured
rates in Cuyahoga County and the United States, 17% and 30%, respectively when
compared to Non-Hispanic whites and Non-Hispanic blacks (Community, 2014).
Table 6: Uninsured of Hispanic origin in Cuyahoga County in 2008-2012.
Hispanic Not Hispanic Percent Hispanic
Cuyahoga County 10,315 69,918 16.95%
Ohio 83,038 962,627 1.42%
United States 15,017,022 20,139,664 30.14%
Health Care Providers
A designated health provider shortage area (HPSA) is an area with unusually high
need for primary care services or contains an insufficient number of existing primary
care providers for the population (HRSA, 2013). In a HPSA, the population to primary
care physician ratio is greater than 3000 to 1 (HRSA, 2013). The Clark-Fulton
community, a neighborhood of west Cleveland, is in a HPSA with a population to
primary care physician ratio of 3453 to 1 (HRSA, 2013). Additionally, the population to
primary care physician ratio is almost four times greater in west Cleveland compared to
Cuyahoga County, and three times greater than the state of Ohio (ODH, 2008; County,
2014). Health care provider availability is limited as well with approximately 110
physicians per 100,000 persons in Cuyahoga County (HRSA, 2013).
Table 7: Population to primary care physician ratio.
PCP ratio West-Cleveland
12
Cuyahoga County 906:1
Ohio 1332:1
Table 8: Health provider availability for Cuyahoga County.
# per 100,000 in Cuyahoga County Primary care physicians 110.4 General/family practice 25.4
Pediatricians 99.4
Internal medicine 60.1
OB/GYN 33.6
General surgeons 18.7
Psychiatrists 16.1
Dentists 78.4
Fertility/Births
Fertility rates, teenage mothers, and mothers without a high school education were
higher in the Fulton neighborhood than the city and county rates. In 2009,
Clark-Fulton had a 77.6 per 1,000 person fertility rate, 89 per 1,000 persons were teenage
mothers, and 45 per 1,000 persons were mothers who did not have a high school
education (Case, 2010). These rates were higher than was those seen in the city of
Cleveland, as well as in Cuyahoga County.
Table 9: Comparison of 2005 and 2009 fertility rates of Clark-Fulton, Cleveland, and Cuyahoga County.
Clark-Fulton Cleveland Cuyahoga 2005 2009 2005 2009 2005 2009 Fertility rate for females ages 15-44
(per 1,000 persons) 80.9 77.6 65.0 70.2 59.7 61.1 Births to females ages 15-19
(per 1,000 persons) 79.7 89.0 70.9 73.6 41.1 40.7 Percent of births to unmarried mothers 8.7 11.5 12.7 13.3 10.0 10.5 Percent of births without prenatal care 1.4 2.1 2.0 2.0 1.2 1.3 Percent of births with low birth weight 8.7 11.5 12.7 13.3 10.0 10.5 Percent of births to mothers without a
13 Infant/neonatal/post neonatal mortality
Infant (less than one year old) mortality was not available specifically for the
Clark-Fulton neighborhood, but only for Cuyahoga County. In a 2010 update from the
Cuyahoga County Board of Health, results from a community health indicators project of
child and health services were released (CHSI, 2009). The mortality rates were much
higher than the Healthy People 2020 goals for infant/neonatal/post neonatal mortality.
Table 10: Comparison of infant/neonatal/post neonatal mortality in Cuyahoga County to Healthy People 2020 Goals.
Cuyahoga County (per 1,000 persons)
Healthy People Goal (per 1,000 persons)
Infant mortality 9.5 6.0
Neonatal mortality 6.4 4.1
Post neonatal mortality 2.5 2.0
Leading Causes of Death
The Ohio Department of Health receives all death certificates occurring in the state
of Ohio (ODH, 2010). Public health indicators are derived from this data. Age-adjusted
mortality rates per 100,000 people were calculated for the six leading causes of death
presented in Cuyahoga County, Ohio, and the United States (ODH, 2010). The
mortality data showed that heart disease was the leading cause of death in Cuyahoga
County in 2006 and 2010 with a rate of 203.9 deaths per 100,000 people in 2010
(ODH, 2010). Cancer was the second highest leading cause of death, followed by
chronic lower respiratory disease, stroke, unintentional injury, Alzheimer’s disease,
diabetes mellitus, and influenza and pneumonia (ODH, 2010). The mortality data in
Cuyahoga County were comparable to the state of Ohio and the United States, except
for a higher mortality presented in heart disease in Cuyahoga County (ODH, 2010; ODH
14
Figure 6: Diabetes, hypertension, and obesity prevalence against age in Cleveland.
Morbidities- Diabetes, Hypertension, Obesity
Behavioral risk factor surveillance system surveys assessed individuals in seven
neighborhoods, with each neighborhood having at least 100 persons per year measured
(Case, 2010). This survey was a collection of telephone surveys throughout Cleveland
in the years of 2005-2009of individuals ages 18 years and older who have been
identified by a physician for having diabetes, hypertension, or obesity (Case, 2010).
Results of these surveys showed diabetes prevalence increased over age, and not that
of gender or race. The 95% confidence intervals did not overlap among these ages,
showing 95% confidence that Cleveland individuals ages 30-49 had a lower prevalence
of diabetes than those 50 and above (Case, 2010).
Table 11: Diabetes prevalence in Cleveland (including Clark-Fulton) for 2005-2009.
Age (years) %
30-49 8.1 50-64 19.5
15
Hypertension was also reported in these telephone surveys. Like diabetes,
hypertension prevalence increased over age. The 95% confidence intervals did not
overlap among these ages, so there was 95% confidence that Cleveland individuals
ages 18-29 and 30-49 had a much lower prevalence of hypertension than those greater
than 50. Those of African American descent in Cleveland reported hypertension more
than those who were Caucasian, 41% and 33%, respectively (Case, 2010).
Table 12: Hypertension prevalence in Cleveland (including Clark-Fulton)for 2005-2009.
Age (years) %
18-29 11.6 30-49 26.1 50-64 51.8
65+ 67.4
Obesity was more prevalent for the middle age group. The lowest prevalence of obesity
were still in the youngest age group, ages 18-29 (28%), and the highest in ages 30-49
(41%). The age groups of 50-64 and greater than 65 were comparable, 38% and 32%,
respectively, but still higher than the 18-29 age group. Additionally, African Americans
were shown to be the most obese (42%), and women in Cleveland proved to show
16
Figure 7: Diabetes, hypertension, and obesity prevalence against age in Cleveland.
Excess weight can place individuals at higher risk for further health morbidities
(Community, 2014). The following below is the percentage of the population in
Cuyahoga County that is overweight or obese. Cuyahoga County is comparable to the
state of Ohio and the United States in both categories.
Table 13: Population Obese and Overweight in Cuyahoga County.
Total population >20 years old
Population overweight
Population obese
Percent overweight(BMI
25-30)
Percent obese (BMI > 30)
Cuyahoga County 993,090 367,122 259,216 36.97% 26.80%
Ohio 8,781,360 3,126,270 2,553,461 35.60% 29.75%
United States 235,375,690 85,495,735 62,144,711 36.32% 27.29%
Risk Factor Behaviors
Modifiable risk factor behaviors for heart disease that can be managed with
medications or lifestyle changes include diabetes, cholesterol, obesity, smoking,
physical inactivity, and low fruit and vegetable consumption (ODH, 2008). The
behaviors reported in Cuyahoga County were comparable to the state of Ohio. Almost
a quarter of the population in Cuyahoga County reported participating in cigarette
17
Table 14: Prevalence of health risk factors in Cuyahoga County.
Cuyahoga County Ohio
Heavy drinking 5.1% 5.3%
Cigarette smoking 20.2% 23.4% Lack of physical activity 22.9% 24.4% <5 fruits/veg. per day 76.4% 78.3%
Transportation
Public transportation can provide access to healthy food, recreation, and healthcare.
Public transportation was measured by the population’s main method of commuting—
through public buses, trolley buses, subway, rails, or ferryboats (Community, 2014).
Table 15: Employed population and public transportation as means of main transportation.
Employed, (16+)
Population using public transportation to work
Percentage who use public transportation to work
Cuyahoga County 567,874 30,486 5.37%
Ohio 5,196,293 88,620 1.71%
United States 139,893,632 6,967,689 4.98%
Safety
Public safety of the environment and the place where people live can have an impact
on the sense of security and the health outcomes of a population (Case, 2010). Using
the NEO-CANDO data, crime was one of the indicators reported, taking the forms of
violent crimes, property crimes, drug arrests, and child maltreatment.
Table 16: Crimes reported in Cuyahoga County in 1998 and 2008.
Clark-Fulton Cleveland Cuyahoga County 1998 2008 1998 2008 1998 2008
Violent crimes* 1,059.3 1,494.8 1,379.6 1,604.0 NA** NA Property crimes* 5,431.6 6,143.4 5,855.1 6,129.8 NA NA Drug Arrests* 1,172.0 1,296.1 1,908.6 1,292.0 NA NA Child (<18) maltreatment
per 1,000 persons 43.4 19.9 44.4 18.3 26.3 9.6
18 Analysis of the data
From the secondary data, the Clark-Fulton neighborhood has a small elderly
population, with the neighborhood primarily being of ages 64 and below. The
neighborhood was identified as a health provider shortage area as well as having the
highest community need index score possible, higher than the mean score of Cuyahoga
County. A low high school education rate was indicated overall, notably in teenage
mothers. The neighborhood household income is less than $30,000 with a relatively
increasing poverty rate. Fertility and birth rates were higher in comparison to the city
and county, with a large number of births occurring to teenage mothers, and those
without a high school education. Infant and neonatal mortality were also reported to be
high compared to HealthyPeople 2020 goals. The leading cause of death in the county
was reported to be heart disease. Heart disease risk factors of diabetes, hypertension,
and obesity as well as risk behaviors affect a large percentage of the city, with
hypertension and obesity prevalent in the health fair data. The neighborhood is
primarily populated with the Hispanic ethnicity, an ethnicity that is largely uninsured in
Cuyahoga County compared to the overall state of Ohio. The crime rate is rather high
for Clark-Fulton and the city of Cleveland compared to the rest of the county, which may
impact the well-being of the community.
Methods used in the assessment
Health fair data were collected at the 2013 Scranton Road Ministries CDC Annual
Health Fair through open-ended interview survey questions and medical evaluations.
Center for Disease Control and Prevention guidelines were used as standard guidelines
19
both at risk (prehypertension) levels and high risk levels. Obesity was measured by
calculating the body mass index (BMI) of each individual per Center for Disease Control
and Prevention standards.
For secondary data, population demographics were retrieved from the City of
Cleveland Neighborhood 2000, 2010, and 2014 Fact Sheets. These briefs contained
data from the U.S. Census of Bureau specific to the Clark-Fulton neighborhood,
Cleveland, and Cuyahoga County. Social and economic indicators were gathered from
the City of Cleveland Neighborhood Fact Sheets and the Community Health Needs
Assessment (CHNA) database. The Community Needs Index (CNI), powered by
Dignity Health and Truven Health, identified the severity of health disparities for
Clark-Fulton, demonstrating community need, access to healthcare, and actions toward
prevention. Morbidity and mortality data were gathered from the Ohio Department of
Health and the Northeast Ohio Community and Neighborhood Data for Organizing, a
data source of compiled data from the U.S. 2010 Census and the American Community
Survey. Fertility, births, and infant mortality was collected from the Child and Family
Health Services (CFHS) Community Health Indicators Project, a database of twenty two
maternal and child indicators across Cuyahoga County during the years of 1995-2007.
Contextual Issues Affecting the Program Plan for a Community Health Center
The overall context of a program plan can both support and challenge the
implementation of the program (Issel, 2008).The contextual issues for a community
health center that are to be considered include the political environment, consistency
20
providers, financial resources, technical and administrative feasibility, time, and
geography.
Political Environment
The political environment of the program is to be considered to determine the
amount of community support or opposition to the program plan of a community health
center (Calleson, 2012). The federal government, state of Ohio, and Cuyahoga County
has shown political support for the medically underserved. The federal government has
proven to be in support of community health centers with the enactment of the
Community Health Center Fund, as part of the Affordable Care Act (BPHC, 2014). This
fund provides eleven billion dollars over the course of five years to community health
centers, used to support the operations of ongoing community health centers, creation
of community health centers, and expansion of preventative and primary health care
services (BPHC, 2014). In Ohio, the state supports forty-one community health centers
throughout the state (OACHC, 2012). Locally, city officials have supported the Health
Improvement Partnership-Cuyahoga, a community driven group concentrated on
collecting health and social assessments of Cuyahoga County, in order to identify needs
and priorities, providing a comprehensive approach to health improvement strategies for
the underserved in the area (CCBH, 2014).
Consistency with National, State, & Local Priorities
Priorities on the national, state, and local level are to be congruent with the program
plan to receive public credibility and backing (Calleson, 2012). National priorities
decided by HealthyPeople 2020 and the National Association of Community Health
21
to provide for essential public health services (HealthyPeople, 2013) and address the
widespread lack of access to basic health care (NACHC, n.d.). In Ohio, the state’s
priorities of establishing, supporting, and promoting policies and systems to reduce
barriers that prevent appropriate health care were summarized in the 2012 State Health
Improvement Plan (ODH, 2012). In this plan, the state announced priorities of
disseminating health information to minorities, engaging with legislators to increase
advocacy for health clinic funding, as well as increasing the number of community
health center primary care residency programs to increase the number, diversity, and
cultural competency of the healthcare workforce (ODH, 2012). Locally, the Cleveland
Department of Public Health launched the Healthy Cleveland Initiative aimed at the root
causes of health disparities between the urban and suburban communities. This
initiative, with the partnership of four major hospitals in Cleveland, has expanded
smoking bans, created safe bicyclist roads, and ensured schools have adequate
facilities and budget for healthy meals (CDPH, 2013).
Acceptability to Providers, Recipients, and Stakeholders
The program plan is to be acceptable to the providers, recipients, and stakeholders
in the community (Calleson, 2012). The target audience of the community health center
is the Clark-Fulton neighborhood, which is approximately fifty percent Hispanic by
ethnicity (City of Cleveland, 2014). Socioeconomically, thirty-seven percent of the
neighborhood has a high school education and a majority of the neighborhood makes
less than a $30K household income (City of Cleveland, 2014). Biologically, nearly sixty
percent of the neighborhood are between the ages of 18 to 64 years (City of Cleveland,
22
50 and above in the city of Cleveland (Case, 2010). Infant mortality has also been seen
to be high in the county (CHSI, 2009). Recognizing the diversity of this target audience
will help define the acceptability of the health clinic to the community (Calleson, 2012).
The diversity of the program planning team includes the strengths of medical, social
work, legal, finance, and community neighborhood development expertise. The team
also represents diverse cultural, ethnic, and socioeconomic backgrounds to parallel the
diversity in the neighborhood and assist with the program planning. Stakeholder
support will be gathered from community meetings, interviews, or surveys for a
collection of individuals both inside the organization and outside the organization to
guide the program planning process (Calleson, 2012), in conjunction with Scranton
Road Ministries CDC as well as current existing collaborators of Scranton Road Bible
Church and the Christian Medical and Dental Association. Additionally, community
needs assessments are currently in progress in the Clark-Fulton community through the
Community Wrap-Around Initiative, led by the United Way of Greater Cleveland (United,
2014).
Financial Resources
Financial resources are to be considered in the program planning process (Calleson,
2012). The community health center program will be under the financial resources of
Scranton Road Ministries CDC, a non-profit 501(c)3 organization. Scranton Road
Ministries CDC is primarily funded through donations from individual benefactors,
foundations, and corporate sponsors.
The staff and workforce of the program will be entirely managed by volunteers
23
so, the ongoing cost for a weekly free clinic can range from $1,000 to $5,000 a year,
depending on patient volumes, amount of laboratory tests, and the extent of prescription
medications purchased on behalf of patients (Volunteers, 2012). Supplemental grant
funding from the following non-profit organizations will be pursued: The Cleveland
Foundation, The Cleveland Colectivo, United Way of Greater Cleveland, The Health
Path Foundation of Ohio, and the Deaconness Foundation (Cleveland Foundation,
2014; Cleveland Colectivo, 2014; United, 2014; The Health Path, 2014 & Deaconness,
2014).
Technical and Administrative Feasibility
The technical feasibility of a program determines if the technology required by the
program plan can be delivered to those who need it to influence the health problem
(Calleson, 2012). The resources required for the program planning team is achievable.
For supply issues, equipment supplies will be donated by local hospitals. For
medications, medical supply banks will supply near-date expired medications, samples
from pharmaceutical companies, and discounted medications at local pharmacies.
Adequately trained staff for operation of the health center will be available, through
volunteers recruited from Scranton Road Bible Church, local hospitals, and the
Cleveland Christian Medical and Dental Association. At least four physicians will be
recruited, one to two nurses, and fifteen non-medical volunteers for the operations of a
free clinic (Volunteer, 2012).
Scranton Road Ministries CDC’s framework is well established for the administrative
feasibility of the program. The organization already provides successful after school
24
neighborhood. The organization also has a history of collaborative partnerships with
local hospitals and nonprofit organizations.
Temporal Issues
Time can influence the effectiveness of a program plan and is important to consider
in the development of a program plan (Calleson, 2012). The time to successful
implementation of a community health center can be measured on attainment of a
desired volume of patients or making an impact on one patient (Volunteer, 2012). Most
community health centers surpass their anticipated patient volumes within six to eight
weeks (Volunteer, 2012). A total of eight months is estimated for the full operations of
the community health center.
Geography
The geography for the program is to be representative of the target audience and
permit manageable coordination of delivery of services (Calleson, 2012). Scranton
Road Bible Church, in the Clark-Fulton neighborhood, will be the location for the health
center. The church has ample room for health services along with access to restrooms,
private exam areas, and locked storage. The church shares the same mission and
values of the health center, with a focus on the physical, economic, and spiritual
restoration of the neighborhood.
Additionally, the church is easily accessible via public transportation for the
Clark-Fulton neighborhood. The church is well known in the neighborhood, tailoring many of
their outreach programs to the large population of Spanish speaking residents. The
25
needs assessment and secondary data. Additionally, for medical resources and
referrals, a hospital is located within a few miles from the church.
Literature Review
Literature was reviewed for guidance of program planning activities and strategies.
These topics include the requirements of community health centers that inform program
planning strategies, evidence supporting the benefits of community health centers,
strategies for the integration of health care and public health services, community health
centers and the role of social determinants of health, and program planning
methodology.
Community Health Center Requirements That Inform Program Planning Activities and Strategies
The US Department Health and Human Services defines a community health center
as a non-profit private or public entity that serves a medically underserved population
through primary health services and additional health services necessary for the
adequate support for all residents of the area served by the center (HRSA, 2013). For
an organization to become a community health center, regardless of funding, the
organization must address a need for a health center, display community governance,
have a developed business strategy for the sustainment of the center, and provide
comprehensive medical and social services (HRSA, 2013).
Addressing the Need
A community health center is to be located in a medically underserved area or
serving a federally designated medically underserved population (Taylor, 2004). The
26
physicians per 1,000 people, the infant mortality rate, the percentage of incomes below
poverty level, and the percentage of population over the age of 65 (HRSA, 2013). A
score of 62 or less qualifies an area as medically underserved, with a score of 0
representing completely underserved and a score of 100 representing least
underserved (HRSA, 1995). For a federally funded clinic, patients may include those
who are insured or uninsured, while a free clinic can only accept uninsured patients
(NAFC, 2014).
Community health centers are to also have the accessibility and location needed for
the community it serves. Accessible hours of operations as well as location and space
that would be convenient to public transportation for the population served are to be
considered (HRSA, 2013).
Community Governance and Staff
For a federally funded clinic, the governing board must comprise of nine to
twenty-five members, where fifty-one percent of the board consists of patients of the
community served, who use the health center as their primary source of care (HRSA,
2013). No more than half of the board can derive ten percent of their income from the
health industry as well (HRSA, 2013). A diverse community governance board most
often includes members in finance, legal, human resources, operations, evaluation,
strategic planning, resource development, and an executive director (NACHC, 2011).
For a free clinic, there are no specifics of how the governing board is to be comprised,
as long as it is specified by the organization’s by-laws (NAFC, 2014).
Community health centers also need to maintain a core staff of individuals to carry
27
making the recruiting and retaining of physicians and medical staff difficult (NACHC,
2011).
Management and Finance
Financial management of a community health center can sustain the center’s
financial viability (NACHC, 2011). Financial viability can be demonstrated through a
business plan (NACHC, 2011). A business plan is a valuable strategy in the program
planning process for a health center because of the translation of services into
“volumes” or “revenues” (HRSA, 2013).
In a business plan for a health center, the purpose, goals, and objectives of the
health center will be identified as it relates to the needs of the community(NACHC,
2011). Next, the plan will document results of market research, displaying the trends in
health care at the community, state, and federal levels (NACHC, 2011). Results of
market research will also display population groups to be targeted by the center,
competitors with similar services, and the current legislative environment (NACHC,
2011). From these results, strategy of the services provided and how to attract the
target population will be determined. Partnerships can also be consulted for
collaboration of expertise and resources in developing strategy of services, as well as
outside consultants (NACHC, 2011). Financial projections for three or more years can
then be proposed, with assumptions based on proposed patient volumes, services, and
support staffing (NACHC, 2011). Lastly, the organization is to have an implementation
plan at the end of the business plan with specific activities, individual responsibilities,
and target dates for all tasks and operations for the initiation of the health center
28 Comprehensive Services
Comprehensive services of health centers are required to reflect the diverse needs
of the targeted population (HRSA, 2013). Community health centers, in general, serve
low-income, predominantly female, racially, ethnically, and linguistically diverse
populations, with almost two-thirds of health center patients being of racial or ethnic
minority groups. In many areas, community health centers are the only provider of
services (Taylor, 2004).
Health centers are to provide services regardless of the patient’s ability to pay for
the services. Fees may be adjusted to allow for patients to pay for services in federally
funded clinics or services may be provided for free, as required by free clinics (HRSA,
2013; NAFC, 2014). Comprehensive services can include primary medical services,
diagnostic laboratory services, preventative services such as prenatal care and
immunizations, eye/ear/dental screening for children, family planning, emergency care,
medical care, pharmacy, referrals to other providers, and patient case management for
support, financial, and housing services (HRSA, 2013). Community health centers can
also include enabling services like outreach, health education, eligibility assistance,
transportation, and translation services (Taylor, 2004).
Evidence Supporting the Benefits of Community Health Centers
The use of a community health center has shown to be beneficial to the population
that it serves through literature provided. The benefits of decreased hospitalizations
(Rothkopf, 2011), as well as cost-savings for both the patient and health care system
(Robert, 2007) suggests that investments in community health centers result in
29
Decrease in hospitalizations through use of health centers
Patients who use a community health center have been seen to have less hospital
re-admissions than those seen by other providers (Rothkopf, 2011). The rate of
preventable hospital admissions in the patient population of a community health center
is often a measure of how well the community health center is caring for Medicaid
patients. The Colorado Department of Health Care Policy conducted a study (Rothkopf,
2011) examining 179,749 Medicaid patients during the fiscal year of 2008. For
emergency department visits, patients who had utilized the community health center
resulted in statistically significant fewer odds of an emergency department visit, an
inpatient hospitalization, and a hospital admission for a chronic condition, such as
diabetes, asthma, or hypertension, than a private provider’s patient. Due to the lack of
available data, the study did not control for race, education, and income; however, the
benefit of the utilization of a community health center was recognized (Rothkopf, 2011).
Another study conducted by the Department of Preventive and Societal Medicine of
the University of Nebraska Medical Center examined rural residents and the use of
community health centers in health professional shortage areas (Zhang, 2006). This
study assessed 538,580 Nebraska hospital discharges related to ambulatory care
sensitive conditions. Ambulatory care sensitive conditions were referred to as
diagnoses for which timely and effective care could help reduce risks of hospitalization,
through prevention, controlling the illness, or managing chronic disease. Examples of
these conditions included congestive heart failure, asthma, diabetes, and hypertension.
In this analysis, elderly patients residing in a rural Nebraska area with at least one
community health center were statistically significant less likely to have a hospitalization
30
community health center. Although this data was only limited to the state of Nebraska
and may not accurately reflect the population as patients may include those who
traveled from different counties to seek care, the use of a community health center for
medical care was still a significant factor associated with decreased hospitalizations
among those living in a health professional shortage area (Zhang, 2006).
The cost effectiveness of community health centers
With increasing health care costs, inadequate access, and economic pressures, the
United States health system faces financial challenges (Robert, 2007). However,
community health centers have shown to have economic value in cost savings,
economic growth, and production of jobs (Robert, 2007). The report “Access Granted:
The Primary Care Payoff” conducted by the National Association of Community Health
Centers, the Robert Graham Center, and the Capital Link found through analysis of
2004 Medical Expenditure Panel Survey data that community patients’ medical
expenses were forty-one percent lower, approximately $1,810 annually, than other
patients receiving care elsewhere (Robert, 2007). Additionally, in return, community
health centers save health care systems of 9.9 to 17.6 billion dollars a year by
preventing re-admissions, hospital and outpatient visits, emergency care, and duplicate
medication therapy (Robert, 2007). Community health centers also have an impact on
the community, generating 12.6 billion dollars of economic benefits through direct
employment of the residents, capital developments, and the purchase of goods and
services from local businesses (Robert, 2007).
Community health centers providing services at accessible hours which lead to the
31
savings, according to a recent study (Patwardhan, 2012). A retrospective study
conducted in Illinois by Patwardhan (2012), found that approximately forty-five percent
of 2,675,303 patients during the years of 2007-2009, who utilized community health
centers did so after 5pm or on the weekend. Also, only twenty-nine percent of
physicians reported having the needed support to see patients outside of normal
physician hours (Patwardhan, 2012). Some of the patients were still choosing to visit
the community health center during physician office hours as well; however, this choice
may not be of benefit as lack of care continuity from not seeing a regular primary care
physician may have resulted. Yet, an estimate of the net savings by using the clinic in
the study in comparison to the costs of emergency room, urgent care visit, or seeing a
primary care physician resulted in a net saving total of $135.3 million (Patwardhan,
2012).
Strategies for the Integration of Health Care and Public Health Services and Methods
The joint effort of primary care and public health results in successful interventions,
in the use of a health clinic (IAF, 2012). A tiered approach to the impact of health care
interventions as well as a multidisciplinary approach has results in improved health
outcomes (Frieden, 2010).
The Health Impact Pyramid
The traditional model of the potential impact of health care interventions is the four
tier health pyramid, where the bottom level represents population-wide interventions,
and each ascending level has lessening impact on primary, secondary, and tertiary
levels of care, respectively (Issel, 2008). An alternative five-tier health impact pyramid
32
population’s health at the base, followed by public health interventions, protective
interventions with long-term benefits, direct clinical care, and at the top level, counseling
and education.
Figure 8:Frieden’s Health Impact Pyramid.
Addressing socioeconomic factors (tier 1) has a strong potential to impact health
according to Frieden (2010). Public health interventions (tier 2), represent interventions
such as those that change the environment to allow for default healthy choices,
regardless of education, income, and other factors. Examples include interventions for
fluoridated water, cleaner air, and improvements in food safety and quality. Long lasting
protective interventions (tier 3), can be one time or infrequent interventions that do not
require ongoing care. These interventions generally have less impact affecting
individuals, rather than an entire population. Examples of this tier include
immunizations and colonoscopies. Clinical interventions (tier 4) represent the fourth
level, as ongoing medical care treating health conditions such as diabetes or
hypertension. Finally, the top tier, counseling and educational interventions (tier 5), may
be seen as the least effective intervention compared to other interventions (Frieden,
33
unless induced with pharmacologic assistance (Frieden, 2010). However, as this tier
may be the only intervention available, if successfully applied consistently and
repeatedly, based on evidence, can eventually have an impact (Frieden, 2010). The
five tiered approach will be useful in designing appropriate public health strategies at all
levels, involving a multidisciplinary approach for the community health center program.
Institute of Medicine and integration of primary care and public health
Although primary care and public health both work to improve the health of the
individual, these two entities tend to work separately from each other. Primary care
tends to focus on treating immediate medical physical health needs, while public health
tends to focus on providing a broad range of services to communities and populations
that collectively serve for their health (IOM, 2012). In a report by the Institute of
Medicine (2012), the integration between primary care and public health consist of the
following core principles: 1) a common goal of improving population health, 2) involving
the community in defining needs, 3) strong leadership working to bridge the disciplines
and programs, 4) sustainability, and 5) collaborative use of data and analysis. The IOM
states that a successful integration can occur on a continuum that would first include
mutual awareness of each other’s activities fostering cooperation and sharing of
resources, such as space and personnel. Collaboration can then occur, which may
involve joint planning and execution for a combined effort toward health promotion
activities. Finally, partnership implies integration on the program level, and the two
entities would eventually work closely together, and become fully integrated (IOM,
34
approaching strategies collaboratively among multiple disciplines for program
implementation of the community health center.
Examples of successful integration
The ecological model of public health serves as a model for integration of primary
care and public health, on the premise that an individual’s health is shaped by the social
environment including multiple levels of influence (Sallis, 2008). According to this
model, individual health is governed by multiple levels of influences, including
intrapersonal such as biological or psychological factors, interpersonal such as social or
cultural contexts, community influences, physical environment, policy, and
organizational influences (Sallis, 2008). The following are examples of integrated
health management approaches that impact population health, which will serve as
examples for strategies to integrate health care and public health for the community
health center program plan.
An example of successful integration is noted in the 2009 Ontario H1N1 influenza
pandemic. During this pandemic, interdisciplinary teams of primary care physicians
diagnosed and treated the H1N1 patients while public health professionals managed
infection control, clinical guidelines, and communicated preventative strategies of cough
etiquette and quarantine procedures to the public. Information about the influenza
pandemic communicated by public health professionals to physicians during this time
allowed pertinent information to reach ninety-four physicians treating more than 113,000
patients, which was fifty-five percent of the patients in the Kingston, Frontenac, Lennox,
35
The World Health Organization (WHO) has also proposed a strategy of integrating
public health with primary care (Gilks, 2006). Since 2001, WHO has been promoting an
integrated approach to providing antiretroviral therapy in resource poor settings (Gilks,
2006). As resource poor settings such as developing countries do not have the
technology resources and specialist doctors of western therapy, treatment remains
difficult. Public health approaches have been used to address the lack of resources
with decentralized integrated delivery of care, training and job-aids for clinical teams,
materials to support patient education, and task shifting, the sharing of clinical
responsibilities from physicians to lower healthcare workers and those in the community
(Gilks, 2006). Additionally, while working with primary care teams on the provision of
simplified treatment guidelines for antiretroviral therapy, WHO has been working with
communities to provide the antiretroviral therapy for free at point of service (Gilks,
2006). A limitation to this approach is surveillance needs to be conducted as switching
treatment guidelines for the basis of cost could develop into concerns of drug-resistant
strains. Despite this, WHO reports that more than a million people in developing
countries are benefiting from this comprehensive and integrated form of therapy (Gilks,
2006).
Community Health Centers and the Social Determinants of Health
Social determinants of health are defined according to the World Health
Organization, as circumstances, in which people are born, grow up, live, work, and age,
and the systems put in place to deal with illness (WHO, 2014). Examples of social
determinants of health that affect patients of community health centers include housing,
36
services. For example, employment status has been reported to affect health. Income
allows for access to insured care and health promoting options; a larger income results
in more nutritious food, living in safe neighborhoods, good public schools, and coping
mechanisms with daily and chronic stress (RWJF, 2013). Education has been strongly
associated with measures of health, as those who were well educated testified to having
more supportive relationships, and more sense of control over life, including that of
living a healthy lifestyle (Ross, 1995). Higher education was also related to more
positive behaviors, such as being less likely to smoke, drink heavily, being overweight
or obese, or using illegal drugs (Cutler, 2007). Barriers to access of preventative
services were also reported to negatively affect health, resulting with inability to address
medical conditions (Kertesz, 2014).
Recognizing and leveraging social determinants of health may have a bigger impact
on life expectancy and health status than medical care itself (IAF, 2012). Social
determinants of health may be identified by assessments, and then design and strategy
initiative plans can be implemented by the community health centers and input from
community leaders. Partnership efforts can be established for the leadership needed to
target these initiatives from the program plan, as well as have buy-in into the initiatives
to develop and sustain these efforts (IAF, 2012). The health needs assessment
recognizes the social determinants of health affecting the Clark-Fulton neighborhood
and strategies will be designed to address these factors, along with input from
37
Addressing social determinants of health with community initiatives
Community health centers evolved out of the community-oriented primary care
movement, where primary care providers extended care to treat beyond physical health
addressing family dynamics or outside factors that may be affecting patient health, such
as the environmental, behavioral, and social context that health illness occurs (IAF,
2012). Jack Geiger, an internist and epidemiologist in the 1950s, addressed these
determinants on the principles of community-oriented primary care movement,
recognizing that the physician’s role was to augment their clinical work to address the
social determinants of health, stimulating family and community interest in health, and
educating on how to improve health, prevent disease, and seek suitable care (IAF,
2012). However, he recognized that a health care provider cannot provide this work by
himself; he needed the help of other multidisciplinary staff. His community-oriented
primary care approach to address social determinants of health resulted in equal to
better health outcomes compared to settings where health care providers did not
address social determinants of health (IAF, 2012). From this example, addressing the
social determinants of health along with medical care in the community health center
can help improve health outcomes in the Clark-Fulton neighborhood.
Social exclusion as a result of racial, ethnic, or cultural differences can be a social
determinant of health. These differences can lead to socioeconomic disadvantages
making healthy lifestyle choices limited, and chronic stress related to experiences of
racial bias can contribute to illness as well (RWJF, 2013). To address social exclusion,
the U.S. Federal Government created the REACH program (Racial and Ethnic
Approaches to Community Health Program), a federally funded program to forty racial
38
coalition that would develop, implement, and evaluate community action plans to
address health disparities. Each community focused on providing community support
for a healthy lifestyle, supporting community health workers in disease management,
and educating community members through the use of media or health workers. Many
communities benefitted greatly as a result of this program. A city ordinance to ban fast
food restaurants in Los Angeles was put in place, a twenty-one percent gap in
hemoglobin A1c testing existed between African-Americans and Caucasians was nearly
eliminated with the program in South Carolina, and Hispanics who participated in the
REACH program had a higher compliance rate for cholesterol maintenance than trends
seen nationally (Giles, 2010). The community support in addressing the social
determinants of health can further support community initiatives and will be used in
strategies and the program implementation of the community health center.
Program Planning Methodology
Program planning, according to Issel (2008), is a set of activities where individuals
create a list of improvements, develop a strategy to achieve them, and establish means
to measure attainment of the desired improvements (Issel, 2008). The stages of
program planning theory as well as the theories of stages of change, health belief
model, and community organization will guide how the community health center
program planning interventions will be designed and strategized.
Population practice: Stages of program planning
To effectively develop a community health center program plan, a public health
practitioner leading the program planning process must be able to effectively engage
39
acknowledge the differences in demographics in the population. Population based
practice, focuses on providing services not to the individuals but to the entire population
(Keller, 2002). A population based program model consists of a community
assessment, the prioritization of health problems, program planning, and program
evaluation (Keller, 2002).
The intent of a community health assessment in population based practice defined
by Keller (2002) is examining all populations in a given area to identify the health status
of the population through collection and analysis of health status data such as births
and deaths as well as collection and analysis of the determinants of health of all
populations. Community members and partners can then be gathered to prioritize
problems and establish priorities. These priorities will direct the program planning and
the goals and objectives selected. The underlying theory of action determines what will
change as a result of the strategy chosen, and how the strategy will work. The level of
intervention, whether on a community, system, or individual level, and the level of
prevention desired, determines the selection of strategies involved (Keller, 2002). This
population based practice approach will guide the stages of program planning of the
community health center.
The theories below will be used to determine how to impact individual and
community health with the community health center (Keller, 2002).
Change Theories/Models for Community and Organizations
Interventions aimed at improving the health status of the population may be directed
at entire populations in a community, the systems that may affect those in the
40
review represent individual and community level strategies that are helpful in planning a
community health center.
Individual-Stages of Change
For an individual model, the stages of change model focuses on individuals’
motivation and readiness to change behaviors (NCI, 2013). In this model, behavioral
change is examined as not an instant change, but rather a continued process. Five
stages define focused behaviors in this model: precontemplation, contemplation,
preparation, action, and maintenance. The stages can be defined as follows (NCI,
2013):
Precontemplation stage is having no intention of taking action within the next
six months;
Contemplation stage is the intention to take action in the next six months;
Preparation stage is the intention to take action within the next thirty days and
has taken some behavioral steps toward it;
Action stage is a changed behavior for less than six months;
Maintenance stage is changed behavior for more than six months
This model is circular, rather than linear; individuals may relapse in earlier stages or
stop at any point, but the stages of change remain circular (NCI, 2013). This model will
be used to tailor appropriate interventions toward positive behavior changes for the
community health center.
Another individual model is that of the Health Belief Model. This model focuses on
addressing problematic behaviors that may cause health concerns and can be applied