ISSN: 2252-8938 1
Classification of Power Quality Events Using Wavelet analysis
and Probabilistic neural Network
Pampa Sinha*, Sudipta Debath**, Swapan Kumar Goswami**
* Electrical Engineering Department, Netaji Subhash Engineering College, Technocity, Garia
** Electrical Engineering Department, Jadavpur Univrsity
Article Info ABSTRACT
Article history: Received Dec 4, 2015 Revised Feb 7, 2016 Accepted Feb 25, 2016
Power quality studies have become an important issue due to widespread use of sensitive electronic equipment in power system. The sources of power quality degradation must be investigated in order to improve the power quality. Switching transients in power systems is a concern in studies of equipment insulation coordination. In this paper a wavelet based neural network has been implemented to classify the transients due to capacitor switching, motor switching, faults, converter and transformer switching. The detail reactive powers for these five transients are determined and a model which uses the detail reactive power as the input to the Probabilistic neural network (PNN) is set up to classify the above mentioned transients. The simulation has been executed for an 11kv distribution system. With the help of neural network classifier, the transient signals are effectively classified.
Keyword:
Detail Reactive Powers, Power System,
Probabilistic Neural Network. Switching-Transients,
Wavelet Decomposition Copyright © 2016 Institute of Advanced Engineering and Science. All rights reserved.
Corresponding Author: Pampa Sinha,
Electrical Engineering Department,
Netaji Subhash Engineering College, Technocity, Garia. Kolkata-700152,
Email: [email protected]
1. INTRODUCTION
Detection and classification of transient signals have recently become an active research topic in the area of power quality analysis [1-5]. In [6-7] the authors have proposed a method to classify the power system transients based on dual tree complex wavelet transform (DTCWT). But in this method computational complexity is very high. Power transients occur from variety of disturbances on the power system like, capacitor bank switching, different types of faults, converters and different apparatus switching. In order to improve the power quality, the location of such disturbances must be identified. Techniques like wavelet transforms, mathematical morphology etc have been used to identify them [5-7]. Wavelet analysis, can extract the essential features of transient signal effectively for its classification. With these features as inputs to the neural network, classification of the switching transients, short circuit fault, primary arc, lightning disturbance and lightning strike fault is possible [8]. Authors of paper [9] have proposed a discrete wavelet transform (DWT) based on multiresolution analysis technique and parseval’s theorem which is employed to extract the energy distribution features of transient signal at different resolution levels. Probabilistic neural network (PNN) classifies the extracted features to identify the disturbance type. In paper [10] a discrete wavelet transform and multi fractal analysis based on a variance dimension trajectory technique have been used as tools to analyze the transients for feature extraction. A probabilistic neural network is used as a classifier for classification of transients associated with power system faults and switching. The authors of paper [11] presented DWT-FFT based integrated approach for detection and classification of various PQ disturbances with and without noisy environment. Ibrahim and Morcos [12] have given a survey of artificial intelligence technique for power quality, which includes fuzzy logic, artificial neural network (ANN) and genetic algorithm. Wavelet based on line disturbance detection for power quality applications have been discussed in [13]. Perunicic et al. [14] used wavelet coefficients of discrete wavelet transform (DWT) as
inputs of a self organizing mapping neural network to identify DC bias, harmonics, voltage sags and other transient disturbances. Elmitwally et al. [15] have proposed a method in which wavelet coefficients are used as inputs to the neuro- fuzzy systems for classifying voltage sag, swell, interruption, impulse, voltage flicker, harmonic and flat-topped waves. Chang and Wenquang [16] analyzed the effect of transients arising due to utility capacitor switching on mass rapid transient. Liu et al .[17] extracted features from the DWT coefficients of some typical power transients using scalogram. In [18] the authors have proposed a novel method for identifying, characterizing and tracking grounded capacitor banks connected to a power distribution line in a cost effective manner. Beg et al .[19] proposed a simple method based on DWT and a multi- layer feed forward artificial neural network for classification of capacitor, load switching and line to ground fault. In this method success rate is 97.47%.
To identify the type of transient the first step is to extract the feature of the transient signal. These features are used as input to a classifier for classification. The Probabilistic neural network (PNN) is used as a classifier in [20-29]. Probabilistic neural network combines some of the best attributes of statistical pattern recognition and feed-forward neural networks. Therefore, the PNN is chosen as a proper classifier of transients signals. In [30] have shown wavelet based reactive power computation resulting from 90° phase shift networks which gives the reactive power is shown. Wavelet transform has been used to reformulate the newly defined power components [31]. Wavelet analysis is able to extract the features of data, breakdown points and discontinuities very effectively.
The present paper attempts to classify the different types of transients such as capacitor switching, motor switching, different fault induced transients, converter and transformer inrush using a simple PNN based technique. To extract unique feature of each transients first discrete wavelet transform (DWT) has been performed to calculate the detail reactive power at level 1 and 3. As artificial neural network has the capability to simulate the learning process and work as a classifier, probabilistic neural network has been used to classify the mentioned transient disturbances and it has been shown that this single point strategy is very effective in classifying the different transient signals.
2. WAVELET TRANSFORM BASED DETAIL REACTIVE POWER
This section redefines power components definitions contained in IEEE Standard 1459-2000 [31] for single phase system under nonsinusoidal situations. Consider the following sinusoidal and nonsinusoidal voltage and current waveforms:Tables and Figures are presented center, as shown below and cited in the manuscript.
v1=√ sin(ωt-α1), i1=√ sin(ωt-α1), (1)
vH=
)
sin(
1
2
h
t
h
h
V h
(2)iH=
)
sin(
1
2
h
t
h
h
I h
(3)Where, v1, i1 represent power system frequency components (ω=2πf=100π rad/sec) while vH, iH
represent the total harmonic voltage and current components, α1 and β1 represent the fundamental voltage and
current phase angle, respectively, while and represent individual harmonic voltage and current phase angle respectively.
The RMS values of voltage and current are
dt
vt
V t
T
0
2
V t V V H 2 2 1 2 1 2 2
h V h
V
H
(4)dt
it
I t
T
0
2
I t2I12I H2
1 2 2
h I h
Where T is the time period. The reactive power as proposed in [30] is measured where vt-90° and it
are the voltage and current signals. vt-90° is obtained by introducing a 90° phase lag at each frequency over its
range. If vt-90° and it are periodic signals with time period T, then reactive power Q is given as
Ti
tv
tdt
T
Q
o0 90
1
(6) In wavelet domain the total reactive power (Q) is defined as
Q=Qapp+Qdet[24] (7)
Where Qapp is the approximation reactive power and Qdet is the details reactive power.
Qdetis defined as
Qdet=∑ ∑ [23] (8)
Where, j0 is scaling level, the voltage and current signals are digitized with n=0, 1, ---2P-1, dj,k is
wavelet coefficient of current and d"j,k is the coefficient of voltage with 90° phase shift at wavelet level j and
time k.
3. CALCULATION OF DETAIL REACTIVE POWER IN A RADIAL DISTRIBUTION SYSTEM
A radial distribution network is shown in Fig. 1.The fundamental frequency internal impedance of the voltage source ZS is considered to be (0.5+j0.5) Ω and the line impedance is (1+j1) Ω for each section. The fundamental frequency impedance of each load viz. Z1, Z2, Z3, Z4 and Z5 is (300+j300) Ω when all the loads are linear. Transformer, capacitor, motor and converter have been connected with time controlled switch to each bus to get detail reactive power under different transient conditions. EMTP simulation package has been used to capture instantaneous voltage and current signals. The voltage and current signal have been processed and analyzed using discrete wavelet transform (DWT) in MATLAB.
An 11 kv distribution system is studied in this paper and its EMTP model is set up as shown in Fig.1. All the input signals are generated with 128 samples per cycle. Its recording time is 0.1 second and hence sampling frequency of the signal is 6.4 kHz. Reference frequency is 50 Hz. There are various types of mother wavelets for signal processing but one of the most popular mother wavelet is Daubechies [36] which has been used to detect and characterize power transients. So the authors have used daubechies wavelet with four filter coefficients (db4) for transient analysis. Simulation of five types of transients is carried out in this network. They are capacitor switching, converter switching, motor switching, fault and transformer switching. The switching transients are classified by probabilistic neural network (PNN). The original signal is decomposed up to level 5 using DWT and after considering all the parameter the authors of this paper have chosen the detail reactive power at level 1 and level 3 i.e. Qdet1 and Qdet3 as inputs to the classifier. The
proposed method is a single point strategy because in this method all the voltage and current signals are captured from the sending end side only.
4. WAVELET TRANSFORM BASED FEATURE EXTRACTION
a. Capacitor switching
Figure. 2.1 and Figure. 2 show the capacitor switching transients in the above mentioned radial network. In this paper the authors have used capacitors of different ratings (50µF to 550µF) and they varied the switching time to capture the detail reactive power to distinguish the capacitor switching transients from other transients. Table 1 shows the values of Qdet from level 1 to level 5 at different buses when 150µF
capacitor is switched on. b. Motor switching
Figure. 3 shows the motor switching transients of the above mentioned radial network. To perform the simulation, induction motor with different rating (5 KW to 10 KW) has been considered and their switching time is also varied to collect sufficient number of data.
Table 2 shows different values of Qdet from level 1 to level 5 at different buses when a 9KW induction motor
is switched on when voltage was at its peak value.
c. Fault induced events
In Figure. 4 the faults induced transients are shown and Table 3 shows different values of Qdet from
level 1 to level 5 when unsymmetrical fault occurs at different buses. d. Converter
Figure. 5 shows the transients which are generated by the converters. In this paper the authors have used both 6 pulse and 12 pulse converters with varying firing angles. Table 4 shows the different values of Qdet from level 1 to level 5 at different buses.
e. Transformer switching
Figure. 6 shows transformer generated transient. Transformers with different KVA ratings have been chosen to distinguish the transformer inrush with the other transients. Table 5 shows the different values of Qdet from level 1 to level 5 when a 100 KVA transformer is switched on.
5. PROBABILISTIC NEURAL NETWORK (PNN)
After calculating the DWT based detail reactive power at level 1 and 3, the authors have classified the different transient signals in the network. The problem of multi-class classification has been considered in this paper. A set of data points are given from each class and objective is to classify any new data sample into one of the classes. Hence the authors used the probabilistic Neural Network (PNN) as a classifier because it can learn the complex nonlinear mapping from the input space to output space.) The base of PNN is the Bayes classification rule and Parzen’s method of probability density function (PDF) estimation [10].
An unknown sample X=(x1,….xp). is classified into class k if
uk lk fk(X)>uf lf fj(X) for all classes j not equal to k.
Bayes classification rule improves the classification rate by minimizing the expected cost of misclassification. In this rule first PDF has to be estimated based on a training set. A method of determining a univariate PDF from random samples has been presented by Prazen [10]. With the increase of number of samples the univariate PDF converges asymptotically to the true PDF. Assuming there are nk number of
training cases for a given class k and the estimated univariate PDF for that class, vk(x), is
∑
Where W(x) is a weight function (kernel) and the σ is scaling parameter which defines the width of the kernel. W(x) is the Gaussian Function. Since the PNN processes p inputs variables, the PDF estimator must consider multivariate inputs [10]. Fig. 7 shows the PNN architecture which consists the four layer organization.
The input neurons distribute input variables in the input layer to the next layer. One neuron consists with one training case and it computes distance between the unknown input x and training case represented by that neuron. An activation function, known as the Parzen estimator, is applied to the distance measured. In the summation layer, the neurons sum the values of the neurons corresponding to the class who’s estimated PDF has to be determined in the pattern layer by the Bayes discriminate criterion. In the output layer, which is simple threshold discriminator a single neuron has been activated to represent a projected class of the unknown sample.
6. CLASSIFICATION OF TRANSIENTS USING PNN
To check the validity of the proposed method simulation work has been conducted to classify the different transients in power system. Each type of transient is treated as an individual class and assigned the classification number from 1 to 5. MATLAB code is used to calculate the DWT based detail reactive power i.e. Qdet1 and Qdet3. These detail reactive powers are used as input to the ANN model. For each transient 75
sets of features are extracted, in which 25 sets are used as training purpose i.e. 125 features are taken as training samples and another 50 sets i.e. 250 features are used for testing purpose. To obtain the training and testing data for ANN model for each transient, the authors have varied value of the capacitance of the capacitor, KW rating of the induction motor, converter firing angle, KVA rating of transformer, fault resistance and time of occurrence of fault.
The simulations produced 375 sets of detail reactive power (Qdet) up to level 5 individually for the
Applying this method it is noticed that success rate for identifying the different classes of transients depends on the decomposition level also. Table 7 shows the variation of success rate by varying decomposition level. From this table it is observed that if the original signal is decomposed up to level 5 instead of level 3, the success rate remains same. It is also observed that the success rate at 1st, 3rd and 6th row is same. But in remaining rows the success rate is quite low. So considering all the results the authors have chosen only level 1 and 3 i.e. row 6th to reduce the computational burden.
The classification results can be described in terms of confusion matrix which is a standard tool for testing classifier. From Table 8 one can see that a confusion matrix has one row and one column for each class. The row represents the original class and the column represents the predicted class by the PNN classification. The number in the matrix shows the various pattern of misclassification that is obtained from the testing set. For instance, in Table 8, we can observe that out of 50 cases of motor switching only one has been misclassified as fault. In this table network classification error rate for each type of transients are mentioned. From the above result it can be concluded that using this method the network classifies correctly 249 data out of 250. That means the correct classification rate is 99.6%. In Table 3 it can be seen that most of the classification error occurs in between class 2 and 3, because characteristic harmonics of these two switching are nearly similar.
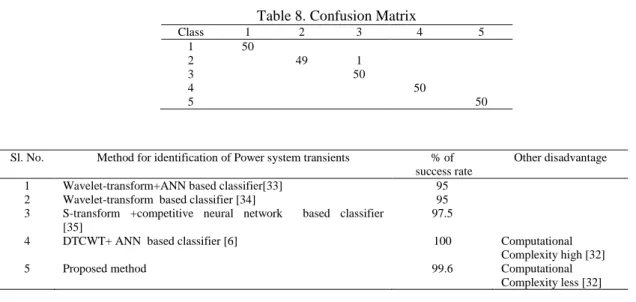
7. COMPARATIVE STUDY WITH OTHER METHODS
In Table 9 a comparative study with the other existing method is presented. These methods are somewhat similar with the methodology proposed in this paper i.e. they extracted the features of distorted signal using wavelet transform and then classified those signal by using artificial intelligence technique. The results presented in Table 9 have shown that the proposed method gives better performance compared to the existing methods because in this method success rate is 99.6% and computational complexity is lower than the method proposed in [6].
8. CONCLUSIONS
In a monitoring system the indicators that contain the unique features of power systems are acquired for distinguishing disturbances. But for effective classification of the disturbances, storage of a large number of data should be avoided.
In this paper a novel and simple method has been proposed based on DWT and PNN for classification of capacitor switching, converter switching, motor switching, transformer switching and fault induced events. An accurate and reliable power transient classifier has been developed to distinguish these transient signals. DWT has been used to calculate the detail reactive power at level 1(Qdet1) and 3 (Qdet3)
which are used as the input to the ANN model. Here Probabilistic Neural network has been used as a classifier. To check its validity and reliability different case studies are considered which show that this technique is well suited for classification of transients in power system network.
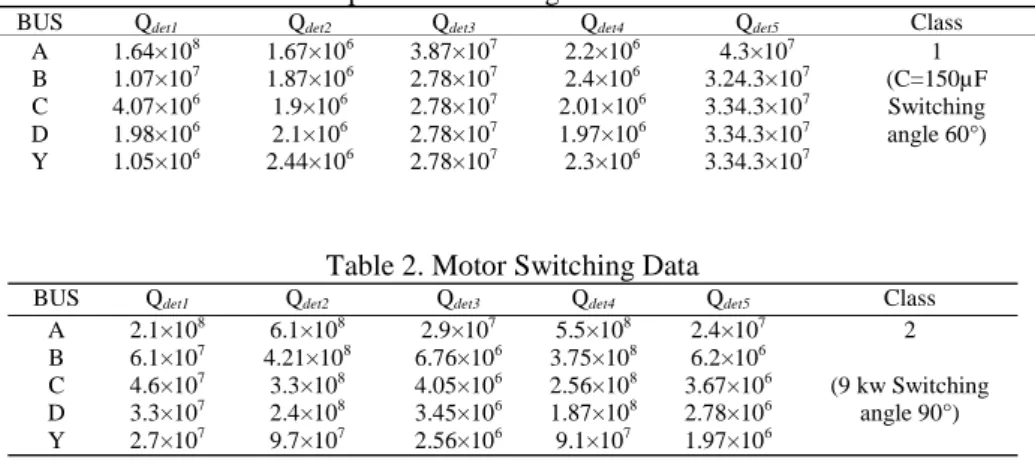
Table 1. Capacitor Switching Data At Different Bus
BUS Qdet1 Qdet2 Qdet3 Qdet4 Qdet5 Class
A 1.64×10⁸ 1.67×10⁶ 3.87×10⁷ 2.2×10⁶ 4.3×10⁷ 1
(C=150µF Switching angle 60°)
B 1.07×10⁷ 1.87×10⁶ 2.78×10⁷ 2.4×10⁶ 3.24.3×107
C 4.07×10⁶ 1.9×10⁶ 2.78×10⁷ 2.01×10⁶ 3.34.3×107
D 1.98×10⁶ 2.1×10⁶ 2.78×10⁷ 1.97×10⁶ 3.34.3×107
Y 1.05×10⁶ 2.44×10⁶ 2.78×10⁷ 2.3×10⁶ 3.34.3×107
Table 2. Motor Switching Data
BUS Qdet1 Qdet2 Qdet3 Qdet4 Qdet5 Class
A 2.1×10⁸ 6.1×10⁸ 2.9×10⁷ 5.5×10⁸ 2.4×10⁷ 2
(9 kw Switching angle 90°)
B 6.1×10⁷ 4.21×10⁸ 6.76×10⁶ 3.75×10⁸ 6.2×10⁶
C 4.6×10⁷ 3.3×10⁸ 4.05×10⁶ 2.56×10⁸ 3.67×10⁶
D 3.3×10⁷ 2.4×10⁸ 3.45×10⁶ 1.87×10⁸ 2.78×10⁶
Table 4. Converter Switching Data At Different Bus
BUS Qdet1 Qdet2 Qdet3 Qdet4 Qdet5 Class
A 5.21×10³ 4.9×10⁴ 1.68×10⁶ 4.49×10⁴ 5.45×10⁷ 4
(α=60° firing angle)
B 3.61×10³ 4.77×10⁴ 1.68×10⁶ 4.51×10⁴ 4.56×10⁷
C 1.53×10³ 4.58×10⁴ 1.68×10⁶ 4.74×10⁴ 3.45×10⁷
D 1.25×10³ 4.55×10⁴ 1.68×10⁶ 4.77×10⁴ 2.34×10⁷
Y 1.2×10³ 4.54×10⁴ 1.69×10⁶ 4.61×10⁴ 1.12×10⁷
Table 5. Transformer Switching Data At Different Bus
BUS Qdet1 Qdet2 Qdet3 Qdet4 Qdet5 Class
A 1.05×10⁵ 5.98×10⁵ 1.83×10⁷ 6.07×10⁷ 6.2×10⁵ 5
(10 KVA Switching angle 60°)
B 1.04×10⁵ 5.97×10⁵ 1.78×10⁷ 5.99×10⁷ 6.01×10⁵
C 8.9×10⁴ 5.85×10⁵ 1.78×10⁷ 5.2×10⁷ 5.9×10⁵
D 1.09×10⁵ 5.2×10⁵ 1.79×10⁷ 3.45×10⁷ 5.28×10⁵
Y 1.17×10⁵ 5.15×10⁵ 1.78×10⁷ 2.3×10⁷ 5.6×10⁵
Table 6. Classes of transient samples and simulated data set for training and testing of PNN network
Type of transient Assigned
Class
Training data (Set)
Testing data (Set)
Capacitor switching 1 25 50
Motor switching 2 25 50
Fault 3 25 50
Converter 4 25 50
Transformer switching 5 25 50
Table 7. Decomposition Level And % Of Success Rate
SL. No Decomposition level Features
selected
% of success
rate
1 Decomposed
up to Level 5
Qdet1 toQdet5 99.6
2 Decomposed
up to Level 4
Qdet1 toQdet4 99.6
3 Decomposed
up to Level 3
Qdet1 toQdet3 99.6
4 Decomposed
up to Level 2
Qdet1 toQdet2 92.1
5 Decomposed
at Level 1
Qdet1 only 21.4
6 Decomposed
at level 1 and 3
Qdet1 and Qdet3
only
99.6
7 Decomposed
at level 1 and 2
Qdet1 and Qdet2
only
97.6
Table 3. Fault Induced Transient Data At Different Bus
BUS Qdet1 Qdet2 Qdet3 Qdet4 Qdet5 Class
A 2.5×10⁵ 1.2×10⁶ 2.3×10⁶ 1.1×10⁶ 6.8×10⁵ 3
(Rf=20 Ω
Switching angle 90°)
B 1.1×10⁵ 1.2×10⁶ 7.2×10⁶ 4.2×10⁵ 3.2×10⁵
C 4.2×10⁴ 5.67×10⁵ 4.2×10⁶ 2.1×10⁵ 2.1×10⁵
D 3.98×10⁴ 2.95×10⁵ 3.1×10⁶ 1.1×10⁵ 1.06×10⁵
Table 8. Confusion Matrix
Class 1 2 3 4 5
1 50
2 49 1
3 50
4 50
5 50
Figure 1. The Example Network
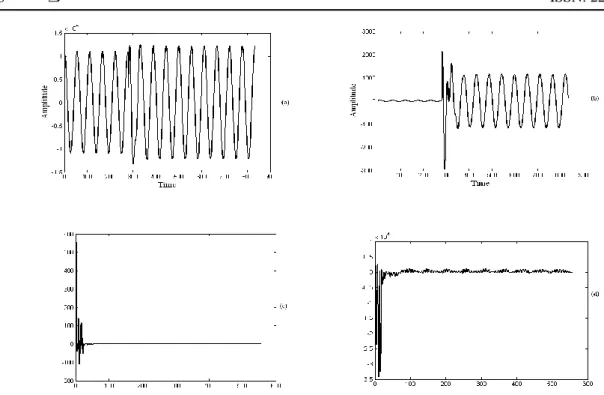
Figure 2.1. (a) simulated current transient during capacitor switching, (b) current signal decomposed at level 1, (c) current signal decomposed at level 3.
Sl. No. Method for identification of Power system transients % of
success rate
Other disadvantage
1 Wavelet-transform+ANN based classifier[33] 95
2 Wavelet-transform based classifier [34] 95
3 S-transform +competitive neural network based classifier
[35]
97.5
4 DTCWT+ ANN based classifier [6] 100 Computational
Complexity high [32]
5 Proposed method 99.6 Computational
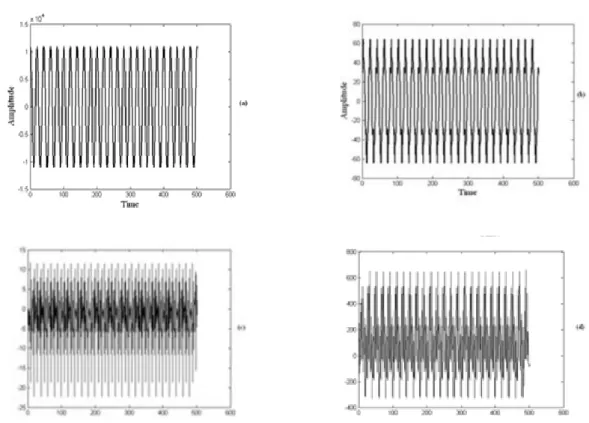
Figure 2.2. (a) Voltage profile during Capacitor switching transient, (b) Current profile during Capacitor switching transient (c) detail reactive power profile at level 1, (d) detail reactive power
profile at level 3.
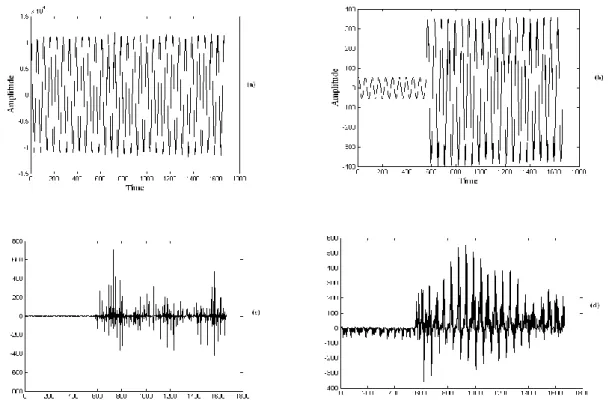
Figure 3. (a) Voltage profile during Motor switching transient, (b) Current profile during Motor switching transient (c) detail reactive power profile at level 1, (d) detail reactive power profile at
Figure 4. (a) Voltage profile during Fault induced transient, (b) Current profile during Fault induced transient (c) detail reactive power profile at level 1, (d) detail reactive power profile at level 3.
Figure 5. (a) Voltage profile during Converter Switching, (b) Current profile during Converter Switching transiet, (c) detail reactive power profile at level 1, (d) Detail reactive power profile
Figure 6. (a) voltage profile during Transformer switching transient, (b) Current profile during Transformer switching transient (c) detail reactive power profile at level 1, (d) detail reactive power profile at level 3.
Figure 7. PNN Architecture
REFERENCES
[1] Reddy, M.J.B, and Mohanta ,D.K, Detection, classification and localization of power system impulsive transients using S-transform. In: Environment and Electrical Engineering (EEEIC), 9th International Conference , Prague, Czech Republic May 16-19, 2010.
[2] Styvaktakis, E., Bollen, M.H.J.; Gu, I. Y. H., Classification of power system transients: sychronised switching. Power Engineering Society Winter Meeting, 2000. IEEE. 2681-2686 vol.4.
[3] Gaouda, A. M., Salama, M.M.A.; Sultan, M.R. and Chikhani, A. Y. Power Quality detection and classification using wavelet- multiresolution signal decomposition. IEEE Trans Power Deliv. 2000; 14(4): 1469-1476.
[4] Angrisani, L.; Daponte, P. and D’Apuzzo, M. Amethod based on wavelet networks for the detection and classification of transients. Instrumentation and Measurement Technology Conference (IMTC/98). Conference proceedings. St. Paul, MN. May 18-21 1998. 903-908 vol.2.
[5] Learned, R. E. Karl, W.C and Willsky, A. S. Wavelet packet based transient signal classification. Time- Frequency and Time-Scale analysis, proceeding of the IEEE- Sp International Symposium. Victoria, BC. Oct.4-6, 1992.
[6] Chakraborty S, Chatterjee A and Goswami S. K.. A sparse representation based approach for recognition of power system transients. Engineering Applications of Artificial Intelligence. 2014;30:137-144.
[7] Chakraborty S, Chatterjee A and Goswami S. K.. A dual tree complex wavelet transform based approach for recognition of power system transients.Expert Syst.,http://dx.doi.org/10.1111/exsy.12066,in press.
[8] Zhengyou H., Shibin G. , Xiaoqin C. , Jun Z. , Zhiqian B. and Qingquan Q. Study of a new method for power system transient classification based on wavelet entropy and neural network. Electr Power Energy Syst.2011; 33: 402-410.
[9] Zwe-Lee Gaing. Wavelet – based neural network for power disturbance recognition and classification. IEEE Trans Power Deliv. 2004; 19(4): 1560-1568.
[10] Chen J, Kinsner W and Huang B. Power System Transient Modelling and Classification. Proceedings of the 2002 IEEE Canadian Conference on Electrical & Computer Engineering.
[11] Deokar S. A, Waghmare L. M. Integrated DWT–FFT approach for detection and classification of power quality disturbances. Electr Power Energy Syst.2014; 61: 594-605.
[12] Ibrahim, W. R. A,. and Morcos, M., Artificial intelligence and advanced mathematical tools for power quality applications: A survey. IEEE Trans. Power Delivery, Vol. 17, pp. 668-673, April 2002.
[13] Mokhtari, H., Karimi- Ghartemani, M,. and Iravani, M. R., Experimental performance evaluation of a wavelet based online voltage detection method for power quality applications. IEEE Trans. Power Delivery, Vol. 17, No. 1, pp. 161-172, January 2002.
[14] Perunicic, B. Mallini, M., Wang, Z., and Liu, Y. Power quality disturbance detection and classification using wavelets and artificial neural networks. Procedings of the 8th International Conference on Harmonics and Quality of Power, pp. 77-82, October 1998.
[15] Elmitwally, A., Farghal, S., kandil, M., Abdelkader, S., and Elkateb, M., Proposed wavelet- neuro-fuzzy combined system for power quality violations detection and diagnosis. Proc. Inst. Elect. Generat. Transm. Generat. Transm. Distribut., Vol. 148, No. 1, pp. 15-20, January 2001.
[16] Chang, C. S., and Wenquang, J., Determination of worst case capacitor switching over voltage of MRT system using genetic algorithm. Elect. Power Compon. Syst., Vol. 27. No. 11, pp. 1161-1170, October 1999.
[17] Liu, J., Pillay, P., and Reibeiro, P., Wavelet analysis of power systems transients using scalograms and multiresolution analysis. Elect. Power Compon. Syst., Vol. 27. No. 12, pp. 1131-1341, November 1999.
[18] Lluna A. P, Manivannan K., Xu P.,Osuna R. G, Benner C. and B. Russell D. Automatic capacitor bank identification in power distribution systems. Electr Power System Research.2014; 111: 96-102.
[19] Beg M. A., Khedkar M. K, Paraskar S. R. and Dhole G. M. Feed-forrward Artificial Neural Network- Discrete Wavelet Transform Approach to Classify Power System Transients. . Elect. Power Compon. Syst., Vol. 41. pp. 586-604, 2013.
[20] Kashyap, K. H. Shenoy, U. J. Classification of power system faults using wavelet transforms and probabilistic neural networks. Circuits and Systems, ISCAS’03. Proceedings of the International symposium on vol: 03. May 25-28, 2003.
[21] Kucuktezan, C. F and Genc, V.M.I. Dynamic security assessment of a power system based on probabilistic Neural Networks. Innovative Smart grid technologies Conference Europe (ISGT Europe) IEEE PES. Gothenburg. Oct. 11-13, 2010.
[22] Mo, F. and Kinsner, W. Probabilistic Neural Networks for power line fault classification. Electrical and Computer Engineering, IEEE Canadian Conference on vol. 2. May 24-28, 1998.
[23] Hu W. B, Li K.C and Zhao D. A novel probabilistic neural network system for power quality classification based on different wavelet transform. Wavelet Analysis and Pattern Recognition. ICWAPR. International Conference on vol.2. Beijing. Nov. 2-4.2007.
[24] Lee, I.W. C and Dash. P.K. S-transform – based intelligent system for classification of power quality disturbance signals. IEEE Transaction Industrial Electronics, 2003; 50 (4): 800-805.
[25] Wahab N. I. A., Mohamed A. and Hussain A. Fast transient stability assessment of large power system using probabilistic neural network with feature reduction technique. Expert systems with Applications, 2011; 38 (9): 11112-11119.
[26] Mohanty S. R, Ray P. K., Kishor N. and Panigrahi B. K. Classification of disturbances in hybrid DG system using modular PNN and SVM. IEEE Transaction Industrial Electronics, 2003; 50 (4): 800-805. Electr Power Energy Syst.2013; 44: 764-777.
[27] Moravej Z, Ashkezari J. D and Pazoki M. An effective combined method for symmetrical faults identification during power swing. Electr Power Energy Syst.2015; 24-34.
[28] Huang N., Xu D., Liu X. and Lin L., Power quality disturbances classification based on S-transform and probabilistic neural network. Neurocomputing. 2012; 98 (3): 12-23.
[29] Biswal B., Dash P.K., Panigrahi B.K. and Reddy J.B.V. Power signal classification dynamic wavelet network. Applied Soft Computing. 2009; 9 (1): 118-125.
[30] Yoon WK, Devaney MJ. Reactive Power Measurement Using the Wavelet Transform. IEEE Trans Instrum Measurement 2000; 49(2):246-52.
[31] Morsi WG , EI- Hawary ME. Reformulating power components definitions contained in the IEEE Standard 1459-2000 using discrete wavelet transform. IEEE Trans Power Deliv. 2007; 22(3): 1910-16.
[32] Wang Y., He Z., Zi Y., Enhancement of signal denoising and multiple fault signatures detecting in rotating machinery using dual-tree complex wavelet transform. Mechanical Systems and Signal Processing 24 (2010) 119–137.
[33] Mao, P.L.,Agarwal,R.K.,2001.Anovelapproachtotheclassification of the transient phenomena in power
transformers using combined wavelet transform and neural network. IEEE Trans Power Deliv 2001. 16: 6654-660.
[34] Sedighi, A.R., Haghifam,M.R.,2005.Detection of inrush current in distribution transformer using wavelet transform. Electric. Power Energy Syst.J.27, 361–370.
[35] Mokryani, G., Siano, P., Piccolo, A., 2010. Detection of inrush current using S-transform and competitive neural network. In: Proceedings of the 12th International Conference on Optimization of Electrical and Electronic Equipment.
[36] Morsi WG , EI- Hawary ME. The most suitable mother wavelet for steady state power system distorted waveforms. In: Proc. of IEEE Canadian conf. on Electrical and Computer Engg (CCECE 08), Niagara falls, Ontario Canada, May, 17-22, 2008.