FlashStack Converged Infrastructure Solution
Design Guide for VMware Horizon View 6.2
© 2015 Pure Storage, Inc. All rights reserved. Pure Storage, the "P" Logo, and Pure1 are trademarks or registered trademarks of Pure Storage, Inc. in the U.S. and other countries. Cisco UCS Manager, Login VSI, Microsoft Windows 7, Microsoft Windows Server 2012 R2, VMware Horizon View, vCenter,
AppVolumes, View Agent and vSphere are registered trademarks of Cisco, Microsoft, Login VSI and VMware in the U.S. and other countries. The Pure Storage product described in this documentation is distributed under a license agreement and may be used only in accordance with the terms of the agreement. The license agreement restricts its use, copying, distribution, decompilation, and reverse engineering. No part of this documentation may be reproduced in any form by any means without prior written authorization from Pure Storage, Inc. and its licensors, if any.
THE DOCUMENTATION IS PROVIDED "AS IS" AND ALL EXPRESS OR IMPLIED
CONDITIONS, REPRESENTATIONS AND WARRANTIES, INCLUDING ANY IMPLIED WARRANTY OF MERCHANTABILITY, FITNESS FOR A PARTICULAR PURPOSE, OR NON-INFRINGEMENT ARE
DISCLAIMED, EXCEPT TO THE EXTENT THAT SUCH DISCLAIMERS ARE HELD TO BE LEGALLY INVALID. PURE STORAGE SHALL NOT BE LIABLE FOR INCIDENTAL OR CONSEQUENTIAL DAMAGES IN
CONNECTION WITH THE FURNISHING, PERFORMANCE, OR USE OF THIS DOCUMENTATION. THE INFORMATION CONTAINED IN THIS DOCUMENTATION IS SUBJECT TO CHANGE WITHOUT NOTICE. Pure Storage, Inc. 650 Castro Street, Mountain View, CA 94041
Contents
Executive Summary ... 4
Goals and Objectives ... 4
Audience ... 4
Design Guide Principles ... 5
FlashStack Introduction... 6
Pure Storage Introduction ... 7
Infrastructure Components of the Design Guide ... 11
Design Guide Solutions Overview ... 19
VMware vSphere Configuration and Tuning ... 23
VMware Horizon View 6.2 Configuration and Tuning ... 26
Microsoft Windows 7 Desktop Configuration ... 29
Desktop Testing Tool – Login VSI 4.1.4 ... 31
Pure Storage FlashArray Configuration ... 33
Solution Validation ... 33
Scalability Results ... 35
Test Summary ... 61
Design Considerations and Sizing Guidelines ... 61
Summary of Findings ... 63
Conclusions ... 64
Executive Summary
Pure Storage has introduced a converged infrastructure platform known as FlashStack that is built upon trusted hardware from Cisco and Pure Storage. FlashStack leverages Cisco’s extremely flexible and expandable Unified Computing System (UCS™) to provide the compute horsepower, Cisco Nexus Switches for networking and Pure Storage FlashArray//m Series as the storage foundation. FlashStack partners can provide the guidance, services, and experience necessary to help you deploy FlashStack quickly and with confidence. FlashStack Authorized Support Partners provide a single point of contact for services and end-to-end support on the entire FlashStack converged infrastructure solution.
This document describes a reference architecture for deploying a VMware Horizon View 6.2 VDI environment on a FlashStack Converged Infrastructure using VMware vSphere 6.0, Login VSI 4.1.4 (a performance testing tool for virtualized desktop simulation), and Microsoft Windows Server 2012R2 and Microsoft Windows 7 (32-bit and 64-bit) as the guest operating systems. Pure Storage has validated the reference architecture within its lab – this document presents the hardware and software configuration, the test workload configuration, testing results and further offers implementation and sizing guidance for a mixed workload VDI population from hundreds to thousands of concurrent sessions.
Goals and Objectives
The goal of this document is to showcase the ease of deploying a large number of virtual desktops on the FlashStack Converged Infrastructure with Cisco UCS, Cisco Nexus and Pure Storage FlashArray. We will demonstrate the scalability of Horizon View-based virtual desktop building blocks with Login VSI as a performance benchmark tool running mixed workloads (Office, Knowledge and Power users) in ratios that closely align with production customer deployments. Horizon View replica-based and full machine clones of Windows 7 32-bit and 64-bit desktops will be deployed incrementally and compared in number to find the high-end scalability characterization of the FlashStack. We will demonstrate linear scalability via testing with increasing cluster sizes of one, four, eight and later two entire UCS 5108 chassis with sixteen B-200M4 servers with a particular focus and emphasis on storage. In addition, we highlight the benefits of the Pure Storage FlashArray including data reduction, low latency and resiliency testing that directly impacts the user experience and provides customers an ideal solution for any Horizon View deployment project.
Audience
The target audience for this document includes storage and virtualization administrators, consulting data center architects, field engineers, and desktop specialists who want to implement Horizon View virtual desktops on a Pure Storage FlashStack Converged Infrastructure with VMware vSphere for virtualization. A working knowledge of VMware vSphere, Horizon View, Login VSI, server, storage, networks and data center design is assumed but is not a prerequisite to read this document.
Design Guide Principles
The guiding principles for implementing this reference architecture are:
Repeatable: Create a scalable building block that can be easily replicated at any customer site. Publish the version of various firmware under test and weed out any issues in the lab before customers deploy this solution.
Virtualized: Implement every infrastructure component as a virtual machine.
Available: Create a design that is resilient and not prone to failure of a single component. For example, we include best practices to enforce multiple paths to storage, multiple NICs for
connectivity, and high availability (HA) clustering including dynamic resource scheduling (DRS) on vSphere. Additionally, we will simulate scenarios such as a VDI bootstorm while Login VSI simulations are running in parallel to highlight storage array resiliency under a production workload.
Efficient: Take advantage of inline data reduction and low latency of the Pure Storage FlashArray by pushing the envelope of VMs per server density.
Simple: Avoid unnecessary and/or complex tweaks to make the results look better than a normal out-of-box environment.
Scalable: By reporting the linear scaling of Horizon View environments within the FlashStack architecture and by incrementing the number of UCS hosts, we will show non-disruptive
operations, exceptional end-user experience, outstanding VM per host density and best-in-class flash storage performance.
FlashStack Introduction
FlashStack is a converged infrastructure solution that brings the benefits of an all-flash storage platform to your converged infrastructure deployments. Built on best of breed components from Cisco and Pure Storage, FlashStack provides a converged infrastructure solution with high performance all-flash storage that is simple, flexible, efficient, and costs less than legacy converged infrastructure solution based on traditional disk.
FlashStack CI is available from accredited FlashStack Partners who help provide an excellent converged infrastructure ownership experience. FlashStack Partners have the knowledge and experience necessary to help streamline the sizing, procurement, and delivery of your entire system. Key Benefits of the FlashStack solution are:
1. Consistent Performance and Scalability
Consistent sub-millisecond latency with 100% flash storage. Consolidate 100’s of enterprise-class applications in a single rack. Scale easily, without disruption.
Repeatable growth through multiple FlashStack CI deployments. 2. Operational Simplicity
Fully tested, validated, and documented for rapid deployment Reduced management complexity
Auto-aligned 512b architecture eliminates storage alignment headaches No storage tuning or tiers necessary
3. Lowest TCO
Dramatic savings in power, cooling and space with 100% Flash. Industry leading data reduction
Free FlashArray controller upgrades every three years with Forever Flash™ 4. Enterprise Grade Resiliency
Highly available architecture and redundant components and no single point of failure Non-disruptive operations
Upgrade and expand without downtime or performance loss Native data protection: snapshots and replication
Pure Storage Introduction
Who knew that moving to all-flash storage could help reduce the cost of IT? FlashArray//m makes server and workload investments more productive, while also lowering storage spend. With FlashArray//m,
organizations can dramatically reduce the complexity of storage to make IT more agile and efficient, accelerating your journey to the cloud.
FlashArray//m’s performance can also make your business smarter by unleashing the power of real-time analytics, driving customer loyalty, and creating new, innovative customer experiences that simply weren’t possible with disk. All by Transforming Your Storage with FlashArray//m.
FlashArray//m enables you to transform your data center, cloud, or entire business with an affordable all-flash array capable of consolidating and accelerating all your key applications.
Mini Size—Reduce power, space and complexity by 90% 3U base chassis with 15-120+ TBs usable
~1kW of power 6 cables
Mighty Performance—Transform your datacenter, cloud, or entire business Up to 300,000 32K IOPS
Up to 9 GB/s bandwidth <1ms average latency
Modular Scale—Scale FlashArray//m inside and outside of the chassis for generations Expandable to ~½ PB usable via expansion shelves
Upgrade controllers and drives to expand performance and/or capacity Meaningful Simplicity—Appliance-like deployment with worry-free operations
Plug-and-go deployment that takes minutes, not days Non-disruptive upgrades and hot-swap everything Less parts = more reliability
The FlashArray//m expands upon the FlashArray’s modular, stateless architecture, designed to enable expandability and upgradability for generations. The FlashArray//m leverages a chassis-based design with customizable modules, enabling both capacity and performance to be independently improved over time with advances in compute and flash, to meet your business’ needs today and tomorrow.
The Pure Storage FlashArray is ideal for:
Accelerating Databases and Applications Speed transactions by 10x with consistent low latency, enable online data analytics across wide datasets, and mix production, analytics, dev/test, and backup workloads without fear.
Virtualizing and Consolidating Workloads Easily accommodate the most IO-hungry Tier 1 workloads, increase consolidation rates (thereby reducing servers), simplify VI administration, and accelerate common administrative tasks.
Delivering the Ultimate Virtual Desktop Experience Support demanding users with better performance than physical desktops, scale without disruption from pilot to >1000’s of users, and experience all-flash performance for under $50/desktop.
Protecting and Recovering Vital Data Assets Provide an always-on protection for business-critical data, maintain performance even under failure conditions, and recover instantly with FlashRecover.
Pure Storage FlashArray sets the benchmark for all-flash enterprise storage arrays. It delivers:
Consistent Performance FlashArray delivers consistent <1ms average latency. Performance is optimized for the real-world applications workloads that are dominated by I/O sizes of 32K or larger vs. 4K/8K hero performance benchmarks. Full performance is maintained even under failures/updates.
Less Cost than Disk Inline de-duplication and compression deliver 5 – 10x space savings across a broad set of I/O workloads including Databases, Virtual Machines and Virtual Desktop Infrastructure. With VDI workloads data reduction is typically > 10:1.
Mission-Critical Resiliency FlashArray delivers >99.999% proven availability, as measured across the Pure Storage installed base and does so with non-disruptive everything without performance impact.
Disaster Recovery Built-In FlashArray offers native, fully-integrated, data reduction-optimized backup and disaster recovery at no additional cost. Setup disaster recovery with policy-based automation within minutes. And, recover instantly from local, space-efficient snapshots or remote replicas.
Simplicity Built-In FlashArray offers game-changing management simplicity that makes storage
installation, configuration, provisioning and migration a snap. No more managing performance, RAID, tiers or caching. Achieve optimal application performance without any tuning at any layer. Manage the
FlashArray the way you like it: Web-based GUI, CLI, VMware vCenter, Windows PowerShell, Python, REST API, or OpenStack.
Table 1: Pure Storage FlashArray//m Series
FlashArray//m Specifications
* Effective capacity assumes HA, RAID, and metadata overhead, GB-to-GiB conversion, and includes the benefit of data reduction with always-on inline deduplication, compression, and pattern removal. Average data reduction is calculated at 5-to-1, below the global average of the FlashArray user base.
** Why does Pure Storage quote 32K, not 4K IOPS? The industry commonly markets 4K IOPS, but real-world environments are dominated by IO sizes of 32K or larger. FlashArray//m adapts automatically to 512B-32KB IO for superior performance, scalability, and data reduction.
Purity Operating Environment
Purity implements advanced data reduction, storage management and flash management features, and all features of Purity are included in the base cost of the FlashArray//m.
Storage Software Built for Flash—The FlashCare technology virtualizes the entire pool of flash within the FlashArray, and allows Purity to both extend the life and ensure the maximum performance of consumer- grade MLC flash.
Granular and Adaptive—Purity Core is based upon a 512-byte variable block size metadata layer. This fine-grain metadata enables all of Purity’s data and flash management services to operate at the highest efficiency.
//m20 //m50 //m70
Capacity • Up to 120+ TBs effective capacity* • 5 – 40TBs raw capacity
(base chassis)
• Up to 250+ TBs effective capacity* • 30 – 88TBs raw capacity (w/shelves)
• Up to 400+ TBs effective capacity* • 44 – 136TBs raw capacity (w/shelves) Performance • Up to 150,000 32K IOPS** • <1ms average latency • Up to 5 GB/s bandwidth • Up to 220,000 32K IOPS** • <1ms average latency • Up to 7 GB/s bandwidth • Up to 300,000 32K IOPS** • <1ms average latency • Up to 9 GB/s bandwidth
Connectivity • 8 Gb/s Fibre Channel • 10 Gb/s Ethernet iSCSI
• Management and Replication ports
• 16 Gb/s Fibre Channel • 10 Gb/s Ethernet iSCSI
• Management and Replication ports
• 16 Gb/s Fibre Channel • 10 Gb/s Ethernet iSCSI
• Management and Replication ports
Physical • 3U
• 742 Watts (nominal draw) • 110 lbs. (49.9 kg) fully loaded • 5.12” x 18.94” x 29.72”
FlashArray//m chassis
• 3U – 7U
• 1007 - 1447 Watts (nominal draw) • 110 lbs. (49.9 kg) fully loaded + 44 lbs.
per expansion shelf • 5.12” x 18.94” x 29.72”
FlashArray//m chassis
• 5U – 11U
• 1439 – 2099 Watts (nominal draw) • 110 lbs. (49.9 kg) fully loaded + 44 lbs.
per expansion shelf • 5.12” x 18.94” x 29.72”
Best Data Reduction Available—FlashReduce implements five forms of inline and post-process data reduction to offer the most complete data reduction in the industry. Data reduction operates at a 512-byte aligned variable block size, to enable effective reduction across a wide range of mixed workloads without tuning.
Highly Available and Resilient—FlashProtect implements high availability, dual-parity RAID-3D, non- disruptive upgrades, and encryption, all of which are designed to deliver full performance to the FlashArray during any failure or maintenance event.
Backup and Disaster Recovery Built In—FlashRecover combines space-saving snapshots, replication, and protection policies into an end-to-end data protection and recovery solution that protects data against loss locally and globally. All FlashProtect services are fully-integrated in the FlashArray and leverage the native data reduction capabilities.
Pure1
Pure1 Manage—By combining local web-based management with cloud-based monitoring, Pure1 Manage allows you to manage your FlashArray wherever you are – with just a web browser.
Pure1 Connect—A rich set of APIs, plugin-is, application connectors, and automation toolkits enable you to connect FlashArray//m to all your data center and cloud monitoring, management, and orchestration tools.
Pure1 Support—FlashArray//m is constantly cloud- connected, enabling Pure Storage to deliver the most proactive support experience possible. Highly trained staff combined with big data analytics help resolve problems before they start.
Pure1 Collaborate—Extend your development and support experience online, leveraging the Pure1 Collaborate community to get peer-based support, and to share tips, tricks, and scripts.
Experience Evergreen Storage
Tired of the 3-5 year array replacement merry-go-round? The move to FlashArray//m can be your last data migration. Purchase and deploy storage once and once only – then expand capacity and performance incrementally in conjunction with your business needs and without downtime. Pure Storage’s vision for Evergreen Storage is delivered by a combination of the FlashArray’s stateless, modular architecture and the ForeverFlash business model, enabling you to extend the lifecycle of storage from 3-5 years to a decade or more.
Infrastructure Components of the Design Guide
Cisco Unified Computing System
The Cisco Unified Computing System™ (Cisco UCS) is a next-generation data center platform that unites compute,
network, storage access, and virtualization into an
organized structure aimed to reduce total cost of ownership and introduce vastly improved infrastructure deployment mechanisms at scale. UCS incorporates a unified network fabric with scalable, modular and powerful x86-architecture servers. With an innovative and proven design, Cisco UCS delivers an architecture that increases cost efficiency, agility, and flexibility beyond what traditional blade and rack-mount servers provide. Cisco makes organizations more effective by addressing the real problems that IT managers and executives face and solves them on a systemic level.
Greater Time-on-Task Efficiency
Automated configuration can change an IT organization’s
approach from reactive to proactive. The result is more time for innovation, less time spent on
maintenance, and faster response times. These efficiencies allow IT staff more time to address strategic business initiatives. They also enable better quality of life for IT staff, which means higher morale and better staff retention—both critical elements for long-term efficiency.
Cisco UCS Manager is an embedded, model-based management system that allows IT administrators to set a vast range of server configuration policies, from firmware and BIOS settings to network and storage connectivity. Individual servers can be deployed in less time and with fewer steps than in traditional environments. Automation frees staff from tedious, repetitive, time-consuming chores that are often the source of errors that cause downtime, making the entire data center more cost effective.
Easier Scaling
Automation means rapid deployment, reduced opportunity cost, and better capital resource utilization. With Cisco UCS, rack-mount and blade servers can move from the loading dock and into production in a “plug-and-play” operation. Automatically configure blade servers using predefined policies simply by inserting the devices into an open blade chassis slot. Integrate rack-mount servers by connecting them to top-of-rack Cisco Nexus® fabric extenders. Since policies make configuration automated and repeatable, configuring 100 new servers is as straightforward as configuring one server, delivering agile,
cost-effective scaling.
Virtual Blade Chassis
With a separate network and separate management for each chassis, traditional blade systems are functionally an accidental architecture based on an approach that compresses all the components of a rack into each and every chassis. Such traditional blade systems are managed with multiple management
tools that are combined to give the illusion of convergence for what is ultimately a more labor-intensive, error-prone and costly delivery methodology. Rack-mount servers are not integrated and must be managed separately or through additional tool sets, adding complexity, overhead, and the burden of more time.
Architecturally, Cisco UCS blade and rack-mount servers are joined into a single virtual blade chassis that is centrally managed yet physically distributed across multiple blade chassis, rack-mount servers, and even racks and rows. This capability is delivered through
Cisco® fabric interconnects that provide redundant connectivity, a common management and networking interface, and enhanced flexibility. This larger virtual chassis, with a single redundant point of
management, results in lower infrastructure cost per server, with fewer management touch points, and lower administration, capital, and operational costs.
Cisco Nexus 5500UP Switches
Cisco Nexus 5500UP Switches, using cut-through architecture, supports line-rate 10 Gigabit Ethernet on all ports while maintaining consistently low latency independent of packet size and services enabled. It supports a set of network technologies known collectively as Data Center Bridging (DCB) that increases the reliability, efficiency, and scalability of Ethernet networks. These features allow the switches to support multiple traffic classes over a lossless Ethernet fabric, thus enabling consolidation of LAN, SAN, and cluster environments. Its ability to connect Fibre Channel over Ethernet (FCoE) to native Fibre Channel protects existing storage system investments while dramatically simplifying in-rack cabling. The Nexus 5500UP series switch we used was a Nexus 5548UP (see Figure 2 above), which is a 1RU 10 Gigabit Ethernet, Fibre Channel, and FCoE switch offering up to 960 Gbps of throughput and up to 48 ports. The switch has 32 unified ports and one expansion slot.
VMware vSphere 6.0
VMware vSphere is the industry-leading virtualization platform for building cloud infrastructures. It
enables IT to meet SLAs (service-level agreements) for the most demanding business critical applications, at the lowest TCO (total cost of ownership). vSphere accelerates the shift to cloud computing for existing data centers and also underpins compatible public cloud offerings, forming the foundation for the
industry’s only hybrid cloud model. With the support of more than 3,000 applications from more than 2,000 ISV partners, vSphere is the trusted platform for any application.
VMware vSphere Hypervisor Architecture provides a robust, production-proven,
high-performance virtualization layer. It enables multiple virtual machines to share hardware resources with performance that can match (and in some cases exceed) native throughput.
Each vSphere Hypervisor 6.0 instance can support as many as 480 logical CPUs, 12TB of RAM, and 1024 virtual machines. By leveraging the newest hardware advances, ESXi 6.0 enables the virtualization of applications that were once thought to be non-virtualizable.
VMware ESXi™ 6.0 has dramatically increased the scalability of the platform. With vSphere Hypervisor 6.0, clusters can scale to as many as 64 hosts, up from 32 in previous releases. With 64 hosts in a cluster, vSphere 6.0 can support 8,000 virtual machines in a single cluster. This enables greater consolidation ratios, more efficient use of VMware vSphere Distributed Resource Scheduler™ (vSphere DRS), and fewer clusters that must be separately managed.
VMware vSphere Virtual Machine File System (VMFS) allows virtual machines to access shared storage devices (Fibre Channel, iSCSI, etc.) and is a key enabling technology for other vSphere components such as VMware vSphere Storage vMotion®.
VMware vSphere Storage APIs provide integration with supported third-party data protection, multipathing and storage array solutions.
VMware Horizon View 6.2
Horizon is a family of desktop and application virtualization solutions, which provide a streamlined approach to deliver, protect, and manage Windows desktops and applications to the end user so they can work anytime, anywhere, on any device. An architectural diagram is shown in Figure 3.
Key Features
Horizon 6.2 leverages desktop virtualization with View and builds on these capabilities, allowing IT to deliver virtualized and remoted desktop and applications through a single platform and supports users with access to all their Windows and online resources through one unified workspace.
Horizon 6 supports the following key functionalities:
Desktops and Applications Delivered through a SinglePlatform – Deliver virtual or remote desktops and applications through a single platform to streamline management and easily entitle end users.
Access to Data can Easily be Restricted - Sensitive data can be prevented from being copied onto a remote employee's home computer.
Unified Workspace – Securely delivers desktops, applications, and online services to end users through a unified workspace, providing a consistent user experience across devices, locations, media, and connections.
Closed Loop Management and Automation – Consolidated control, delivery and protection of user compute resources with cloud analytics and automation, cloud orchestration and self-service features.
Administration Tasks and Management Chores are Reduced - Administrators can patch and upgrade applications and operating systems without touching a user's physical PC.
Optimization with the Software-Defined Data Center – Allocates resources dynamically with virtual storage, compute, and networking to manage and deliver desktop services on demand. Central Image Management – Central image management for physical, virtual, and BYO devices. Hybrid-Cloud Flexibility – Provides an architecture built for onsite and cloud-based deployment.
VMware View Architecture and Components
This section describes the components and VMware products that interact with Horizon View. Horizon View includes seven main components:
1. View Connection Server 2. View Composer Server 3. View Agent
4. Horizon Clients
5. Horizon User Web Portal 6. View Persona Management 7. AppVolumes
View Connection Server
View Connection Server streamlines the management, provisioning, and deployment of virtual desktops. As an administrator, you can centrally manage thousands of virtual desktops from a single console. End users connect through View Connection Server to securely and easily access their personalized virtual desktops. View Connection Server acts as a broker for client connections by authenticating and directing incoming user desktop requests.
View Security Server
A View security server is an instance of View Connection Server that adds an additional layer of
security between the Internet and your internal network. Outside the corporate firewall, in the DMZ, you can install and configure View Connection Server as a View security server. Security servers in the DMZ communicate with View Connection Servers inside the corporate firewall. Security servers ensure that the only remote desktop traffic that can enter the corporate data center is traffic on behalf of a strongly authenticated user. Users can only access the desktop resources for which they are authorized.
View Composer Server
View Composer Server is an optional service that enables you to manage pools of “like” desktops, called linked-clone desktops, by creating master images that share a common virtual disk. Linked-clone desktop images are one or more copies of a parent virtual machine that share the virtual disks of the parent, but which operate as individual virtual machines. Linked-clone desktop images can optimize your use of storage space and facilitate updates. You can make changes to a single master image through the vSphere Client. These changes trigger View Composer Server to apply the updates to all cloned user desktops that are linked to that master image, without affecting users’ settings or persona data.
View Agent
The View Agent service communicates between virtual machines and Horizon Client. You must install the View Agent service on all virtual machines managed by vCenter Server so that View Connection Server can communicate with them. View Agent also provides features such as connection monitoring, virtual printing, persona management, and access to locally connected USB devices. View Agent is installed in the guest operating system.
Horizon View Clients
The Horizon View Clients are available for Windows, Mac, Ubuntu Linux, iOS, and Android to provide the connection to remote desktops from your device of choice.
By installing Horizon Client on each endpoint device, your end users can access their virtual desktops from devices such as smartphones, zero clients, thin clients, Windows PCs, Macs, and iOS- and Android-based mobile devices. Unity Touch for Horizon Clients makes it easier to run Windows apps on iPhone, iPad, and Android devices. Horizon Clients enable users to:
Connect to View Connection Server or a View security server
Edit the list of servers they connect to
Horizon Web Portal
From a web browser on a client device, end users can connect to remote desktops and applications through the browser if the HTML Access feature is enabled. With this feature, no Horizon Client application is installed on the client system or device. Users can also download the Horizon Client installer from this portal.
View Persona Management
View Persona Management is an optional component included with Horizon with View that provides persistent, dynamic user profiles across user sessions on different desktops. You can deploy pools of stateless, floating desktops and enable users to maintain their designated settings between sessions. User profile data is downloaded as needed to speed up login and logout time. New user settings are automatically sent to the user profile repository during desktop use.
App Volumes
App Volumes is an optional software component that provides real-time application delivery with lifecycle management to virtual and physical desktops. It simplifies application management by providing a single copy of an application, while keeping the data and settings specific to the desktop or user. In addition, applications perform as if they are natively installed on the OS, allowing for superior performance without compromising end-user experience.
Login VSI 4.1.4
Login VSI (www.loginvsi.com), the industry standard load testing solution for virtualized desktop
environments is a tool designed to simulate a large-scale deployment of virtualized desktop systems and study its effects on an entire virtualized infrastructure. The tool is scalable from a few virtual machines running on one VMware ESXi (or other supported hypervisor) host up to hundreds to even thousands of virtual machines distributed across a cluster of ESXi hosts. Moreover, in addition to performance
characteristics of the virtual desktops themselves, this tool also accurately shows the absolute maximum number of virtual machines that can be deployed on a given host or cluster of hosts. This is
accomplished by using ‘Launcher’ Windows machines that simulate one or more end-point devices connecting in to the target VDI cluster and execute pre-defined classes of workloads that closely mimic real-world users.
Login VSI assists in the setup and configuration of the testing infrastructure, runs a set of application operations selected to be representative of real-world user applications, and reports data on the latencies of those operations, thereby accurately modeling the expected end-user experience provided by the environment.
Login VSI consists of the following components:
Number of desktop virtual machines running on one or more UCS ESXi hosts to be exercised by the benchmarking tool and measured for performance against the selected workload.
separate cluster to simulate end-users connecting into the VDI environment.
Management Console on a Windows Server OS. Figure 4 below shows a conceptual overview of a typical Login VSI layout.
Design Guide Solutions Overview
FlashStack consists of a combined stack of hardware (storage, network and compute) and software (Cisco UCS Manager, VMware Horizon View, VMware vCenter/ESXi, and Pure Storage GUI.
Network: Cisco Nexus 5500UP and Cisco UCS Fabric Interconnect 6248UP for external and internal connectivity of IP and FC network.
Storage: Pure Storage FlashArray//m20 with Fibre Channel connectivity Compute: Cisco UCS B200 M4 Blade Servers
Figure 5: FlashStack connectivity diagram
Figure 5 shows a detailed topology of the reference architecture configuration. A major goal of the architecture is to build out a highly redundant and resilient infrastructure. Thus, we used powerful servers
with dual Fibre Channel ports connected redundantly to two SAN switches that were connected to redundant FC target ports on the FlashArray. The servers were hosted in a vSphere HA cluster and had redundant network connectivity.
Cisco UCS Server Configuration
A pair of Cisco UCS Fabric Interconnects 6248UP, and scaling up to two chassis with sixteen identical Intel CPU-based Cisco UCS B-series B200-M4 blade servers were deployed for hosting the virtual desktops. The UCS manager, UCS Fabric Interconnects and the components in the chassis were upgraded to 2.2.3f firmware level.
Each server had Cisco VIC 1340 cards and they were connected with four ports from each Cisco Fabric extender of the Cisco UCS chassis to the Cisco Fabric Interconnect, they were in turn connected to Cisco Nexus 5548UP Switch for upstream connectivity to access the Pure Storage FlashArray LUNs. The server configuration is described in Table 2.
Table 2: UCS B200-M4 server hardware configuration
Cisco UCS Service Profile configuration
In order to facilitate rapid deployment of UCS servers, a service profile template was created with the following characteristics:
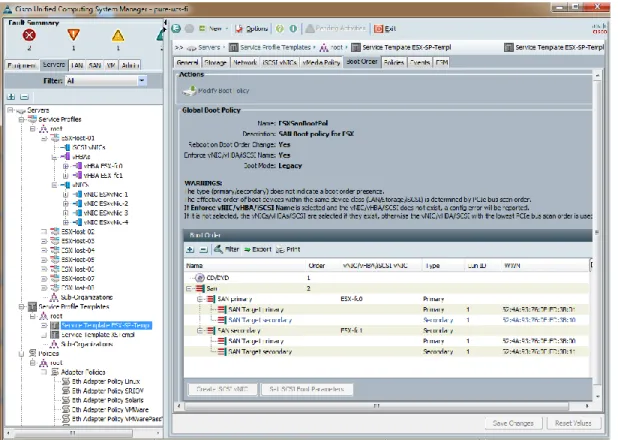
1. We configured boot from SAN policy so that the server booted from a Pure Storage boot LUN (see Figure 6 below)
2. We kept every other setting to the default, we didn’t tweak any parameters 3. The Ethernet and FC adapter policy was set to VMware policy
4. The BIOS defaults were used for the B200-M4 blade servers
5. We configured two vHBA FC adapters and four vNIC Eth adapters on the Cisco VIC cards to avoid any single point of failure.
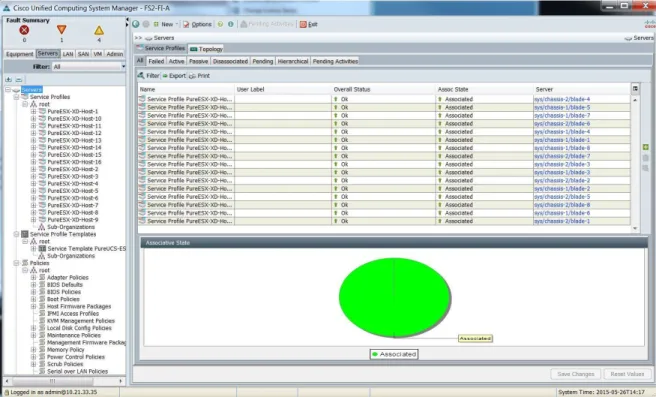
6. We deployed sixteen service profiles from the template and associated it with the blade servers in the two chassis. Figure 7 below shows the Cisco UCS manager snapshot of service profile setup for the tests.
VMware vSphere Configuration and Tuning
In this section, we discuss the ESXi 6.0 cluster configuration, network configuration and ESXi tuning for the system configuration.
ESXi Cluster and Storage Configuration
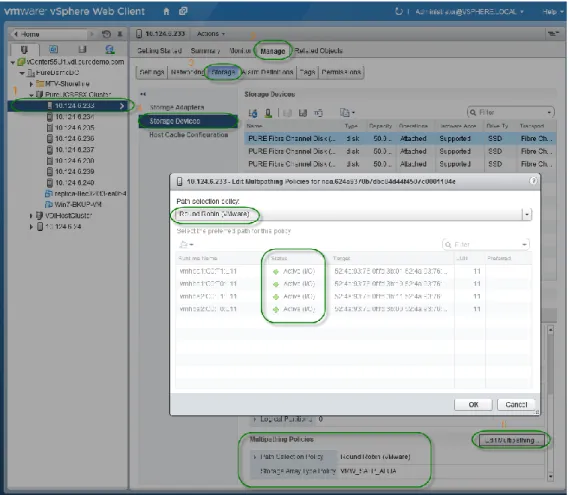
A datacenter and a cluster with up to sixteen hosts were configured with VMware High Availability (HA) clustering and Distributed Resource Scheduling (DRS) features. DRS was set to partially automated mode with power management turned off. The host EVC policy was set to Intel Haswell. The default BIOS for B200-M4 was chosen for all the service profiles. We had to create two datastore for the ESXi cluster for making the HA cluster datastore heartbeat work correctly. Note that DRS and HA were not active for our single host testing as a cluster size larger than that is required for those two features to be enabled. Due to the simplicity of both the Pure Storage FlashArray and the Cisco UCS, configuration of VMware ESXi best practice configuration is accordingly simple. ESXi uses its Native Multipathing Plugin
architecture to manage I/O multipathing to underlying SAN storage volumes. Pure Storage FlashArray volumes (while not actually an ALUA array—it indeed is active/active) volumes are claimed by default by the Storage Array Type Plugin (SATP) for ALUA devices. Therefore all devices (by default) would inherit the Most Recently Used (MRU) Path Selection Policy (PSP). This would limit I/O to a single path and would be a colossal detriment to performance, as only leveraging a single path/port to the array would remove the active/active nature and performance advantage of the FlashArray.
All the ESXi servers were configured to change the default PSP for Pure devices from MRU to Round Robin (with advanced configuration to alternate paths after every I/O). The following command was run on each ESXi server prior to the presentation of FlashArray devices:
esxcli storage nmp satp rule add -s "VMW_SATP_ALUA" -V "PURE" -M "FlashArray" -P "VMW_PSP_RR" -O "iops=1"
ESXi Network Configuration
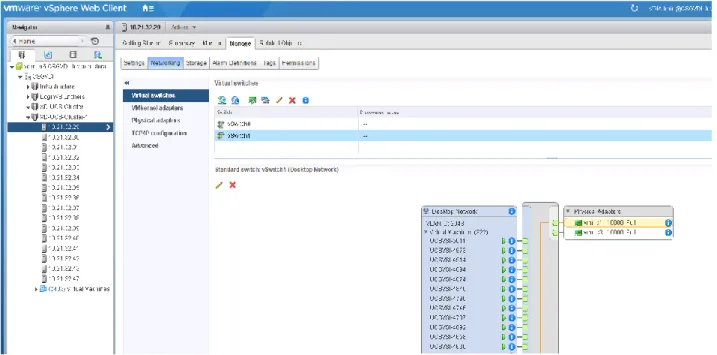
Two virtual switches each containing two vmnics were used for each host. We went with a standard vSwitch for this design. The redundant NICs were teamed in active/active mode and VLAN configurations were done on the upstream Cisco Nexus 5500 UP switches. The virtual switch configuration and
properties are shown in Figure 9 and Figure 10 on the next page.
Figure 9: ESXi server network configuration on all servers (vSwitch1 for Horizon View desktops)
VMware Horizon View 6.2 Configuration and Tuning
VMware Horizon View 6.2 configurations were quite minimal; some of the tuning is highlighted in the section.
Horizon View Connection Server Tuning
1. Use SE sparse Virtual disks format
VMware Horizon View 5.2 and above supports a vmdk disk format called Space Efficient (SE) sparse virtual disks which was introduced in vSphere 5.1. The advantages of SE sparse virtual disks can be summarized as follows:
Benefits of growing and shrinking dynamically, this prevent vmdk bloat as desktops rewrite data and delete data.
Available for View Composer based linked clone desktops (Not for persistent desktops) only VM hardware version 9 or later
No need to do refresh/recompose to reclaim space
No need to set blackout periods, as we handle UNMAPs efficiently
We recommend using this new disk format for deploying linked-clone desktops on Pure Storage due to the space efficiencies and preventing vmdk bloats. Appendix A has screen shots of how to
configure VM disk space reclaim in VMware Horizon View 6.2. 2. Disable View Storage Accelerator
The View storage accelerator, VSA, is a feature in VMware View 5.1 onwards based on VMware vSphere content based read caching (CBRC). There are several advantages of enabling VSA including containing boot storms by utilizing the host side caching of commonly used blocks. It even helps in steady state performance of desktops that use same applications. As Pure Storage
FlashArray gives you lots of IOPS at very low latency, we don’t need the extra layer of caching at the host level. The biggest disadvantage is the time it takes to recompose and refresh desktops, as every time you change the image file it has to rebuild the disk digest file. Also it consumes host side memory for caching and consume host CPU for building digest files. For shorter desktop recompose times, we recommend turning off VSA. Appendix A has screen shot which has VSA disabled in the vCenter Server storage settings.
3. Tune maximum concurrent vCenter operations
The default concurrent vCenter operations on the vCenter servers are defined in the View configuration’s advanced vCenter settings. These values are quite conservative and can be increased to higher values. Pure Storage FlashArray can withstand more operations including – Max Concurrent vCenter provisioning operation (recommended value >= 50)
Max concurrent View composer operations (recommended value >= 50)
The higher values will drastically cut down the amount of time needed to accomplish typical View Administrative tasks such as recomposing or creating a new pool.
Figure 11: Tuning maximum concurrent vCenter operations
Some caveats include:
1. These settings are global and will affect all pools. Pools on other slower disk arrays will suffer if you set these values higher, so enabling these will have adverse effects.
2. The vCenter configuration, especially number of vCPUs, amount of memory, and the backing storage has implications from these settings. In order to attain the performance levels we have described in this white paper, it is important to note the vCenter configurations and size them according to VMware’s sizing guidelines and increase them additionally if you notice a resource is becoming saturated.
VMware Horizon View 6.2 Components
VMware Connection Server 6.2 (build 3005368) was installed on two Windows Server 2012 VMs with 4 vCPU/16GB of memory each with one being the primary and the second being a replica for redundancy and load-balancing. The VMware Horizon View Composer 6.2 (build 3001314) executable was installed on a separate Windows 2012 VM with 2 vCPU/4 GB of memory for linked-clone deployment. We used the View Connection Servers to deploy all the Windows 7 desktops for Login VSI testing.
The desktop pool settings were primarily all set to default values. Some important options that we set included forcing use of the PCoIP protocol, and using the Automatic setting for 3D renderer (no nVidia GRID or other GPU offload cards were used to all 3D rendering was software-based). An example pool settings used in this design guide can be seen in Figure 12 below.
Figure 12: VMware Horizon View Windows 7 desktop pool settings
Microsoft Windows 7 Desktop Configuration
Login VSI provides guidelines for configuring the base Windows 7 image for each workload that is to be exercised in the environment. Since we wanted to mirror production customer environments as closely as possible in our testing, we elected to use Windows 7 Enterprise 32-bit for the ‘Office Worker’
workload. The low amount of RAM (1.5GB) required for that workload is below the requirements for Office 2013 on a 64-bit OS (2GB minimum) so we made the decision to use a 32-bit OS in order to prevent memory starvation and paging. For the more demanding Knowledge and Power worker Login VSI workloads, we used Windows 7 Enterprise 64-bit.
For both 32-bit and 64-bit Windows 7 desktops we ran the VMware OS Optimization Tool in order to apply all VMware best practices simply and easily to our template images. A more in-depth description of the tool and a link to download it can be found here.
Both 32-bit and 64-bit OS configurations can be seen in more detail in Table 3 and Table 4 below, respectively. The specific mixes of workloads that were used for each of these guest operating systems in our Login VSI testing will be discussed in detail in the Simulation Results section.
Table 3: Windows 7 32-bit Desktop Configuration
Desktop Testing Tool
–
Login VSI 4.1.4
Login VSI is a 3rd party tool and the industry-standard designed to simulate real-world deployments of
virtualized desktop systems and study its effects on an entire virtualized infrastructure. The tool is scalable from a few virtual machines running on one VMware vSphere host up to tens or even hundreds of thousands of virtual machines distributed across clusters of vSphere hosts.
Login VSI runs a set of operations selected to be representative of real‐world user applications, and reports data on the latencies of those operations. In our tests, we used this tool to simulate a real world scenario, and then accepted the resultant application latency as a metric to measure end user
experience.
Login VSI provides performance insights for virtualized desktop and server environments. Enterprise IT departments use Login VSI products in all phases of their virtual desktop deployment—from planning to deployment to change management—for more predictable performance, higher availability and a more consistent end user experience. The world's leading virtualization vendors use the flagship product, Login VSI, to benchmark performance. With minimal configuration, Login VSI products works in VMware
Horizon View, Citrix XenDesktop and XenApp, Microsoft Remote Desktop Services (Terminal Services) and any other Windows-based virtual desktop solution.
For more information, download a trial at www.loginvsi.com.
For this validation, we chose to use the Office, Knowledge and Power Worker workloads independently and mixed in order to more closely emulate a real-world VDI deployment. Those workloads simulate the following applications with varying degrees of intensity found in almost every environment:
Microsoft Word Microsoft Excel Microsoft PowerPoint Microsoft Outlook
Microsoft Internet Explorer Document browse
Picture album browse Adobe Reader
Archiving software Video playback software Doro PDF Writer
The simulated desktop workload is scripted in a 48 minute loop when a simulated Login VSI user is logged on, performing generic user activities. After the loop is finished it will restart automatically. Within each loop the response times of five specific operations are measured in a regular interval: twelve times in within each loop. The response times of these five operations are used to determine VSImax. VSImax is the “Virtual Session Index” that provides a useful aggregate single score that can be used to easily compare results when environment changes are being considered or different cluster configurations are tested. When the VSImax threshold is reached, that value shows the maximum number of concurrent VDI sessions that can be successfully run on a given infrastructure before some resource (e.g. RAM) becomes saturated and the end-user experience becomes degraded.
The five operations from which the response times are measured are: Notepad File Open (NFO)
Loading and initiating VSINotepad.exe and opening the open file dialog. This operation is handled by the OS and by the VSINotepad.exe itself through execution. This operation seems almost instant from an end-user’s point of view.
Notepad Start Load (NSLD)
Loading and initiating VSINotepad.exe and opening a file. This operation is also handled by the OS and by the VSINotepad.exe itself through execution. This operation seems almost instant from an end-user’s point of view.
Zip High Compression (ZHC)
This action copy's a random file and compresses it (with 7zip) with high compression enabled. The compression will very briefly spike CPU and disk IO.
Zip Low Compression (ZLC)
This action copy's a random file and compresses it (with 7zip) with low compression enabled. The compression will very briefly disk IO and creates some load on the CPU as well.
CPU
Calculates a large array of random data and spikes the CPU for a short period of time.
The specific workload virtual machine configuration, applications open in parallel and IOPs generated per VM are shown below in Table 5.
Table 5: Login VSI Workload characteristics used in this design guide
Pure Storage FlashArray Configuration
The FlashArray//m20 contains no special configurations or value changes from any normal configuration. The FlashArray contains twenty drive bays fully populated with two 256 GB SSDs each with two NVRAM devices for 10TB of raw space in total.
The UCS hosts are redundantly connected to the controllers with two FC connections to each controller from two HBAs on each host over the Fibre Channel protocol for a total of eight logical paths.
A cluster group was configured with all the ESXi hosts and a private volume was created for boot from SAN for each host. Two 50 TB LUNs were shared across the entire host group for hosting the desktops.
Solution Validation
In order to deploy and scale from tens to thousands of desktops, a proper hardware and software design, a good test plan and success criteria are required. This section talks about the test infrastructure,
hardware configuration and infrastructure VM setup we had in place for this reference architecture.
Test Setup
The Horizon View and other infrastructure components were placed on a dedicated infrastructure cluster that was completely separated from the FlashStack other than running under the same vCenter instance so that we could focus specifically on VDI performance on the FlashStack environment.
The infrastructure cluster included:
Eight dedicated infrastructure servers in an HA-enabled cluster were used to host the all of the infrastructure virtual machines:
Active directory VM, DNS VM, and DHCP VM 2 Horizon View Connection Servers
Horizon View Composer Server VMware vSphere Virtual Center server
Microsoft SQL Server for vCenter Login VSI Management Console 100 Login VSI Launcher VMs One 5.5 TB (raw) FlashArray FA-405
8 x 50GB Boot volume for the 8 infrastructure Cisco UCS blade servers 1 x 20 TB volume for the virtual server infrastructure components listed above x 20 TB volume for the Login VSI Launcher VMs
The FlashStack VDI test cluster included:
One 10 TB Pure Storage FlashArray//m20 in HA configuration, including two controllers and two 5TB data packs for 10TB raw:
2 x 50 TB volume was provisioned on Pure Storage FlashArray for the VDI desktops. 16 X 50 GB Boot volume for the sixteen Cisco UCS Blade servers
We started with one, then incrementally scaled up to 16 Cisco UCS B-series blade server based on dual socket Intel E5-2670v3 @ 2.3GHz processor with 256 GB of memory running ESXi 6.0 as the hypervisor used to host the desktops.
Test Plan and Success Criteria
The test procedure was broken up into the following segments:
1. A single ESXi host comprised of 100% Office Worker desktop testing followed by 100%
Knowledge Worker desktop testing. This was performed in order to provide scaling guidelines for those particular user types on the FlashStack Converged Infrastructure. Larger size deployments for environments that are comprised primarily or entirely of those use types can be extrapolated from the results for near linear scaling.
2. Cluster sizes of 4, 8 and 16 hosts were tested with simulations comprised of 60% Office Workers, 20% Knowledge Workers and 20% Power Workers. This ratio was arrived by researching
numerous Pure Storage customers, external customers and discussions with VDI administrators. 3. For cluster sizes of 4 and 8 hosts, once the simulation results were verified as meeting our testing
criteria, they were repeated and we executed typical VDI administrative tasks run in parallel in order to showcase the resiliency and performance of the entire infrastructure as a whole. The success criteria is as follows:
1. The VSI Average Index score must show steady-state simulation performance below the VSImax threshold amount. Additionally, ESXi host memory consumption must show no memory
2. Login VSI provides a Baseline Performance Score as listed below in addition to the VSImax value. Successful tests must fall into the ‘Good’ category of that metric in order to confirm both good end-user experience and adequate environment performance.
Table 6: Login VSI Baseline Scoring Values
3. Since almost no production VDI environment runs 100% of only one type of user, we elected to use the ‘Workload Mashup’ feature of Login VSI in order to more accurately simulate what a production environment would experience during the typical work day via showing multiple types of users running in parallel against the infrastructure. In our experience, the three workloads shown in Table 5 are most commonly seen in customer environments. Detailed descriptions of the ratio of each workload for each cluster size are included in the results section for each. 4. The backend Pure Storage FlashArray is keeping up with the I/O needs and is getting below 1
millisecond latency for over 99% of the simulation run.
Once we determined the single server scalability numbers we then scaled the number of servers from 4 to 8 servers (1 full chassis) and finally 16 servers (two full chassis). At each point we captured the ESXi server CPU/Memory/Disk utilization along with the Pure Storage FlashArray disk utilization data. Login VSI provided a detailed report on each of the test runs which would determine if our environment was
properly configured and if we were seeing linear scaling of VMs per host as expected. The Login VSI report is additionally a measurement of VDI responsiveness and overall end-user experience throughout the simulation as shown by the VSI Index Average metric.
Scalability Results
This section highlights the test results for the scalability testing starting with single server scale testing which would be used in the subsequent two, four, eight and sixteen server testing.
For each UCS cluster size, the results will be broken into two parts (with the exception of single server testing) as follows:
1. Recommended VMs per UCS Cluster Sizes of 1, 4, 8 and 16 hosts
I. The Login VSI VSImaxv4 value will not be reached in this simulation, but the VSI Baseline Performance Score and VSImaxv4 chart showing the environment’s ability to handle the recommended concurrent mixed VDI workloads will be used to confirm our recommended sizing guidelines.
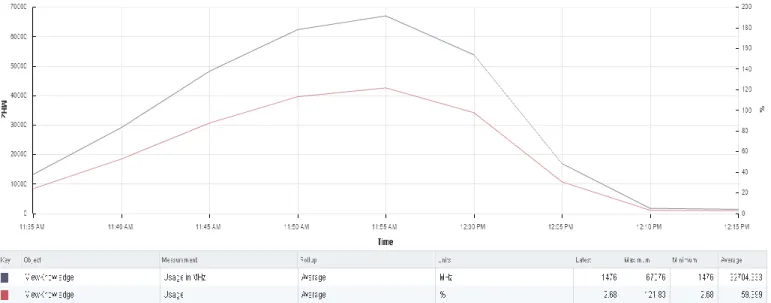
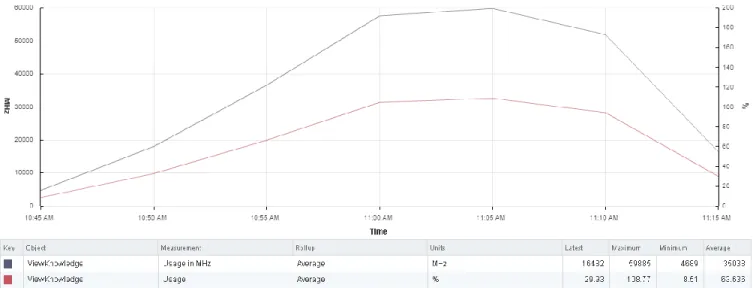
II. Charts from the ESXi cluster showing: CPU utilization, overall memory utilization (including any minimal ballooning).
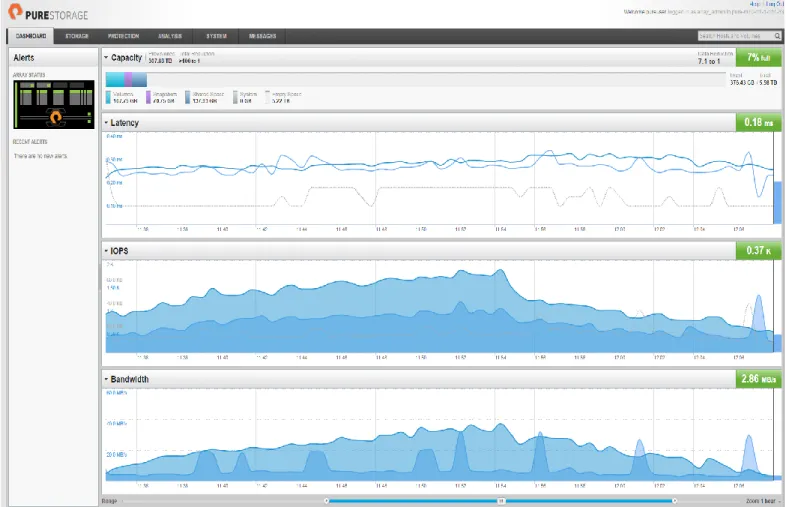
III. Pure Storage Dashboard showing the array performance during the entire simulation run including latency, IOPs, bandwidth, storage spaced used and data reduction.
2. Storage Array Resiliency Testing per UCS Cluster Size
I. For cluster sizes of 4 and 8 hosts, the same Login VSI simulation will be repeated and performance measured, but in addition to that workload one of the following common VDI administrative tasks will be performed in parallel in order to showcase the performance and resiliency of the FlashStack CI with minimal to no impact on the end-user’s
experience:
1. 4 Hosts: Bootstorm of a 500 desktop pool on a separate FlashStack cluster using the same //m20 Pure Storage array.
2.8 Hosts: Creation of a 750 VDI linked-clone desktop pool on a separate cluster using the same //m20 Pure Storage Array.
Single Server Testing
Figure 13 below describes the test setup for a single UCS server. A single Cisco UCS B200-M4 blade server is deployed and concurrent VDI sessions are executed on the single host until a recommended number of VMs for both one and two vCPUs is determined. Storage performance is also closely
monitored and captured. Using Login VSI as the workload generator we will show outstanding end-user experience while leaving some server host resource headroom for additional operations to take place.
Test Results: 125 Office Workers on a Single Server
Running the Login VSI Office Workload Benchmark on a single server cluster (note that vSphere HA and DRS were not enabled since a single host does not meet minimum requirements for those features) we were able to run 125 desktops while achieving a Login VSI baseline performance score of 1161. The resource utilization of the ESXi server and storage array is shown below as well. The below chart in Figure 14 shows a VSI Index Average well beneath the threshold level and we can also see that the FlashArray//m20 was not taxed in any regard during this simulation.
Figure 14: VSImax chart showing performance characteristics of 125 Office Workers
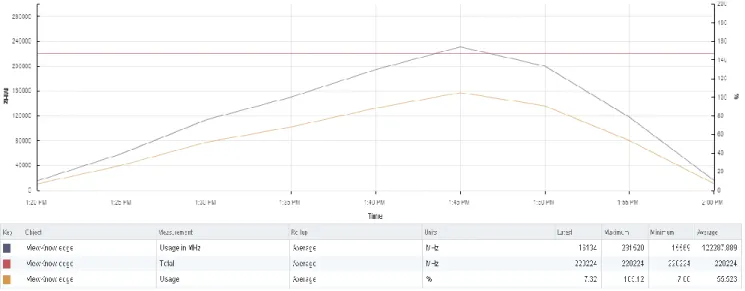
Figure 15: Single ESXi host CPU utilization during 125 Office Worker simulation
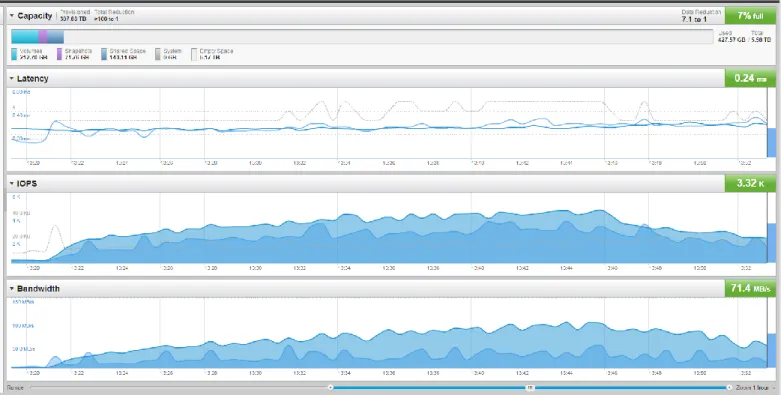
Figure 17: Pure Storage GUI during 125 Office Worker testing
Test Results: 80 Knowledge Workers on a Single Server
Running the Login VSI Knowledge Workload simulation on a single server cluster we were able to run 80 desktops on a single host while achieving a Login VSI baseline performance score of 762. This
impressive baseline performance score can be explained by the second vCPU on each desktop, the downside being that this increased performance lowers the VM density on the host. The resource utilization of the ESXi server and storage array is shown below as well. The below chart in Figure 18 shows a VSI Index Average well beneath the threshold level and we can also see that the
Figure 18: VSImax chart showing performance characteristics of 80 Knowledge Workers
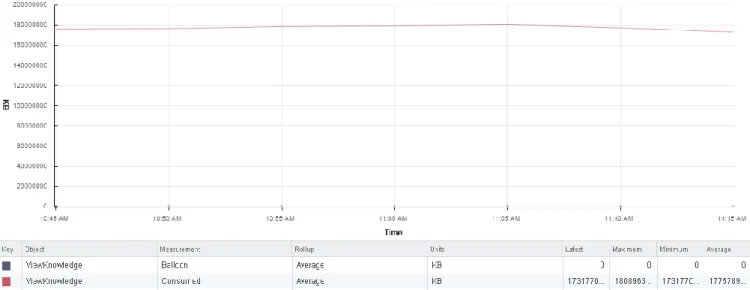
Figure 20: Single ESXi host memory utilization during 80 Knowledge Worker simulation showing no ballooning or swapping
Four Server Testing
Figure 22 below describes the setup and connectivity for our four UCS server FlashStack test. Four Cisco UCS B200-M4 blade servers were deployed in a single cluster with HA and DRS enabled. For this
simulation we introduced a mixed workload test in order to more closely mirror production customer environments. This simulation was comprised of 222 Office workers (60%), 74 Knowledge workers (20%) and 74 Power workers (20%) for a total of 370 total VDI sessions run during the simulation. Specific desktop configurations and workload profiles were discussed at length in the Windows 7 Desktop Configuration and Test Plan sections so please refer to those for more details. Login VSI, ESXi host and storage performance is closely monitored and captured. Using Login VSI as the workload generator we will show outstanding end-user experience while leaving some server host resource headroom for additional operations to take place.
After this initial simulation was verified as passing all test plan criteria, a second identical simulation was run that also features a 500 VDI desktop bootstorm on a separate 8 UCS host cluster that was attached to the same //m20 array. Storage and Login VSI performance characteristics are captured and compared to the initial run to confirm good user experience and storage performance.
Test Results: 370 Mixed VDI Workload on 4 Host Cluster
Running the Login VSI Workload Mashup test on a four server cluster we were able to run 370 desktops that consisted of Office, Knowledge and Power users while achieving a Login VSI baseline performance score of 917. VSImax v4 was not reached during this simulation and the VSI Index Average (blue line) remained below the VSImax threshold limitation throughout the run. The resource utilization of the ESXi server cluster and storage array is shown below. We can also see that the FlashArray//m was not taxed in any regard.
Figure 24: 4 ESXi cluster CPU utilization during 370 mixed workload Login VSI simulation
Figure 25: 4 ESXi cluster memory utilization during 370 mixed workload Login VSI simulation with no swapping or ballooning noted
Figure 26: Pure Storage dashboard during 370 mixed workload simulation on 4 ESXi hosts
Test Results: 370 Mixed VDI Workload on 4 Host Cluster + 500 VDI Desktop
Bootstorm
We repeated the 370 mixed workload simulation and also introduced a 500 concurrent VDI desktop bootstorm on a separate UCS cluster attached to the same //m20 array at the same time in order to highlight that multiple VDI workloads can be run on the array during normal business hours with no impact to users who are actively using their virtual desktop. We executed the bootstorm when approximately 330 out of the 370 total users were logged in with active sessions and additional users were also logging in to the environment. As the below charts clearly show, the FlashStack Converged Infrastructure provides the high-level of robustness and execution that will allow VDI administrators to accomplish more in less time during normal business hours without impacting their VDI users. The VSImax v4 chart illustrates that no noticeable user impact was introduced when the bootstorm was performed and the 500 VDI desktops all were online and booted up within 2 minutes. In Figure 28 we overlaid the VSImax performance chart from this simulation with the original 370 mixed workload simulation to show near identical user experience throughout. The small differences shown would be imperceptible to the end-user.
Figure 27: VSImax performance chart during 370 mixed workload test + 500 desktop bootstorm
Figure 28: 370 mixed workload (purple line) and 370 mixed workload + 500 desktop bootstorm (blue line) VSImax performance charts overlaid showing near identical performance characteristics
Figure 30: Detailed view of 500 VDI pool bootstorm during 370 mixed workload simulation. Latency peaked at 0.75 ms and all 500 desktops were successfully booted in under 2 minutes
Eight Server (One Chassis) Testing
Figure 31 below describes the setup and connectivity for our eight UCS server FlashStack test. Eight Cisco UCS B200-M4 blade servers were deployed in a single cluster with HA and DRS enabled. For this simulation we again used a mixed workload test in order to more closely mirror production customer environments. This simulation was comprised of a total of 750 workers broken down as follows: 450 Office workers (60%), 225 Knowledge workers (20%) and 225 Power workers (20%). Specific desktop configurations and workload profiles for each were discussed at length in the Windows 7 Desktop Configuration and Test Plan sections so please refer to those sections for more details. Login VSI, ESXi host and storage performance is closely monitored and captured. Using Login VSI as the workload generator we will show outstanding end-user experience while leaving some server host resource headroom for additional operations to take place.
After this initial simulation was verified as passing all test plan criteria, a second simulation was run that also features a 750 VDI desktop pool being created on a separate 8 UCS B200-M4 host cluster that wasattached to the same //m20 array. Storage and Login VSI performance characteristics are captured and compared to the initial run to confirm good user experience and storage performance.
Test Results: 750 Mixed VDI Workload on 8 Host Cluster
Running the Login VSI Workload Mashup test on an eight server cluster we were able to run 750 desktops that consisted of Office, Knowledge and Power users (in a ratio of 60%, 20% and 20%,
respectively) while achieving a Login VSI baseline performance score of 973. VSImax v4 was not reached during this simulation and the VSImax average score (blue line) remained below the VSImax threshold limitation throughout the run, which is indicative of a good end-user experience throughout. The
resource utilization of the ESXi server cluster and storage array is shown below. We can also see that the FlashArray //m20 was not taxed in any regard.
Figure 33: 8 host ESXi cluster showing CPU utilization for 750 mixed workload simulation
Figure 34: 8 host ESXi cluster showing memory utilization for 750 mixed workload simulation. No swapping or ballooning is noted
Figure 35: Pure Storage dashboard during 750 mixed workload simulation
Test Results: 750 Mixed VDI Workload on 8 Host Cluster + 750 VDI Pool Creation
We repeated the 750 mixed workload simulation and also introduced a 750 VDI desktop pool creation while the simulation was running on a separate cluster attached to the same //m20 array in order to highlight that multiple VDI workloads and tasks can be run in parallel without issue. As the below charts prove, the FlashStack Converged Infrastructure provides the high-level of robustness and execution that will allow VDI administrators to accomplish much more in less time during normal business hours without impacting their VDI users who are actively using the environment. This operation would be especially likely and necessary as shown in the previous simulation as the single chassis is nearing resource saturation at the peak of the simulation and additional hosts need to be added for continued VDI expansion. The 750 linked-clone pool was created in approximately 34 minutes with all 750 desktops being listed in an available state and powered on within that timeframe.
Figure 37: VSImax overlay chart showing near identical performance characteristics between 750 mixed workload simulation (purple line) and 750 mixed workload simulation + 750 VDI pool creation (blue line)
Figure 38: Pure Storage dashboard showing array performance during 750 Login VSI mixed workload simulation and 750 VDI desktop pool creation occuring in parallel
Sixteen Server (Two Chassis) Testing
Figure 39 below describes the setup and connectivity for our sixteen UCS server FlashStack test. Sixteen Cisco UCS B200-M4 blade servers were deployed in a two separate clusters with HA and DRS enabled on each. Nine hosts were deployed in the Office Worker cluster while seven were used in the
Knowledge and Power Worker cluster. There is no reason that all sixteen hosts and workloads could not be included in a single cluster but we elected to split them up in order to show utilization at a more granular level. This simulation had a total of 1500 workers broken down as follows: 900 Office workers (60%), 300 Knowledge workers (20%) and 300 Power workers (20%). Specific desktop configurations and workload profiles for each were discussed at length in the Windows 7 Desktop Configuration and Test Plan sections so please refer to those sections for more details. Login VSI, ESXi host and storage performance is closely monitored and captured. Using Login VSI as the workload generator we will show outstanding end-user experience while leaving some server host resource headroom for additional operations to take place such as bootstorm and recompose operations.
Figure 39: 16 ESXi Host equipment and connectivity diagram
Test Results: 1500 Mixed VDI Workload on 16 Host Clusters
Running the Login VSI Workload Mashup test on an eight server cluster we were able to run 1500 desktops that consisted of Office, Knowledge and Power users (in a ratio of 60%, 20% and 20%,
respectively) while achieving a Login VSI baseline performance score of 973. VSImax v4 was not reached during this simulation and the VSImax average score (blue line) remained below the VSImax threshold limitation throughout the run, which is indicative of a good end-user experience throughout. As we elected to split our environment into two clusters, ESXi cluster utilization will be shown for both Office and Knowledge Workers. We can also see that the FlashArray//m20 was not taxed in any regard.
Furthermore, in Figure 45 we can see that we achieved an overall data reduction rate of 33.1 to 1 for 1500 desktops in two separate pools and that the array was only 13% full. This proves there is still ample room for this array to host even more desktops provided additional UCS chassis are added to the environment.
Figure 40: VSImax performance chart for 1500 user mixed workload simulation
Figure 41: 7 host ESXi cluster CPU utilization for 300 Knowledge Workers and 300 Power Workers during 1500 user mixed workload test
Figure 42: 7 host ESXi cluster memory utilization for 300 Knowledge Workers and 300 Power Workers during 1500 user mixed workload test. No swapping or ballooning was detected
Figure 44: 9 host ESXi cluster memory utilization for 900 Office Workers during 1500 user mixed workload test