ORIGINAL RESEARCH ARTICLE
CONVERTING KIRANA STORE INTO ORGANIZED STORE
*Jigar Chhadwa, Madhav Mahajan, Yash Khatavkar, Zulfa Shan, Aayushi Singh
and Bahaar Marwah
Symbiosis Centre for Management Studies, Pune, India
ARTICLE INFO ABSTRACT
The study has been conducted in Viman Nagar, Pune in order to analyze the Kirana stores and the problems they are facing presently which is restricting them to convert into the organized stores. The study also covers the aspect that how developed the Kirana stores are in Viman Nagar. The study has been conducted by considering the no. of employees, sex ratio of the employees, nearness of the stores to each other, no. of days, the inventory is stocked for, type of inventory stock, channel of procurement, use of technology, satisfaction level of the Kirana store owners by the incentives given by the companies they buy goods of, payment mode of purchasing the product, credit period offered by the companies, the reason for not upgrading the stores and the mode that the Kirana stores would choose to upgrade their store. An analysis has been drawn accompanied by some suggestions for the Kirana Stores.
Copyright © 2018,Pooja Srivastava and Dr. Aftab Alam. This is an open access article distributed under the Creative Commons Attribution License, which permits unrestricted use, distribution, and reproduction in any medium, provided the original work is properly cited.
INTRODUCTION
Retailing is an essential element of the Indian GDP accounting for 14 to 15 percent of the Indian GDP is divided into organized and unorganized sector. (R.H) The unorganized sector contributes to 95 percent of the total retail revenues. (Shodhganga) The small stores with limited goods are popular as Kirana stores or the mop-and-pop-stores. (R.H) The Kirana stores in the unorganized sector form the integral part of the trade industry in the country and are able to manage their business and run a profitable venture without any external support and funding. (Maheshwari, 2016). The retail stores which are owned by some franchise or even a single store which exceeds some basic points are referred to as the Organized stores. (Reurbanist, 2012). Kirana stores have an advantage of selling loose items, giving credit facilities to the consumers and even providing free home delivery but the organized sector is taking an upper hand on the unorganized retail sector since people believe more in the quality of the fruits and vegetables they buy from super markets. (Chandramana, 2016).
*Corresponding author:Jigar Chhadwa,
Symbiosis Centre for Management Studies, Pune, India
The research study has been carried out in order to understand the prevailing condition of the Kirana Stores in the Viman Nagar, Pune and some parameters are put in the study which gives an impression of how these retail stores can be converted into the organized stores.
Research Methodology
The research has been carried out though a close ended questionnaire filled by the Kirana Store owners.
The questionnaire consisted of 15 questions which have been used to analyze the Kirana stores.
Practical Approach
The paper shall help people understand the status if unorganized sector Kirana stores and how can they convert into the organized sectors, the paper also explains the problems, Kirana stores face to shift to an organized sector. The data has been obtained after surveying and understand the Kirana Stores in the Viman Nagar, Pune.
Problem Statement
The paper discusses the problems of the unorganized sector stores and the stiff competition they are facing from the super
ISSN: 2230-9926
International Journal of Development Research
Vol. 08, Issue, 04, pp.19977-19984, April,2018
Article History:
Received 22th January, 2018
Received in revised form 04th February, 2018
Accepted 09th March, 2018
Published online 30th April, 2018
Key Words:
Kirana Stores, Organized, Inventory, Retail, Pune.
Citation: Jigar Chhadwa, Madhav Mahajan, Yash Khatavkar, Zulfa Shan, Aayushi Singh and Bahaar Marwah. 2018. “Converting kirana store into
organized store”, International Journal of Development Research, 8, (04), 19977-19984.
markets. The store owners are not aware about the ways of implementing ways by which they can convert themselves into an organized store and compete with the supermarkets.
Objective
The objective of the paper is to analyze the problems of the unorganized Kirana stores.
The objective of the paper is to suggest ways, the Kirana stores can convert into an organized sector and compete with other organized stores and supermarkets.
Limitations
The sample size is 22 stores only.
The study deals with the Viman Nagar in Pune.
Sample Details
22 responses have been recorder of the local unorganized Kirana store owners in Viman Nagar in Pune.
DISCUSSION
The data has been collected from 23 respondents, who own a Kirana store in Viman Nagar, Pune in order to analyze the problems being faced by the Kirana store owners and the various parameters required for upgrading to an organized sector store. A general profiling of the store owners was covered in the research including their name, age and year of establishment of the store. Some specific questions included the no. of female and male workers in the store, location and size of the store, stock selection, duration of keeping the stock, use of technology, the incentives given by the companies and the type of incentives offered, discount given to the customers, the reason for not upgrading to the Kirana store and the way, they would choose to upgrade to an organized store.
Analysis
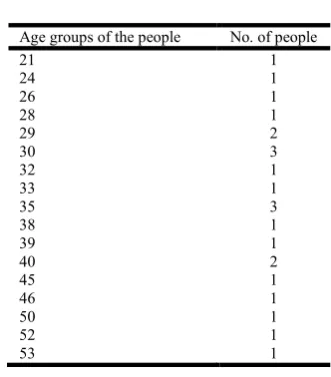
[image:2.595.77.243.551.740.2] Age group of the owners of retail shops
Table 1.
Age groups of the people No. of people
21 1
24 1
26 1
28 1
29 2
30 3
32 1
33 1
35 3
38 1
39 1
40 2
45 1
46 1
50 1
52 1
53 1
Mean
Mean for various age groups = 35.68182
Mean indicates the average age group of the people who are currently working as the owner of various Kirana stores. Since,
the value is quite legitimate, the average number of people who are running these Kirana stores are majorly young people.
Median
Median value for age groups = 34
This indicates the most central value of the age groups.
Mode
Mode for the various age groups = 30
Mode of the age groups is 30, which means that the value which is most likely to be sampled is 30, thus the people of 30 years of age are most likely to be the owners of Kirana stores.
Kurtosis
Kurtosis value for age groups = -0.61287
Skewness
Skewness value for various age groups = 0.507958
Kurtosis and skewness
In statistics, kurtosis is a measure of the "tailedness" of the probability distribution of areal-valued random variable. In a similar way to the concept of skewness, kurtosis is a descriptor of the shape of a probability distribution and, just as for skewness; there are different ways of quantifying it for a theoretical distribution and corresponding ways of estimating it from a sample from a population.
Formula for kurtosis is
Kurtosis for age group = -0.61287
This means the age group of the owners of Kirana stores has a flatter distribution as the value is negative.
Skewness for age group is 0.507958
This means the age group is moderately skewed i.e. moderately symmetrical. Age groups are majorly even, very less variation exists.
Gender of the owners of Kirana stores:
Table 2.
Gender No. of workers Females 03
Males 19
The table significantly indicate that the males are more incline towards running a Kirana stores or we can say that the males have dominated the Kirana store business over females in India.
Marital Status:
Table 3.
The table clearly indicates that most of the owners of Kirana stores are married. Average 78% of the owners of Kirana stores are married.
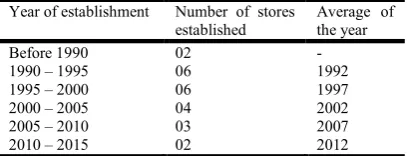
[image:3.595.61.265.146.224.2]Year of Establishment of the stores
Table 4.
Year of establishment Number of stores established
Average of the year
Before 1990 02 -
1990 – 1995 06 1992
1995 – 2000 06 1997
2000 – 2005 04 2002
2005 – 2010 03 2007
2010 – 2015 02 2012
The table clearly shows the percentages of the number of stores that were established in particular years. As per our analysis maximum numbers of the stores was established during 1990 – 1995 and 1995 – 2000 which is 26 %.
Number of employees working in your store
Table 5.
No. of employees Number of stores Average number of employees
1-5 17 03
6-10 04 08
11-15 01 15
Above 15 00 00
The above analysis screens that there are 17% of the total analysed stores who possess average of 3 employees , 18% of those who possess average of 8 employees and 13% of those who have average of 13 employees and further none of the Kirana stores have 15 or above workers in their stores.
The Kirana stores are underdeveloped , as major
number of stores possess very less number of employees and same can be considered as the part of disadvantage and the reason for being still developing store. It is very important to note that if the number of employees are increased in a store there can be a scope for further development but at the same time consideration should also be given to the fact that to increase employees one needs to take the store to a higher reach.
Number of male workers in your store
Table 6.
No. of male workers Number of Kirana stores in favour of male workers
None 01
1-3 19
4-7 02
Above 8 00
The above data indicates that the major percentage of the Kirana stores is occupied by masculine gender. There is only 5% of the total sample that that has no male employee but there is still a major percentage (86%) that is occupied by almost 1 – 3 male employees in store. Here, we may state that the male workforce in the Kirana store is sufficient as per the size and the revenue and other considerable things of the store.
Number of female workers in your store
Table 7.
No. of female workers Number of Kirana stores in favour of female workers
None 19
1-3 02
4-7 01
Above 8 00
The data indicates that around 86% of the stores do not
prefer female employees. But still 9% of the sample has around 1 to 3 female workers.
The fact that female workers are mostly not promoted in retail shops is because of the actuality that Indian society still does not allow feminine gender to grow in an open vent. But still 14%of the retail shops have female workers working.
Location of the store
Table 8.
Location of the store No. of Stores
Main Road 09
Near Public Place 08 First corner of the street 01
Others 04
The main purpose of this question was to know how the
location of the stores effects their development.
The above information defines that there are 36% of the
stores that are located in public places and are receiving good footfall on the regular basis while as those on the corner 5% are receiving pretty less attention of the consumers.
Even the retail shops that are on the main road, around
41% of the sample receive good footfall of the customers.
Size of the Store
Table 9.
Size of the store No. of Stores 0 - 200 sq. ft. 02
200 – 400 sq. ft. 04 400-600 sq. ft. 09 600-800 sq. ft. 03 More than 800 sq. ft. 04
The motive of this question was to determine whether the area occupied by the stores affect the development of the store.
So the conclusion made by the sample survey done is that the stores having less space i.e. 14% and 18% have less variety of things comparatively. But those with more space i.e. 41% of the total sample, have more variety of the products hence having better perspective of attracting customers than those with less area. It also promotes a psychological factor that people
Items which are stored for inventory and the no. of days they are kept
Table 10.
Stock No. of days
0-4 4-7 7-14 14-30 TOTAL
Vegetables 19 02 00 00 22
Food Items 00 06 09 07 22
Non-Food Items 00 00 02 20 22
Others 00 00 00 22 22
This question was added to analyse whether the stock inventory has any impact on the development of the stores or not.
The analysis clearly indicates that the maximum no of stores 19 out of 22 store the vegetables and all such regular edible items for very less time , so as to serve it fresh, hence this attracts more and more customers toward them, therefore this factor is positively in favour of Kirana stores. Hence they should encourage this factor.
Moreover, again the consumer behaviour comes in the picture. To maintain the standard of their living they would prefer the retail shop, to buy same vegetables and regular edible things.
[image:4.595.36.289.384.446.2]Procurement of Goods
Table 11.
Never Sometimes Often Very Often Always
Distributors 0 0 0 11 0
Wholesalers 0 0 05 0 0
Sales person 0 0 0 0 0
Personal Visits 0 0 0 03 0
Others 0 03 0 0 0
The purpose of this question was to know how the purchase of the Kirana stores from various means determine their development.
The conclusion of the analysis, as depicted by the sample, says that most of the Kirana stores rely upon distributors for their purchase but there are also few who depend upon wholesalers and other personal visits. This means that the stores development depend upon the kind of goods they are being served by their distributors, wholesalers, and other sources.
If they want to completely satisfy their consumers, they have to be very careful about the goods they are selling.
Hence, procurement has to play a major role in
development of the Kirana store, as by selling better quality products they can enhance their sale easily.
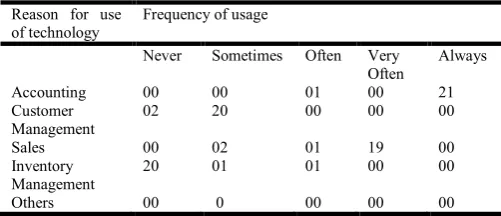
[image:4.595.305.560.420.490.2]Reason for the use of technology
Table 12.
Reason for use of technology
Frequency of usage
Never Sometimes Often Very Often
Always
Accounting 00 00 01 00 21
Customer Management
02 20 00 00 00
Sales 00 02 01 19 00
Inventory Management
20 01 01 00 00
Others 00 0 00 00 00
The purpose of this question was to know the impact of
technology used by the Kirana stores on their development.
As the analysis of the question indicates that most of the Kirana stores use technology mostly for accounting purpose only and very less technology is used by the Kirana stores on other requirements.
These Kirana stores need to improve their technology to
modify their current systems for sale, customer management and other purposes to serve their customers better and hence to develop their stores.
Satisfaction level by the incentives given by the companies
Table 13.
Completely Dissatisfied
Dissatisfied Neutral Satisfied Highly Satisfied
00 02 09 11 00
The purpose of this question was simply to know how satisfied are the Kirana stores with the service they are provided by the companies.
The answers evidently say that the satisfaction level is moderate and most of the Kirana stores 55% are satisfied with their companies.
Types of incentives offered by the companies and its frequency
Table 14
Types of incentives Frequency of incentives
Never Sometimes Often Very Often
Always
Quantity Discount 02 02 18 0 00
Freebie 08 05 01 02 00
Gifts & voucher 01 01 3 17 00
Others 00 00 04 02 00
The purpose of this question was to get acknowledged about how frequently the companies provide offers to their customers and what is the impact of the same on the consumers.
As a result of the analysis the companies do provide discounts, gift vouchers and other incentives to attract customers often. It is an effective way to grab attention from the consumers as well as it is beneficial for enhancement of Kirana stores as the more and more employees come to the store ,more efficiently it works.
[image:4.595.369.495.673.706.2]Payment mode on which you are purchasing your products
Table 15.
Cash Credit Both
Yes 0 0 22
No 0 0 0
The purpose of this question was to know about
[image:4.595.36.287.689.797.2]Credit period offered by the companies to the Kirana Stores
The purpose of this question was to check the
convenience provided by the companies to the Kirana stores.
As the data above indicates, the period of 15 days is provided to almost 73% of the total sample to pay their credit money, which is a sufficient time, and others are provided more as well.
Hence, we may conclude by acknowledging that there is no deficiency from the company side as far as convenience of the stores is concerned.
Reasons for not upgrading to an organised store
The above question was put forward to analyse various
factors responsible for not allowing Kirana stores to upgrade to large departmental stores.
As the figures above provide the clear reasons as specified by various owners of the Kirana stores. As perspectives and way of life is different for different people, similarly, depending upon the same, the reasons vary.
Suggestion that could be made on looking at the above
figures is that, there should be fund provision, there should be availability of goods at cheaper rate, at least for early developers, there should be risk taking capability among the people who want to develop.
Decision to be made to convert into an organised store and the way to convert
The above question was asked to analyse the ways and methods that these Kirana general stores want to use to become a well-established departmental store.
Conclusion
The research was conducted by taking a small sample of 22 stores in total from Pune. The research done gave us various conclusions which are given on the basis of analysis done for each question, under the same. Each and every question had its own importance and the analysis and result of the same were familiar for some and at the same time were astonishing. The figures seem to be really small but the data is worth full. The research proves that most of the Kirana Stores are male dominated and they are controlled by married people. Most of the stores have come up in the year 1990-2000, the reason for this could be the economy was moving towards growth. It was seen that there is very less involvement of female members. In retail, the store location plays an extremely important role thus most of the stores were located near public spaces receiving a huge footfall. There is a direct proportion of store size & sales in retail business, kirana owners think if they have a bigger store they can do more business. The procurement can be improved by just not depending upon the distributor but also finding alternative suppliers who can provide the same product at a cheaper rate. Technology is used just for two key purposes to manage accounts and sales but it should be used for inventory management and preparing a weekly requirement for purchase etc. It was noticed that most of the retailers were satisfied with the incentives given by the companies. To upgrade the stores into organised stores a cheaper method of financing has to be found and in the coming years managing human resource at the entry level is going to be difficult, thus a sustainable model has to be developed were less man power shall be required.
REFFERENCE
Chandramana, S. 2016. Impact of Organised Retail on Unorganised Retail in India - The Changing Perspective in
Table 16.
0-15 Days 15-30 Days 30-45 Days
Yes 16 4 2
No 00 00 00
Table 17.
Reasons Level of Acceptance
Completely Disagree Disagree Can’t Say Agree Completely Agree
Lack of knowledge 22 00 00 00 00
Financial Problem 01 03 04 00 14
No successor 19 02 01 00 00
Massive Overhead expenditure 00 00 01 03 18
Competitors 00 08 05 07 02
Warehousing & Transportation 06 05 03 04 02
License Problem 04 08 00 08 02
Lack of Human resource 00 02 05 03 12
Not ready to take the risk 03 12 05 02 00
Due to less sustainability of the products 00 04 04 06 08
Lack of customers 17 00 00 02 01
Goods not available at a cheaper rate 02 07 00 00 13
[image:5.595.91.516.63.300.2]Others 00 00 00 00 00
Table 18.
Way of converting Decision Yes No Become a franchise of a super store 16 16 Take a loan from a bank 2 20 Take Loans from relatives 16 06 Invest your own resources to upgrade 18 04
Rural Areas. National level Seminar on Renewable Energy Technologies for Sustainable Development in Rural
Sectors of India. Research Gate
Maheshwari, M. (2016, December 19). An ode to the
‘Unorganized’ Retailer. Retrieved from Economic Times:
https://retail.economictimes.indiatimes.com/news/industry/ an-ode-to-the-unorganized-retailer/56064312
R.H, R. (n.d.). AN OVERVIEW OF UNORGANIZED
RETAIL SECTOR IN INDIA. Elk Journals.
Reurbanist. (2012, August 22). Unorganized and Organized
Retail: A Global Comparison. Retrieved from Reurbanist:
http://reurbanist.com/2012/08/unorganized-and-organized-retail-a-global-comparison/
Shodhganga. (n.d.). Unorganized Retailing. Shodhganga.
Retrieved from http://shodhganga.inflibnet.ac.in/
bitstream/10603/36343/11/11_chapter%202.pdf
Appendix
Questionnaire
Profile based questions:
Name: ______________________________________
Age: ______________________________________
Gender: ______________________________________
Place: ______________________________________
Marital status:
a. Married
b. Unmarried
1. In which year was your stored established :
A. Before 1990
B. 1990-1995
C. 1995-2000
D. 2000-2005
E. 2005-2010
F. 2010-2015
2. Number of employees working in your store :
A. 1 – 5
B. 6 – 10
C. 11 - 15
D. Above 15
3. Number of male workers in your store :
A. None
B. 1 – 3
C. 4 – 7
D. Above 8
4. Number of female workers in your store :
A. None
B. 1 – 3
C. 4 – 7
D. Above 8
5. Location of your store :
A. Main road
B. Near to a public place
C. First corner of the street
D. Others
6. Your store size:
4. You stock your inventory for:
NO.OF .DAYS 0-4 4-7 7-14 14-30 Vegetables
Food Items Non-Food Items Others
5. You procure/source your goods from:
Never Sometimes Often Very Often Always Distributors
Wholesalers Sales person Personal Visits Others
6. You use technology for:
Never Sometimes Often Very Often Always Accounting
Customer Management Sales
Inventory Management Others
7. You are satisfied by the incentives given to you by the company:
Completely Dissatisfied Dissatisfied Neutral Satisfied Highly Satisfied
8. You are offered the following incentives from the company:
Never Sometimes Often Very Often Always Quantity Discount
Frebie Gifts & voucher Others
9. Payment mode on which you are purchasing your products:
Cash Credit Both Yes
No
10.You are offered the following credit period by the companies :
0-15 Days 15-30 Days 30-45 Days Yes
No
11.You offer discounts to your customers or give them all the services :
Completely disagree Disagree Can’t say Agree Completely agree Discount on monthly bills
12.You have not Upgraded to an organised store due to the following reasons:
Completely Disagree Disagree Can’t Say Agree Completely Agree Lack of knowledge
Financial Problem No successor
Massive Overhead expenditure Competitors
Warehousing & Transportation License Problem
Lack of Human resource Not ready to take the risk
Due to less sustainability of the products Lack of customers
Goods not available at a cheaper rate Others
15. You would choose the following to upgrade your store:
Yes No
Become a franchise of a super store Take a loan from a bank
Take Loans from relatives Invest your own resources to upgrade Others