969
STATISTICAL ANALYSIS OF SENSED DATA OF
ENVIRONMENTAL CHANGES USING WIRELESS SENSOR
NETWORKS
1OMAR FOUAD MOHAMMED, 2BURAIRAH HUSSIN AND 3ABD SAMAD HASAN BASARI
1, 2, 3
Faculty of information and communication technology Universiti Teknikal Malaysia Melaka (UTeM) Hang Tuah Jaya, 76100 Durian Tunggal, Melaka, Malaysia
E-mail:[email protected], [email protected], [email protected]
ABSTRACT
The wide potentials of Wireless Sensor Networks (WSNs) technology make it the best solution for sensing the surrounding environment and to monitor physical and phenomenal conditions. Indoor environmental monitoring is well-known application of WSN. Most of the systems proposed in literature are concerned with the detection and tracking of an object or an event in two-dimensional plane. This paper presents a statistical analysis of the aggregated sensed data that reporting about a dynamic event happened in an indoor environment. It helps to infer the development of the dynamic event in three-dimensional space. It is important to know the size of the area where a dynamic event, such as fire or gas leak, has occurred in order to take proper safety measures and prevent undesirable consequences. The results of the analysis are validated through simulation experiments, which in turn, verify the theoretical concept presented in this paper.
Keywords: Wireless Sensor Networks (WSN), Environmental Phenomenon Monitoring, Event
Detection, Event Tracking, Aggregated Data Analysis.
1. INTRODUCTION
Wireless Sensor Networks (WSNs) is formed of sensors networked together for sensing the surrounding environment and providing an appropriate description of an event of interest. To achieve this, sensed data is collected by a cluster head, sink(s), or base station and send to a distant user according to the communication paradigm in use (whether directly or many-to-one) [1] [2]. There are three main application areas for WSN: military surveillance, healthcare monitoring, and environmental monitoring. Therefore, there are various applications as shown in Figure 1 for habitat monitoring, target tracking, security surveillance, terror-alert systems, hazard and disaster monitoring, and relief operations.
Among the wide potential applications of WSN technology, indoor environmental monitoring (smart buildings) is very common and well-known one [3]. An indoor fully-connected WSN is deployed to measure sensitive parameters (such as temperature, light, vibration, noise, radiation, and air pollution) inside a closed space (like building) and to collaboratively send the readings to a controller for further processing [4] [5]. In such indoor environment, WSN is expected to collect,
transfer of the collected raw sensed data, and react with proper control actions.
Figure1:Common WSN applications with respect to sensor type, scale, and density
970 decision. Also, for routing the sensed data in the corresponding controller, a hybrid of continuous and event driven routing procedure is needed. Since in the environmental condition monitoring the use of temperature sensors is not relevant for the tracking application, the controller is responsible of tracking the event and determining the affected area based on the received sensed data.
2. RELATED WORK
Several data stream management systems were proposed in literature aiming to deal with continuous real-time data to have a clear and obvious image of an event taking place [8] [9]. Abadi et al. [7] showed how TinyDB (which is a WSN distributed query processor) samples the real world phenomena besides filtering, sharing, and combining the readings to offer useful knowledge. Kira et al. [6] have developed Spatial, Temporal, Algorithm, and Cognition (STAC) model which can describe the raw data received from several sensors via increasing abstraction levels. STAC also gives clear description of how data are combined to understand the scene comprehensively. Zhou et al. [2] have proposed a WSN strategy for monitoring the temperature distribution in a large-scale indoor space, with the aim of enhancing the quality of the measurements transmitted by wireless signals and classifying the temperature distribution pattern of the space. In regard to region event tracking, Subramaniam et al. [10] had proposed a statistical method based on kernel density estimator for detecting and tracking generic homogeneous regions without considering a priori predicate to classify the events. Fisher et al. [11] proposed a system for gathering and analyzing data statistically. In their system, the data stream is processed using a software application that determines locations of the sensors that provide the data. The aforementioned systems are concerned with the detection and tracking of an object or an event in two-dimensional x-y plane only. It is insufficient to obtain accurate estimation about the behaviour of the dynamic event which its properties such as location and size vary continuously. This paper presents a statistical analysis of the aggregated sensed data that reporting about a dynamic event happened in an indoor environment. It provides a significant and accurate estimation which can effectively evaluate the dynamic event and improve the event detection and localization capabilities. It helps to locate and figure out the size of the dynamic event and its development in three-dimensional space. It is important to know the size
of the area where a dynamic event, such as fire or gas leak, has occurred in order to perform right instructions that provide valuable information for desired decisions to control the dynamic event.
3. THEORETICAL ANALYSIS
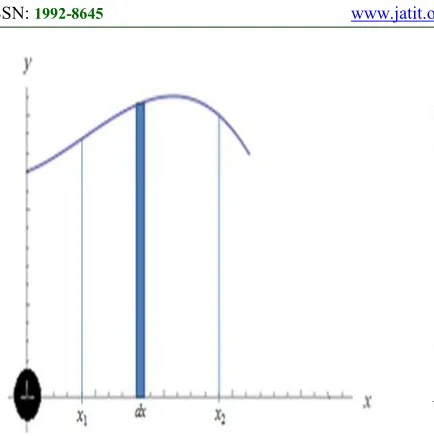
This section provides a statistical description of computing the event area. The observations measurements can considerably help in accurate localization of the event [14]. Event detection and tracking mechanisms play an important role in regards to the effectiveness of the monitoring applications [15]. Event detection concerns identifying and localizing of the event; while event tracking is the process of discovering and estimating the course of the event evolution over a specific time period. The development of the event may occur in spatial disjoint locations. Proper analysis of event tracking process helps in providing a comprehensive understanding of the event behavior. However, event tracking is challenging due to several aspects of the evolved event such as complex development over time and complex shape. If we are dealing with just two dimension area, then to find the area where the fire spreads, parametrization process can be used. According to the locations of the sensors from which the temperature readings have been received, a function of arbitrary line connecting those sensors (points) can be represented. We then can find the area between any two points with respect to the coordinates of the first sensor (point) detected the temperature increase. We are interested in finding a specific area (between x1, x2 and the line function f (x) with respect to the x-axis of the first sensor coordinates (say to differentiate the areas according to the temperature values). This can be achieved by taking very small changes in x (called dx) and multiplying them by the value of f(x) at those changes points. Thus, the area between x1 and x2 in Figure 2 can be calculated as follows:
971
Figure 2: Flat Area Computation With Respect To Dx
This concept can be utilized in localizing the area of the fire spread in three dimensional space (e.g. room). In order to define the border path of the area in plane, then both variables and should be parameterized as indicated in Figure 3. Let be equal to some function of some parameter , , and is equal to some other function of that same parameter , , for
. Hence, when , , and correspondingly, to represent the location of the point ( , on the plane as shown in Figure 3(a), where the border path is presented. Having another function , that associates every point in the plane with some value can represent a surface in the third dimension.
Proposition 1. Given a small change in the distance
of points in x-y plane and the height at those points, then the vertical area (the z-axis) of the fire evolution in the three dimensions space is
, (2)
Proof.The area of the curvy looking wall in Figure
3(b) can be calculated based on the small change in the distance of the curve ( ). That is, multiplying the change in the arc length by , at that point – which is the height at that point - will give the vertical area as follows:
[image:3.612.293.517.70.260.2], (3)
Figure 3: Computation Of The Area Height With Respect To Dx Over A Certain Path
To calculate the area, we take any small change in the arc length ( ). By relating to infinitely small changes in or , then can be computed using Pythagorean Theorem if the lengths of and changes are given. That is, as is the hypotenuse of the triangle , , as shown in Figure 3(c), then:
(4)
Then,
, (5)
As the definite integral in terms of , and both and are functions of , then:
, (6)
By algebraically manipulating differentials, we can multiply and divide component by as follows:
[image:3.612.98.315.72.290.2]
972 Thus,
, (8)
4. VALIDATION
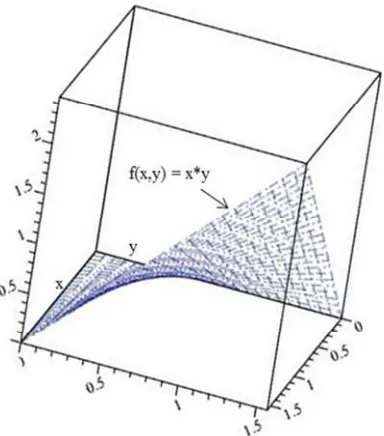
[image:4.612.322.512.90.300.2]We utilize our proposed fire event tracking system in [12] [13] for validating the concept presented in this paper. After simulating the fire, sensors inside the building send their sensed data whenever the threshold is exceeded. As we are interested to analyze the data to figure out the size of the fire area in 3-D space, the sensed data is graphed, as shown in Figure 4, with respect to the location of the sensor in the monitoring area.
Figure 4: Representation Of Fire Event Readings In 3-D Space
It was found that the area under fire (surface) is represented by , and there is a path in the plane, where cos and sin for
[image:4.612.98.290.306.524.2]0 $/2. Hence, the path is a curve on plane as shown in Figure 5. Our goal is to find the shaded area (grid) in the figure where the base is defined by the curve and the ceiling is defined by the surface . As explained earlier, this can be done by taking small changes ( ) in the path lengths and multiply them by the height at that point.
Figure 5: Computation Of The Vertical Area With Respect To Dx Over A Certain Path In 3-D Space
Thus, according to Proposition 1 the shaded area is:
'() )*+
,/
- sin cos
(9)
-,/ )*+ '() (10)
From (10), it is clear that we have an expression and its derivative.
. sin , then . cos ,
hence . cos (11)
Thus, having the boundaries in terms of μ results in:
.
2
2 - . 3 . 4- 1 0 (12)
That is, the vertical area is equal to ½.
973 space to infer the development of the dynamic event effectively. It is insufficient to obtain accurate estimation about the behaviour of the dynamic event which its properties such as location and size vary continuously, while this work addresses this issue. The estimation based on parametrization process is performed for dynamic indoor event localization only; tracking of the dynamic event evolution was not taken into account, where other mathematical concepts can be used such as vector field.
5. CONCLUSION AND FUTURE WORK
As for a dynamic event such as fire, a higher temperature sampling rate that reflects the change in the environment is required. Therefore, huge amount of raw data would be produced by sensors in the monitoring area. Thus, it is essential to have a mechanism to convert the data into functional knowledge that would help in proper reaction decision. In this paper, we have shown how parametrization process can be used to analyze the sensed data in order to calculate the fire event area in three-dimensional space according to the locations of the sensors from which the temperature readings have been received. In future work, we are going to present a hybrid system of continuous and event driven modes to detect and track an indoor environmental change for accurately determining the affected area.
ACKNOWLEDGEMENTS
This work was supported by Faculty of Information and Communication Technology, Universiti Teknikal Malaysia Melaka (UTeM).
REFERENCES
[1] S. S. Iyengar, and R. R. Brooks, “Distributed sensor networks: sensor networking and applications”, CRC press, 2016.
[2] P.Zhou, G. Huang, L. Zhang, and K.F. Tsang, “Wireless sensor network based monitoring system for a large-scale indoor space: data process and supply air allocation optimization”, Energy and Buildings, Vol.103, 2015, pp. 365-374.
[3] F. Robol, F.Viani, E. Giarola, and A. Massa, “Wireless sensors for distributed monitoring of energy-efficient smart buildings”, Proceedings of IEEE Mediterranean Microwave Symposium, 2015, pp. 1-4.
[4] J.Han, J. Lee, E. Lee, and D. S. Kim, “Development of a low-cost indoor environment monitoring system based on a hybrid wireless
sensor network”, Proceedings of IEEE International Conference on Consumer Electronics (ICCE), 2016, pp. 461-462.
[5] A.More, S. Wagh, and K. Joshi, “A test-bed for habitat monitoring system using Wi-Fi in Wireless Sensor Networks”, Proceedings of IEEE International Conference on Computational Intelligence and Computing Research (ICCIC), 2015, pp. 1-6.
[6] Z.Kira, A. R. Wagner, C. Kennedy, J. Zutty, and G. Tuell, “STAC: a comprehensive sensor fusion model for scene characterization”, Proceedings of SPIE 9498, Multisensor, Multisource Information Fusion: Architectures, Algorithms, and Applications, 2015, pp. 949804-949804.
[7] D.Abadi, S. Madden, and W. Lindner, “Sensor Network Integration with Streaming Database Systems”, Data Stream Management, Springer Berlin Heidelberg, 2016, pp. 409-428.
[8] C.Jin, W. Qian, and A. Zhou, “Analysis and Management of Streaming Data: A Survey”, Journal of software, Vol. 15, No. 8, 2004, pp.1172-1181.
[9] O.Diallo, J. J.P.C. Rodrigues, and M. Sene, “Real-time data management on wireless sensor networks: a survey”, Journal of Network and Computer Applications, Vol. 35, No. 3, 2012, pp.1013-1021.
[10]S. Subramaniam, V. Kalogeraki, and T. Palpanas, “Distributed real-time detection and tracking of homogeneous regions in sensor networks”, Proceedings of 27th IEEE International Real-Time Systems Symposium (RTSS'06), 2006, pp. 401-411.
[11]J.Fisher, J.Broderick, D. V. Blaricom, A. Malinovsky, and A. S. Wu, “Systems and methods for analytic data gathering from image providers at an event or geographic location”, U.S. Patent, 9,020,832, April 28, 2015.
[12]Omar Fouad Mohammed, Burairah Hussin, Abd Samad Hasan Basari, “Operational design and modelling of fire event tracking system in wireless sensor networks”, ARPN Journal of Engineering and Applied Sciences, Vol. 11, No. 13, 2016, pp. 8525-8531.
974 [14]C. Shang, G. Chen, C. Ji, and C.Y. Chang, “An
efficient target tracking mechanism for guaranteeing user-defined tracking quality in WSNs”, IEEE Sensors Journal, Vol.15, No. 9, 2015, pp.5258-5271.