Data-Intensive Content Delivery:
State-of-the-Art, Issues and Challenges
Irene Kilanioti1(B), Alejandro Fern´andez-Montes2, Dami´an Fern´andez-Cerero2, Anthony Karageorgos4, Christos Mettouris1, Valentina Nejkovic3, Nikolas Albanis4, Rabih Bashroush5, and George A. Papadopoulos1 1 Department of Computer Science, University of Cyprus, Nicosia, Cyprus
[email protected], {mettour,george}@cs.ucy.ac.cy
2 Departamento de Lenguajes y Sistemas Inform´aticos, Universidad de Sevilla,
Seville, Spain
{afdez,damiancerero}@us.es
3 Faculty of Electronic Engineering, University of Nis, Niˇs, Serbia
4 TEI of Thessaly, Karditsa, Greece
[email protected], [email protected]
5 University of East London, London, UK
Abstract. This chapter presents the authors’ work for the Case Study
entitled “Delivering Social Media with Scalability” within the framework of High-Performance Modelling and Simulation for Big Data Applica-tions (cHiPSet) COST Action 1406. We identify some core research areas and give an outline of the publications we came up within the framework of the aforementioned action. The ease of user content generation within social media platforms, e.g. check-in information, multimedia data, etc., along with the proliferation of Global Positioning System (GPS)-enabled, always-connected capture devices lead to data streams of unprecedented amount and a radical change in information sharing. Social data streams raise a variety of practical challenges: derivation of real-time meaningful insights from effectively gathered social information, a paradigm shift for content distribution with the leverage of contextual data associated with user preferences, geographical characteristics and devices in general, etc. In this article we present the methodology we followed, the results of our work and the outline of a comprehensive survey, that depicts the state-of-the-art situation and organizes challenges concerning social media streams and the infrastructure of the data centers supporting the efficient access to data streams in terms of content distribution, data diffusion, data replication, energy efficiency and network infrastructure. The challenges of enabling better provisioning of social media data have been identified and they were based on the context of users accessing these resources. The existing literature has been systematized and the main research points and industrial efforts in the area were identified and analyzed. In our works, in the framework of the Action, we came up with
c
The Author(s) 2019
potential solutions addressing the problems of the area and described how these fit in the general ecosystem.
1
Introduction
1.1 Social Data Streams Features
Herein some basic terminology for the topic of our Case Study entitled “Deliv-ering Social Media with Scalability” within the framework of High-Performance Modelling and Simulation for Big Data Applications (cHiPSet) COST Action 1406 is introduced. The terminology appears in published works [111] and [108], as well.
Social networks, media and platforms enable communication, exchange, busi-ness and knowledge acquisition as well as social network users connection with each other with the purpose of sharing content. Social data is the information that social media users share, e.g. check-in information, multimedia data, tags, annotations, and likes, and may include metadata such as the user’s location, native language, biographical data and shared links, whereas ’streams’ denotes various approaches have been performed that we do not refer to static datasets, but rather to dynamic information generated and transmitted over the Online Social Network (OSN).
Formally, an OSN is depicted by a directed graph G = (V, E), where V is the set of the vertices of the graph representing the nodes of the network and
A
C
D
F
H
B
E
G
I
J
Social Cascade
[image:3.439.44.380.48.264.2]height=4
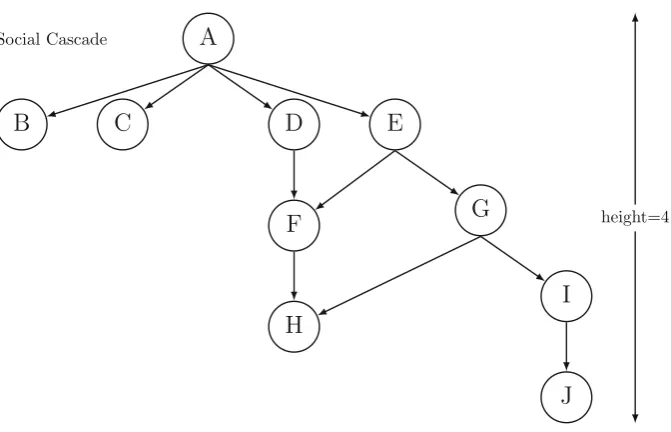
Fig. 1.The evolution of a social cascade in Twitter
graph. The cascade follows the arrows’ direction. For example, in Twitter, B, C, D, E are followers of A, whereas the adopters of a new information piece could be the nodes, that after having been exposed in a video link, they retransmit it, contributing remarkably to Internet traffic [1].
1.2 Challenges for Distribution of Social Data Streams
In the survey [108] we wrote in the framework of (cHiPSet) COST Action 1406 we identified the challenges of enabling better provisioning of social media data based on the context of users accessing these resources. In our works [109–111], that we produced in the framework of the Action, we came up with potential solutions addressing the problems of the area and described how these fit in the general ecosystem.
Challenges for Distribution of Social Data Streams
Context-aware Computing
Software for Infrastructure
Efficiency
Content Diffusion
Models Content Distribution
VM Consolidation
& Migration Workload
Consolidation & Shut-down Techniques
Energy-aware Scheduling Algorithms Data Replication
& Placement
- Limited Storage Space - Power Issues - Heterogeneous H/W and
S/W - Limited Screen size
- Connectivity - Communication &
Data Exchange Context
Sensing Context
Representation & Modelling
User Privacy
Ubiquitous Computing
5G Environments Social Data Streams
Architectures Systems Techniques 5G Solutions
[image:4.439.58.397.54.248.2]Data Center Scheduling Frameworks
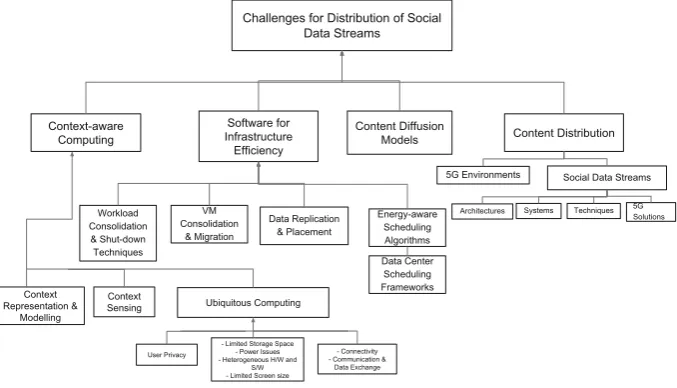
Fig. 2.Taxonomy of challenges for distribution of social data streams.
Infrastructure Efficiency is associated with energy-efficiency. This taxonomy includes solutions or approaches to the ‘Challenges for Distribution of Social Data Streams’. These solutions or approaches require enough effort, hence they can also be considered as a challenge for the research community.
Context-Aware Computing: Application of social contextual information, such as profiles, images, videos, biometrical, geolocation data and local data, in situations where conventional bandwidth-intensive content scaling is infeasible, could largely facilitate: the spreading of information, the identification of poten-tial information sources, as well as a paradigm shift in the way users access and control their personal data. User-generated multimedia content is especially dif-ficult due to its long tail nature, with each item probably not popular enough to be replicated in a global scale, but with the long-tail altogether getting sufficient accesses [20]. Social analysis tasks interweaved with context-aware computing could pave the ground for preactive caching mechanisms in the framework of a content delivery infrastructure of streaming providers.
Content/Information Diffusion Models: Prevalence of OSNs has trans-formed the landscape of content exchange. Popularity of relatively data heavy multimedia user generated content (UGC) has also risen [6], resulting in data deluge across all media platforms [12,127,141]. Measurement studies, such as [48], attribute the recent increases in HTTP/HTTPS traffic to the extended use of OSNs [28,49,69]. Elaborate data manipulation presupposes coping with the size of social graphs with billions of nodes and edges [174]. Facebook, for exam-ple, reported that had 1.47 billion daily active users on average for June 2018 and 2.23 billion monthly active users as of June 30, 2018 [4]. Its custom built-in data warehouse and analytics infrastructure [11] has to apply ad-hoc queries and custom MapReduce jobs [55] in a continuous basis on over half a petabyte of new data every 24 h for the creation of meaningful aggregations and analysis. It is also acknowledged that a large proportion of bandwidth-intensive media is distributed via reposted OSN links, contributing significantly to Internet traf-fic [1], [46]. These challenges are closely associated with the Content/Information Diffusion Models used to represent the diffusion of information over OSNs and facilitate relevant algorithmic solutions (Fig.2).
Content Distribution:The delivery infrastructure of video operators is made up of scattered geo-distributed servers, which with specific cache selection mech-anisms direct users to the closest servers hosting the requested data. Transmis-sion Control Protocol (TCP), however, is subject to delay jitter and throughput variations and clients are required to preload a playout buffer before starting the video playback [111]. Thus, the quality of experience (QoE) of media platform users is primarily determined by stalling effects on the application layer. For the YouTube case cache server selection is also highly Internet Service Provider (ISP)-specific, with geographical proximity not being the primary criterion and DNS level redirections for load-balancing purposes occurring quite frequently and substantially contributing to the initial startup delay of the playback. Sev-eral network-level and client-level approaches are focused on the detection of such interruptions, that negatively affect the user experience [94]. With the growing popularity of OSNs and the increased traffic due to outspread of information via the latter, the improvement of user experience through scaling bandwidth-demanding content largely depends on the exploitation of usage patterns and geolocation data associated with OSNs. These challenges are closely associated with the Architectures, Systems and Techniques within the 5G infrastructure.
Some key factors contributing to the problem of diffusion of bandwidth-intensive media content over OSNs are discussed below.
may be needed. An open problem is the efficient handling of graphs with billions of nodes and edges.
The desired scaling property refers to the fact that the throughput of the proposed approaches should remain unchanged with the increase in the data input size, such as the large datasets that social graphs comprise and the social cascades phenomena that amplify the situation. Cost of scaling such content can be expressed in different ways. For instance, it may be matched with the number of replicas needed for a specific source. Future experimentations may take into account the optimal use of memory and processing time of an OSN-aware built system.
Internet of Things (IoT) is a global infrastructure that interconnects things based on interoperable information and communication technologies, and through identification, data capture, processing and communication capabilities enables advanced services [5]. Things are objects of the physical world (physi-cal things, such as devices, vehicles, buildings, living or inanimate objects aug-mented with sensors) or the information world (virtual things), capable of being identified and integrated into communication networks. It is estimated that the number of Internet-connected devices has surpassed the human population in 2010 and that there will be about 50 million devices by 2020 [9]. Thus, the still ongoing significant IoT innovation is expected to generate massive amounts of data from diverse locations, that will need to be collected, indexed, stored, and analyzed.
OSN Evolution. Existent works examine valuable insights into the dynamic world by posing queries on an evolving sequence of social graphs (e.g. [146]). Time evolving graphs are increasingly used as a paradigm for the emerging area of OSNs [71]. However, the ability to scalably process queries concerning the information diffusion remains to a great extent unstudied. With the exception of sporadic works on specialized problems, such as that of inference of dynamic networks based on information diffusion data [149], at the time of writing the authors are not aware of relative studies on the information diffusion through OSNs under the prism of graphs dynamicity.
5G Approaches. The demand for high-speed data applications that has risen in recent decade lead to development of Fifth Generation Wireless (5G) communi-cations. Development of efficient mechanisms for supporting mobile multimedia and data services is prerequisite for 5G networks. Real bottleneck of todays’ mobile networks is the radio access network and the backhaul. Caching in the intermediate nodes, servers, gateways, routers, and mobile users’ devices can reduce doubled transmission from content providers and core mobile networks.
in [23] has shown that the deployment of those caching techniques in mobile net-work can reduce redundant traffic in backhaul, minimize the traffic load, increase the transfer rate in mobile network and reduce the latency. Correlation of several caching methods and procedures could result in improving network performance and obtaining better results.
On the other hand, well known bottleneck that 5G brings is the complex het-erogeneity of the network. Particularly, network consists of different technologies that coexist, where some technologies could potentially disable the transmission of data of equipment that use other technologies. Thus, we need a solution that efficiently handles resources in space, frequency, and device dimensions. Semantic coordination could alternatively be used in such networks [135,164].
The nodes in the system can communicate and share knowledge in terms of the spectrum utilization in the network. In [164], the authors proposed to model the spectrum usage coordination as an interactive process between a number of distributed communicating agents, where agents share their specific information and knowledge. The information includes the current spectrum usage state, spa-tial coordinates of the device, available communication protocols, usage policy, spectrum sensing capabilities of the device, spectrum needs, etc. An approach for such coordination is presented in [164] and it is based on semantic technolo-gies and communication between heterogeneous agents with potentially different capabilities and a minimal common compliance. The core knowledge is repre-sented by ontologies whose representation and usage is specified in a standardized way. The approach is used as dynamic spectrum coordination algorithms used for coordination among different wireless technologies in 5G networking [135,164]. This semantic technologies based approach can be used for wide diapason of problems within 5G heterogeneous networks, such as network states predictions, network analysis, minimizing traffic load, content distribution coordination etc. This approach could be used in combination with caching techniques in order to improve content distribution in 5G, but further research should be done in this area.
Mobile CDNs and the Cloud. Mobile computing (MC) [13] has created enor-mous demand for online experience, that OSN-aware CDNs are required to sat-isfy. Almost-ubiquitous Wi-Fi coverage and rapid extension of mobile-broadband provide undisrupted connectivity for mobile devices, whereas devices that hop seamlessly from WiFi to cellular networks, and technologies such as 5G, will be optimised for uses that put a premium on continuous connectivity regardless of the user location [5]. Mobile-specific optimizations for applications along with drastically simplified and more intuitive use of devices (e.g. with multi-touch interactions instead of physical keyboards) contribute to mobile applications becoming the premium mode of accessing the Internet, at least in the US [6].
and any time. The irruption of new paradigms, such as IoT, has increased the number of connected devices (sensors, actuators, etc.) which requires infrastruc-tures that provide higher throughput networking, specially in use cases where high definition videos are involved and even new scenarios are yet to emerge.
Mobile Computing entails the processing and transmission of data over a medium, that does not constraint the human-medium interaction to a specific location or a fixed physical link. Figure3 depicts a general overview of the MC paradigm in its current form. It is the present decade that signifies the prolif-eration of MC around the world, although handheld devices have been widely used for around two decades in the form of Personal Digital Assistants (PDAs) and early smartphones. Almost ubiquitous Wi-Fi coverage and rapid extension of mobile-broadband (around 78 active subscriptions per 100 inhabitants in Europe and America) provide undisrupted connectivity for mobile devices, whereas 97% of the world’s population is reported to own a cellular subscription in 2015 [5]. Moreover, the MC paradigm is nowadays further combined with other predomi-nant technology schemes leading to the paradigms of Mobile Cloud Computing [15], Mobile Edge Computing [8], Anticipatory Mobile Computing [138], etc.
Today’s mobile devices include smartphones, wearables, carputers, tablet PCs, and e-readers. They are not considered as mere communication devices, as they are in their majority equipped with sensors that can monitor a user’s location, activity and social context. Thus, they foster the collection of Big Data by allowing the recording and extension of the human senses [115].
Mobile social networking involves the interactions between users with similar interests or objectives through their mobile devices within virtual social net-works [44]. Recommendation of interesting groups based on common geo-social patterns, display of geo-tagged multimedia content associated to nearby places, as well as automatic exchange of data among mobile devices by inferring trust from social relationships are among the possible mobile social applications ben-efiting from real-time location and place information.
1. Industrial Applications: Maintenance, service, optimization of distributed
plant operations is achieved through several distributed control points, so that risk is reduced and the reliability of massive industrial systems is improved [139].
2. Automotive Applications: Automotive applications capture data from sensors
embedded in the road that cooperate with car-based sensors. They aim at weather adaptive lighting in street lights, monitoring of parking spaces avail-ability, promotion of hands-free driving, as well as accident avoidance through warning messages and diversions according to climate conditions and traffic congestion. Applications can promote massive vehicle data recording (stolen vehicle recovery, automatic crash notification, etc.) [7].
3. Retail Applications: Retail applications include, among many others, the
4. Healthcare & Telemedicine Applications: Physical condition monitoring for patients and the elderly, control of conditions inside freezers storing vaccines, medicines and organic elements, as well as more convenient access for people in remote locations with usage of telemedicine stations [98].
5. Building Management Applications: Video surveillance, monitoring of energy
usage and building security, optimization of space in conference rooms and workdesks [7].
6. Energy Applications: Applications that utilize assets, optimize processes and
reduce risks in the energy supply chain. Energy consumption monitoring and management [10,172], monitoring and optimization of performance in solar energy plants [167].
7. Smart homes & Cities Applications: Monitoring of vibrations and material
conditions in buildings, bridges and historical monuments, urban noise moni-toring, measuring of electromagnetic fields, monitoring of vehicles and pedes-trian numbers to optimize driving and walking routes, waste management [81].
8. Embedded Mobile Applications: Applications for recommendation of
interest-ing groups based on common geo-social patterns, infotainment, and auto-matic exchange of data among mobile devices by inferring trust from social relationships. Visual effects streaming workflow will give users on-demand, cloud-based access to visual effects tools, that can be accessed via web, given enough low-latency bandwidth to maintain a connection for streaming the User Interface from the cloud. Video Game streaming workflow will give play-ers the option of streaming graphically-rich content that requires near-instant interaction between the game controller and the graphics on the TV screen [139].
9. Technology Applications: Hardware manufacture, among many others, is
improved by applications measuring peformance and predicting maintenance needs of the hardware production chain [139].
2
Related Work
In a manner that resembles the utilization of social data streams Anjum et al. [21] review the deployment of peer-assisted content delivery solutions. They present challenges caused due to heterogeneity in user access patterns and the variety of contextual information, such as interests and incentives of Internet Service Providers, End-Users and Content Providers. Furthermore, Perera et al. [139] survey context awareness from an IoT perspective. They indicate that the technology in the IoT is expected to enable expansion of conventional content delivery systems to a broader network of connected devices. They systematize the collection, modeling, reasoning, and distribution of context in relation to sensor data in a work that resembles the social data harvesting in terms of volume, variety and velocity. The survey also addresses a broad range of methods, models, systems, applications, and middleware solutions related to context awareness in the realm of IoT, that could be potentially applicable to social data streams, too. In [111] Kilanioti et al. study various experiments on a modified content delivery simulation framework and compare miscellaneous policies for dynamic content delivery based on analysis of social data streams. The incorporation of an OSN-aware dynamic mechanism becomes indispensable for content delivery services, since (i) significantly large proportion of Internet traffic results from bandwidth-intensive multimedia content, that is produced via online media ser-vices and transmitted over OSNs, and (ii) multimedia content providers, such as YouTube, often rely on ubiquitous content distribution infrastructures. The policies presented take patterns of user activity over OSNs and exploit geo-social properties of users participating in extensive retransmissions of items over OSNs. The authors proceed to incorporate diverse caching schemes of the underlying infrastructure, miscellaneous policies for the handling of OSN data and various approaches that take into account the most efficient timing for content place-ment. The simulation framework introduced in [107] serves in this study as the basis of further parameterized content delivery experimentation that exploits information transmission over OSNs and decreases replication costs by selec-tively copying items to locations where items are bound to be consumed.
We are not aware of surveys in the bibliography suggesting an holistic app-roach for the utilization of social data streams towards facilitation of content distribution decisions and social analysis tasks other than [108]. The diverse parameters we review in this work (modelling, simulation, performance evalua-tion) take into account low-level decisions and high-level considerations, includ-ing energy efficiency of employed data centers, in-memory keepinclud-ing solutions and various network approaches for time-critical applications. We review combined aspects such as optimal route selection, data redundancy, data localization and data center optimizations.
3
Social Networks and Context-Aware Computing
A social network is a network of social bindings between people. Computer-Supported Cooperative Work (CSCW) has contributed much in offering advanced collaborative systems for leveraging human connections and improv-ing human interactions in workspace environments, but these systems mostly focus on business-driven interactions where connections among people tend to be formal and structured [43]. Recently however, social and computing disciplines focused specifically on the design of social-networking services, i.e. applications that support human social interactions and can be more informal.
The advancement of wireless networks, as well as mobile, context-aware and ubiquitous computing, enabled the improvement of social-networking services by enabling social encounters between proximate users with common interests in an anywhere and anytime fashion, as in Ubiquitous Computing systems [43]. Thus, there has been a shift of the application focus from virtual to physical social spaces using ubiquitous technologies [43]. This shift introduces a great number of possibilities, however it also introduces a number of challenges that are related to ubiquitous computing. While social-network systems for ubiquitous computing environments are an emerging trend in social computing, due to the fact that ubiquitous-computing environments are more dynamic and heterogeneous than Internet based environments, appropriate solutions and design guidelines are required to facilitate their ubiquitous aspect.
Challenges in Ubiquitous Computing can be categorized to (Want and Per-ing [170]): (i) power management issues: refers to how mobile devices deal with processing power and storage space and the kind of wireless technology to use in every given situation, (ii) limitations in connecting devices: this issue has to do with how all these small devices will be connected and managed, (iii) user inter-face issues: since Ubiquitous Computing demands for many different small-scale devices of various types of interfaces and displays of various sizes, the challenge in user interfaces lies in developing user friendly and interactive interfaces to the level where users will be motivated in using them, (iv) issues related to Location Aware Computing. Henricksen et al. [88] add to the above list the challenge of managing heterogeneous devices of different hardware and software specifi-cations, such as sensors and actuators, embedded devices in objects such as shoes, home and office appliances such as videos, mobile devices and traditional desktop computers, in order for these devices to interact seamlessly. Another challenge they mention has to do with maintaining network connections while devices move between networks of different nature and characteristics. In ubiq-uitous environments, people tend to use many devices simultaneously, therefore there is a need for these devices to communicate and exchange data. Another challenge Satyanarayanan [152] notes is tracking user intentions. This is impor-tant in Pervasive Computing in order for the system to understand what system actions could help the user and not hinder him/her.
process of accessing contextual information, Hinze and Buchanan propose that context-awareness can help in reducing the amount of data to be accessed in real time, by pre-retrieving any relevant pre-known data, e.g. the static context [90], to increase efficiency.
User modelling in another challenge in developing ubiquitous systems. User modeling in ubiquitous environments is challenging: a user often changes roles depending on the context and the current environment he acts into; the big challenge is how to capture these changes and how to react on them [90].
Perhaps one of the most important contextual parameters is location, as it plays an important role in context-aware systems and ubiquitous systems. An issue with location as a contextual parameter is the type of location sensing technology to be used, while privacy is another issue. The issue with privacy is whether user privacy should be sacrificed for location awareness and to what extent. A third issue is the semantic (and contextual) representation of the loca-tion in order to utilize more contextual parameters than just the localoca-tion itself. For example, by semantically representing locations, one can attach to them various information resources such as a webpage, a user profile, various objects with semantic representation etc. Schilit et al. [154], proposed the movement from the simplified concept of location to more contextually rich notions of place where people and activities should also be considered. Possible problems towards this concept include the difficulty in managing large scale positioning data, privacy concerns regarding location-awareness and the challenge of how to associate information objects, such as a web page, with a real-world location. Pri-vacy issues regarding location-awareness are related to human psychology: users often consider privacy issues when their location is to be known by a system, but at the same time they provide private information such as credit card numbers and addresses to online systems without hesitation. This happens because in the first case they simply do not see the benefit of providing their location to be used by a simple application (e.g. finding friends in the proximity), while at the latter case they clearly see the benefit of buying goods online. The authors also argue that the centralized nature of the most location tracking applications (having a central server on which all user personal data are stored) discourages users from providing any personalized information, because centralized data can be accessed by anyone, not only illegally (e.g. hackers) but also the government, corporations with interest in user data (e.g. advertisers) etc. A solution can be the use of a decentralized schema where any personal data is stored and calcu-lated on the client side, i.e. the user’s device. An example of such a technology is the well known Global Positioning System (GPS): the client device uses satellite links to calculate locally the user’s current position.
Context-Awareness and Adaptation related challenges and issues include 1. Modelling the context:which method is more appropriate to use 2. Observing the context:automatically or manually
4. Accuracy of contextual information should be well known during the design of ubiquitous systems
5. Storing the context:on server (privacy issues), on client or on both 6. Accessing the context
7. Using the context
8. How are the user and the environment connected and interact 9. How will the application modify its behaviour (be adapted) based
on the context
10. Systems should be more context-aware than just the location. A place is more than a location (also a Location related challenge)
11. Devices should not operate based only on their own context, but based on the context of the whole system
12. Contextual information should be used to reduce the amount of input that is needed from users (also a Human-Computer Interaction related challenge)
13. How to capture changes in the user’s roledeals with capturing the current context (i.e. the environment and the various circumstances) and user modelling (what possible role could a person play according to context) 14. Context should be processed and various components should adapt to it without interfering with user’s task – no user explicit interaction should be necessary
15. Adaptation in ubiquitous environments: may need to adopt various devices separately and at the same time, while the user maintains a consis-tent view for the system/application
Context-aware computing has evolved over time from desktop applications, web applications, mobile computing, pervasive/ubiquitous computing to IoT over the last decade [139]. Context-aware computing became more popular with the introduction of the term ‘ubiquitous computing’ by Mark Weiser, while the term ‘context-aware’ was first used by Schilit and Theimer [155] in 1994. Context-aware computing has proven to be successful in understanding sensor data. Advances in sensor technology led to more powerful, cheaper and smaller sensors. The number of employed sensors is expected to grow over the next decade [161], generating ultimately big data [139,140].
A bibliography study [134] on mobile social network applications and plat-forms states that the context features that these applications and platplat-forms use can be summarized as follows: Location, Interest, Time, Personal, Activity and Social Interaction. Here, context is “any information that can be used to char-acterize the situation of an entity” [62] and social context is “the information relevant to the characterization of a situation that influences the interactions of one user with one or more other users” [169]. Moreover, in [134] a context-aware Mobile Social Network model is proposed aiming to facilitate the creation of dynamic social networks based on a combination of multiple contexts, including location, users’ profile, domain specific data and OSN data, along with services for fostering the interaction among users.
4
Infrastructure Efficiency
4.1 Software Solutions for Infrastructure Efficiency
Regarding infrastructure efficiency, various models have been proposed for the optimization of such infrastructures that support social networks data centers. These approaches have also been proposed by industry partners addressing var-ious challenges [42,129,163]. Among these challenges, the following have been identified: (a) data volume increase, (b) confinement, (c) interactions made in real-time or near real time, (d) federation of data center infrastructures and (e) cdn-load-balancing between data centers, but usually not focused on cost effec-tiveness. One of the main data center costs is energy consumption of both the IT equipment as well as the supporting Mechanical and Electrical (M&E) infras-tructure. A widely used indicator that measures the energy effectiveness of the M&E infrastructure overhead is Power Usage Effectiveness (PUE) [25], which is calculated as theTotal facility energy/Total IT energy and has a theoretical minimum of 1.
Figure 2 shows the categories on which the research community and other stakeholders have developed solutions for the improvement of costs and effi-ciency:
– Workload Consolidation and Shut-down Techniques, – VM Consolidation and Migration,
– Data Replication and Placement, and – Energy-aware Scheduling Algorithms.
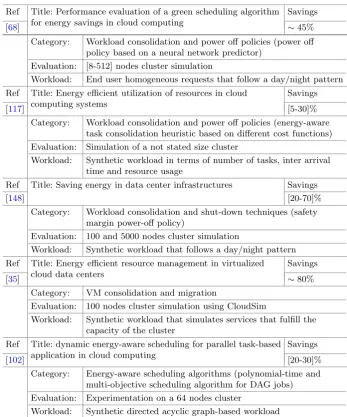
The main objective based on these solutions is to reduce the idleness of computing and storage nodes (throttle resources), while switching off unused machines without jeopardizing Service Level Agreements. Some representative examples from each category are shown in Table1.
minimum multi-objective function, taking into account energy-consumption and running time by combining resource allocation and heuristic rules and simulating Directed Acyclic Graph (DAG) based workloads.
One of the most popular approaches to increase efficiency is to switch off idle servers [75,78], which is usually tested in dedicated simulation tools [74]. Several models, including games theory models [72,73], are used to balance opposite requirements in data centers, such as performance and energy consumption. Even models utilized for economic environments, such as Data Envelopment Analysis, are employed to analyze the efficiency in various realistic large-scale data centers and propose corrections to improve data-center efficiency [76].
In addition, techniques for energy conservation likeVirtual Machine (VM) Migration and Consolidation are widely studied and already employed. In [35], a resource manager solution focused on virtualized data centers, which enables lower energy consumption by applying VM migrations and allocations based on current CPU usage, is proposed. An extension of VM migration is pre-sented in [34] where Service Level Agreement (SLA) restrictions are considered. Allocation and migration of VMs is also the target in [159] where a Bayesian Belief network algorithm is presented. Moreover, a day/night pattern is taken into account for an energy manager in [148], based on the aggregation of traffic during low usage periods and shutting down idle machines.
Solutions for improving energy proportionality throughData Replication and Placement, are also available. A power-proportional distributed file system approach that tries to store data on non-overlapping subsets of machines is presented in [18]. Such subsets of machines contain only one copy of each file and administrators can decide how many subsets will be turned on to serve incoming requests. On the other hand, a division of the cluster in non-overlapped zones is proposed in [162], enabling operators to shut down zones. In a similar way, in [105] the authors present a variation of the Hadoop File System (HDFS) that divides the cluster inHot Zonesthat store recent data andCold Zoneswhere low [e.g. spatial or temporal] popularity files are stored. Then a power off policy is applied to theCold Zones. A non-uniform replica placement on data popularity is also presented in [125].
Energy-Aware Scheduling Algorithms is the last family of solutions. A green scheduling algorithm based on neural networks is proposed by [68], focusing on the prediction of workload demand with the purpose of applying power-off policies to idle servers. Experiments presented simulate a medium sized data center that runs homogeneous workload that is intended to respond to end-user requests. Energy-aware scheduling policies combined with Dynamic Voltage and Frequency Scaling (DVFS) is presented in [100]. In [77], a multi-objective scheduling algorithm is proposed, based on genetic algorithms, which takes into account energy efficiency, performance and security constraints.
Table 1.Related work summary
Ref Title: Performance evaluation of a green scheduling algorithm for energy savings in cloud computing
Savings
[68] ∼45%
Category: Workload consolidation and power off policies (power off policy based on a neural network predictor)
Evaluation: [8-512] nodes cluster simulation
Workload: End user homogeneous requests that follow a day/night pattern
Ref Title: Energy efficient utilization of resources in cloud computing systems
Savings
[117] [5-30]%
Category: Workload consolidation and power off policies (energy-aware task consolidation heuristic based on different cost functions) Evaluation: Simulation of a not stated size cluster
Workload: Synthetic workload in terms of number of tasks, inter arrival time and resource usage
Ref Title: Saving energy in data center infrastructures Savings
[148] [20-70]%
Category: Workload consolidation and shut-down techniques (safety margin power-off policy)
Evaluation: 100 and 5000 nodes cluster simulation
Workload: Synthetic workload that follows a day/night pattern
Ref Title: Energy efficient resource management in virtualized cloud data centers
Savings
[35] ∼80%
Category: VM consolidation and migration
Evaluation: 100 nodes cluster simulation using CloudSim
Workload: Synthetic workload that simulates services that fulfill the capacity of the cluster
Ref Title: dynamic energy-aware scheduling for parallel task-based application in cloud computing
Savings
[102] [20-30]%
Category: Energy-aware scheduling algorithms (polynomial-time and multi-objective scheduling algorithm for DAG jobs) Evaluation: Experimentation on a 64 nodes cluster
Workload: Synthetic directed acyclic graph-based workload
4.2 Data Center Scheduling Frameworks
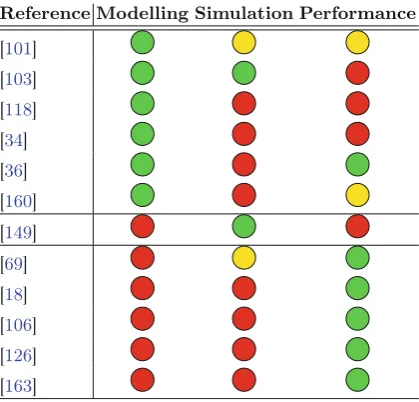
Table 2. Classification of approaches according to their objective. The green color represents that the work focuses strongly on that objective, and the red color represents opposite.
The constraints imposed by diverse applications in terms of size, inter-arrival and duration, may lead to various resource efficiency, latency rates and security levels.
Current trends aim to utilize the same hardware resources to deploy various kind of applications and frameworks with diverse requirements, which increases the complexity since diverse data are to be processed.
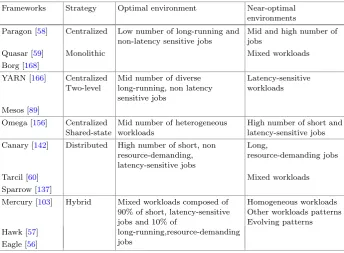
We present the main categories of the scheduling resource-managing mod-els following several approaches and we show their limitations summarized in Table3.
Table 3.Cluster scheduling approaches.
Frameworks Strategy Optimal environment Near-optimal
environments
Paragon [58] Centralized Low number of long-running and non-latency sensitive jobs
Mid and high number of jobs
Quasar [59] Monolithic Mixed workloads
Borg [168]
YARN [166] Centralized Two-level
Mid number of diverse long-running, non latency sensitive jobs
Latency-sensitive workloads
Mesos [89]
Omega [156] Centralized Shared-state
Mid number of heterogeneous workloads
High number of short and latency-sensitive jobs
Canary [142] Distributed High number of short, non resource-demanding, latency-sensitive jobs
Long,
resource-demanding jobs
Tarcil [60] Mixed workloads
Sparrow [137]
Mercury [103] Hybrid Mixed workloads composed of 90% of short, latency-sensitive jobs and 10% of
long-running,resource-demanding jobs
Homogeneous workloads Other workloads patterns Evolving patterns Hawk [57]
Eagle [56]
With the arrival of new computation paradigms such as microservices, cur-rent trends tend to divide jobs into smaller parts which usually are more latency-sensitive. This new scenario with huge amounts of small jobs overcome the capac-ity of Monolithic models. Two new centralized resource managing models were proposed to overcome this limitation by dividing the responsibility of resource managing and scheduling:
– Two-level resource managers, such as Mesos [89], and YARN [166] employ a central resource manager which coordinates a set of independent sched-ulers. The parallel schedulers pessimistically block the data center in order to make a scheduling decision. Such manager offers resource schedulers, and as a response, the set of schedulers perform scheduling decisions for deciding which machines will execute a particular task. The down side of this model is that, opposed to Monolithic models, the schedulers are not omniscient. In this model, data-center state and tasks requirements are not always available to make optimal scheduling decisions.
Instead of blocking the data center to apply their decisions, they follow a transactional approach. If a transaction ends up in a conflict, the data-center state is requested and the scheduling restarts.
However, all the aforementioned proposals suffer from a performance bot-tlenecks when huge latency-sensitive workloads composed of millions of tasks are under consideration, as they employ centralized coordinators for resource managing or even for resource managing as well as scheduling [137].
Distributed schedulers such as Sparrow and Canary [67,137,142,143] are built to work optimally when the aforementioned scenarios are considered. Distributed models employ faster and simpler algorithms in order to analyze smaller areas of the data center, which leads to sub-optimal decisions with higher throughput and lower latency rates.
The frameworks and applications served by data centers are constantly evolv-ing. Current trends show that in most cases heterogeneous workloads are being deployed in large-scale realistic clusters [50,145]. Such workloads are composed by two main kinds of jobs: (a) Jobs such as web servers and data-center frame-works, which represent 10% of jobs. These jobs consume, however, more than 80% of computing resources because they run for long periods; and (b) Jobs such as MapReduce tasks, which represent 90% of jobs. These jobs run for shorter periods and consume less than 20% of computing resources [19,144,147,175]. In such environment, sub-optimal scheduling operations may severely impact on the aforementioned large jobs. Hence, distributed models may achieve worse results in terms of performance compared to those achieved by centralized models.
Finally, hybrid models, such as Hawk and Mercury [56,57,103] were devel-oped to work well under the aforementioned scenario. These models employ centralized and distributed approaches in order to overcome the limitations dis-cussed. Hybrid models use a centralized scheduler for long-running jobs to pro-vide high-quality scheduling and, on the other hand, they employ a distributed approach for those short jobs which need quick scheduling to achieve latency goals.
Beyond workload consolidating and resource throttling, other research has explored the impact IT hardware refresh and optimization could have on data centre energy consumption [31]. Additionally, it was shown that addressing energy efficiency at the design stage of software systems presents a significant opportunity to reduce infrastructure energy consumption [32].
5
Content Diffusion Models for Social Data Streams
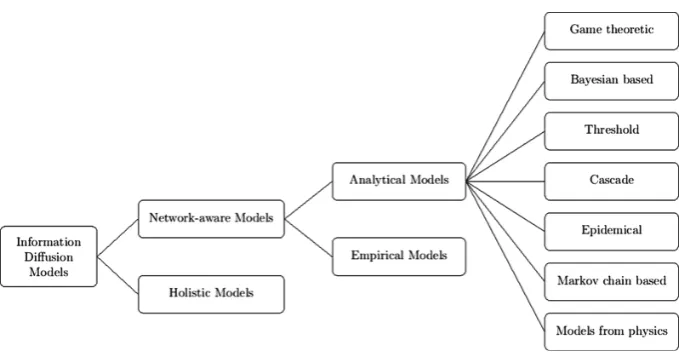
categorization of nodes according to their influence degree. The categorization of the models is depicted in Fig.4. The models presented are the most recent in the bibliography and there are no prior recent models to the best of our knowl-edge. The first-level discrimination of models is based on whether they take the structure of the network into consideration (network-aware) or not ( holis-tic). In other words the discrimination criterion is if they incorporate knowledge about underlying associations of the nodes (edges) or, to the contrary, follow an aggregate-level approach.
Information Diffusion Models Classification. Li et al. in [120] classify
informa-tion diffusion issues as a “3W issue”, that is with regard to “What”, “Why” and “Where”. They consider “What” to refer to the question“what latent informa-tion is there to be found in social networks?” and they provide as an example the findings, such as the way that an individual’s shopping habits relate to his/her profession, that can be included in a large volume of consumer data. Further-more, their proposal considers “Why”, to refer to the question“why has the information propagated in this way?” This question refers to the factors that have affected the diffusion result, for example the factors that have produced a particular social cascade. Finally in their view “Where”, refers to the question “where will the information be diffused to in the future?”. This question refers to the future diffusion path that will be followed. For example if two influential users receive the same information from a common contact in a social network, but have a different perspective on the information, then it is important to esti-mate how they will respond and whether they will propagate the information through the network.
Based on the “3W issue” they classify information diffusion models as predic-tive and explanatory. Explanatory models aim to discover answers to important questions concerning the information diffusion process, such the determination of the main factors that affect information diffusion and the most influential nodes in the network. Predictive models, on the other hand, are used to predict the future information diffusion process in social networks based on certain factors, for example the quality of information diffused.
In a similar manner Luu et al. in [126] classify information diffusion models in non-network and network diffusion models. The former refers to user commu-nities without any knowledge about the user relationship network and the latter is more applicable to the social networks where user relationships networks are given (e.g. Facebook, blog networks). For each model category Luu et al. describe representative models, notable model extensions, as well as model applications. The surveyed applications include Influence Maximization and Contamination Minimization. Model extensions are asynchronous models that incorporate time delay factors into the basic models.
and manage the selfish nodes and disjoined nodes. The authors provide simula-tion results in two types of networks: lattice networks and scale free networks, and the results show that the ant-colony model has higher performance and higher reachability than a selected baseline epidemic model.
Influence Maximization. Influence maximization is an important issue in social
network analysis domain which concerns finding the most influential nodes in a social network. Determining the influential nodes is made with respect to information diffusion models and is based on the observation that most of the existing models only contain trust relationships. In this respect Hosseini-Pozveh et al. in [93] classify influence maximization models in two classes: cascade-based and threshold-cascade-based. They evaluate all models in comparison with selected benchmark models through two real data sets, the Epinions and Bitcoin OTC. Based on the evaluation results a main conclusion is drawn: when a distrusted user performs an action or adopts an opinion, the target users may tend not to do it.
The efficiency of influence maximization algorithms is subject to active research since the problem is known to be NP-hard. In this respect Kempe et al. proposed a greedy algorithm (referred to as SimpleGreedy) that guarantees 63% influence spread of its optimal solution [106]. Along this line Ko et al. in [113] propose an improved algorithm, termed Hybrid-IM, which by combines PBIM (Path Based Influence Maximization) and CB-IM (Community Based Influence Maximization). Ko et al. further provide evaluation results from extensive exper-iments with four real-world datasets. They show that Hybrid-IM achieves great improvement (up to 43 times) in performance over state-of-the-art methods and finds the seed set that provides the influence spread very close to that of the state-of-the-art methods.
5.1 Holistic View Models
Rogers’ theory [150] is quantified by the Bass model [33]. The Bass model is based on the notion that “the probability of adopting by those who have not yet adopted is a linear function of those who had previously adopted” (F.Bass). It predicts the number of adoptersn(t)∈N of an innovation at time t (in the information diffusion scenario the number of retransmitters of an information piece):
n(t) =pM+ (q−p)N(t)−q/M(N(t))2 (1)
Models under the same concept of holistic view of the social behaviour make use of differential equations, and include, among others, the “multi-step flow model” by Katz and Lazarsfeld [104], the Daley-Kendall rumours model [54], and also, more recent ones, such as, the Van den Bulte and Joshi model of influentials and imitators [47].
Fig. 4.Content/information diffusion models
5.2 Network-Aware Models
These include completely novel models, but also variations of the afore-mentioned (holistic) models, such as the Nekovee variation [136] of the Daley-Kendall model, and are separated in following categories, based on whether they are mathematically formulated (Analytical models) and then applied or are the outcome of empirical methods, such as regression, regression trees etc. (Empirical models).
Analytical Models. The first mathematical models based on nodes’ thresholds for the depiction of information diffusion were developed by Schelling [157] and Granovetter [86]. A categorization of the most predominant models is presented.
Game-Theoretic Models. In [112], Kleinberg proposes a simple networked
coor-dination games model. The author assumes that there are two behaviours a node
behaviour matching, expressed in the following way, where parameterqis a real number 0< q <1:
– ifv andwboth choose behaviour A, they both receive aqpayoff – ifv andwboth choose behaviour B, they both receive a 1−qpayoff – ifv andwchoose different behaviours, they both receive a 0 payoff
v’s payoff for choosing A isqdAv and for choosing B is (1−q)dBv. The overall payoff forvplaying the game with its neighbours inGis the sum of the individual (pairwise) payoffs;qis actually the threshold expressing the fraction of adopting neighbours, since it easily results thatv should adopt behaviour B ifdBv > qdv, and A if dBv < qdv, where dv is the degree of the node, dAv the number of its neighbours with behaviour A and dBv the number of its neighbours with behaviour B.
Initially there is a setS of nodes adopting behaviour B andhq(S) is the set of nodes adopting B after one round of updating with thresholdq.hkq(S) is the set of nodes adopting B afterk successive rounds. A set S is contagious (with respect tohq) if “a new behaviour originating atS eventually spreads to the full set of nodes”and the contagion threshold of a social networkGis“the maximum
qfor which there exists a finite contagious set”.
The technical issue ofprogressive ornon-progressive processes (monotonous or non-monotonous as referred to later on in the present study) refers to the fact that when a node v following till then the behaviour A updates to behaviour B in time step t, it will be following B in all subsequent time steps. Although, intuitively, we would expect progressive processes to give finite contagious sets more easily (because of lack of early adopters setbacks that would hinder the cascade), Kleinberg points out that both the progressive and non-progressive models have the same contagion thresholds [131], which in both cases is at most 1/2 (“a behaviour can’t spread very far if it requires a strict majority of your friends to adopt it”) [131].
More game-theoretic models can be found in the work of Arthur [22], who proposes a simple cascade model of sequential decisions with positive externali-ties, manifested by a term that adds to the payoff of a decision. Namely in the scenario of two competing products, the latter become more valuable as they are used by more users (for a social media site or a smartphone, for example, it will aquire better third-party applications and support as its users grow). Also game-theoretic models are introduced by Banerjee [29] and Bikhchandani et al. [39], that are based on influence not due to positive externalities, but because of information conveyed from earlier decisions. The proposed game-theoretic mod-els, however, have the drawback of not taking heterogeneity into consideration, in the notion that all nodes have the same threshold, and all their neighbours contribute the same in making a node change its behaviour.
Bayes-Based Models. Combining nodes’ private information and their
the probability this is the best restaurant given the reviews I have read and the crowds I see there?”.
P r[A|B] = P r[A]P r[B|A]
P r[B] (2)
Three factors are taken into consideration: – The states of the world;
– Payoffs; and – Signals.
The first factor expresses whether an option is good or bad (if a new restaurant is a good or a bad choice). Supposing that the two options of the world are K (the option is a good idea) and B (the option is a bad idea), the world is placed in K with probability p and in B with probability 1−p (P r[K] = p,
P r[B] = 1−P r[K] = 1−p). Payoffs for a nodev are defined as follows: – Ifvrejects the option, the payoff is 0.
– Ifvadopts a good idea, it receives a positivevg>0 payoff. – Ifvadopts a bad idea, it receives a negativevb >0 payoff. – Ifvadopts without any prior knowledge, the payoff is 0.
The signals refer to private information each individual gets about the benefit or not of a decision: a high signal (H) suggests that adoption is a good idea, whereas a low signal (L) suggests that it is a bad idea. If accepting is indeed a good idea, thenP r[H|K] =q > 12 andP r[H|K] = 1−q < 12. In the restaurant example the private information could be a review that an individual reads about the first restaurant, with a high signal corresponding to a review comparing it favorably to restaurant B. If choosing the first restaurant is indeed good, there should be a higher number of such reviews, soP r[H|K] =q > 12. Kleinberg and Easley [69] consider how individual decisions are made using (Eq.2) when they get a sequence of independently generated signals consisting of a number of high signals and a number of low signals, thus making interesting observations about situations where individuals can observe others’ earlier decision, but do not have access to their knowledge.
The basic propagation models on which most generalizations for information diffusion are based are the Linear Threshold Model (LTM) [86,157,171] and the Independent Cascade Model (ICM) [82] with many proposed extensions (LTM: [106,171], ICM: [82,87,106]) and also a proposed unification [106].
Linear Threshold Model. Based on the assumption that some node can be either
neighbors of node that must become active in order for node to become active”), and is influenced by each one of its neighbors w according to a weight bvw, so that w∈Γ(v)bvw ≤ 1. The thresholds can be produced randomly with a uniform distribution, but some approaches investigate a uniform threshold for all the nodes of the network, e.g. [37]. The process takes place in discrete steps and the nodes that satisfy the constraintw∈Γ(v)bvw > θv are gradually added as active to the initial set of nodes. It’s worth mentioning that LTM can result as a modification of the networked coordinations game referred in the previous paragraph with the differentiation of payoffs for different pairs of nodes.
LTM expresses the idea that the influence of the neighbours of a node is additive, but when the rule of influence can not be expressed by a simple weighed sum, for example a node becomes active when one of its acquaintances and two of its co-workers do so, the arbitrary function gv substitutes the weighed sum. In the General Threshold Model for time steps t = 1,2,3... a node v becomes active if the set of active neighbours at t satisfygv(X)> θv.
Independent Cascade Model. Under the ICM model [82], there is also a set
of initially active nodes, the process takes place in discrete steps, but when node v becomes active, it has only one chance of activating each of its inactive neighbors w until the end of the process with a probabilitypvw independent of the activations history and with an arbitrary order.
Exact evaluation of activation probabilities is exponential to the number of edges of the graph. Improving the performance of the works in [86] and [160], there are works studying the calculation of these probabilities such as [84] (based on a General Threshold Model with the assumption that each parent’s influence is fixed), or [64] (based on the ICM). In the latter, sampling from the twitter dataset is conducted in an efficient Markov-Chain Monte Carlo fashion using the Metropolis-Hastings algorithm [51] and the problem is tackled with two differentiations, one of which considering the past paths of data known (retweets for the twitter dataset) and one considering only the past path endpoints known (hashtags and urls) and joint probabilities are taken into consideration, reflecting also model uncertainty.
Epidemical Models. In the case of epidemical models a single activated
(“infected”) node causes the change of state of a neighbour susceptible node, whereas in the afore-mentioned threshold and game-theoretic models a node has to interact with multiple neighbour nodes to evolve (complex contagion).
Epidemical models were introduced on the assumption that information would propagate like diseases. They constitute another category with an almost straightforward pairing with the ICM. The ICM captures the notion of contagion more directly, and also allows us to incorporate the idea that a node’s receptive-ness to influence does not depend on the past history of interactions with its neighbors.
number of the diseaseR0=kπ, where k is the number of new people somebody meets, which expresses the anticipated number of new cases of the disease that a single node will cause.
Extensions of the epidemical models are the SIR, SIS, and SIRS models: S stands for susceptible nodes, nodes that have not been infected yet and have no immunity to the contagion. I stands for infected nodes, nodes contagious to their susceptible neighbours, and R stands for recovered nodes, with the recovery considered as permanent in SIR and temporary in the case of SIRS [114]. The sequence of the letters in the acronyms of the models explains the flow of the epidemic. In SIR model nodes pass from the state of being susceptible to the state of being infected and then recover. In SIS model nodes are immediately susceptible once they have recovered (like in the case of common cold, recovery does not imply immunity that lasts for long). In the SIRS model recovered nodes free of infection may rejoin the susceptible nodes.
Markov Chain Models. Markov chains [65] are used to describe transitions from
one state of a system to another in a finite set of possible states. Their mem-oryless nature (Markov property) has to do with the fact that the next state each time is independent of the preceding states. More formally: With a set of states {ξ1, ξ2, .., ξr} the process moves successively from one state to another in so-called steps, and specifically from state ξi to state ξj with a probability
pij (transition probability) independent of the previous states of the chains, or
remains in the same state with a probability pii. A particular state is picked from Ξ as the initial state. Markov chains are usually depicted with a directed graph, where the edges’ labels denote the transition probabilities.
Markov models are widely used for analysing the web navigation of users. PageRank [45] is based on a Markov model and is used for ranking of infor-mation in the World Wide Web. By assigning weights that denote the relative importance of an hyperlinked document in a set of documents, the likelihood that a person will reach a specific page through random clicks is, essentially, represented.
In [160], Song et al. use a Continuous-Time Markov Chain Model (CTMC), namely a Markov model that describes the transition among states after some time of stay in a particular state. This time is exponentially distributed and does not affect the transition probability to the next state. The information diffusion model is introduced on a networkG(V,w,τ).Gcontains a setV ofnnodes and E edges between nodes representing the information diffusion paths. wdenotes the set of the edges’ weights (“amount of information to flow from one node to another”) and τ the set of the time delay on the information diffusion paths. Thus, the representation of the graph matches the CTMC in the notion that each node represents a state, each weight a transition probability and the delay is represented as the time-to-stay in each state.
Voter Model. The basic voter model introduced by Clifford and Sudbury [52]
randomly chosen neighbour. For a nodev∈V in graphG= (V, E),Γ(v) is the set of neighbors ofvin G and initially the nodes are arbitrarily endowed with a 0/1 state. At time step t each node adopts the opinion of one uniformly picked neighbour. With an initial assignment f0:V → {0,1} inductively we define
ft+1(v) =
1, with probability a
0, with probability b (3)
wherea= |{u∈Γ(v):ft(u)=1}|
|Γ(v)| andb= |{
u∈Γ(v):ft(u)=0}|
|Γ(v)| .
Even-Dar and Shapira [70] argue that it is one of the most natural prob-abilistic models to capture the information diffusion in a social network. It is suitable for depicting the spread of a technological product, as it is proved that under this model consensus is reached with probability 1. Even-Dar and Shapira refer to the (almost) consensus of products such as Google as a search engine, YouTube as a video-sharing website etc.
Models from Physics. Models from physics include the Ising model [97] serving
for the description of magnetic systems, and bootstrap percolation [16] serving for the description of magnetic systems, neuronal activity, glassy dynamics, etc. The Ising model [97] was first proposed in statistical physics and encompasses the notion of a ground state (in physics the state with the minimum energy), and that of the “self-optimizing” nature of the network.
Similarly to the basic voter model, there can be two competing “opinions”, in favour of or against a subject, let’s say depicted by a “+1” and a “−1”, which in physics express the correspondence of an atom forming a network to a spin variable (can be considered as the basic unit of magnetization) stateσi = ±1. The total energy of the system under this model (Hamiltonian) is defined as:
H =H(σ) =− <i,j>
Eσiσj−
i
J σi (4)
for each configuration σ = (σ1, ..., σN), with the parameter J associated with an “external magnetic field” andEwith the“nearest-neighbours interaction”,N
the number of the atoms. The ground state is the lowest energy configurationsg (in physics the zero temperature configuration), so thatsg∈argminsH(s). In a social network can be seen as the state with the most likely opinion, minimizing conflicts among its members (atoms).
Empirical Models. Before the advent of machine-readable traces, the potential of networks in the transmission of information and messages was stated already by Milgram in his renowned experiment [130] or Christakis [79], who suggested in a study of 12000 participants that risks, such as the risk of becoming obese or benefits, such as stopping of smoking, are propagated through social ties. However, it is large scale and time-resolved machine-readable traces that, through the step-by-step track of interactions in OSNs (although not compulsorily easily accessible/ collectible), have driven to the formulation of a plethora of empirical models.
Some generic observations concerning the empirical models are the following. Many of them lack insight of information content, unlike works, such as that of Huberman et al. [24], who formulate a model taking into consideration solely the features of an information item (a news item in Twitter). Sometimes the discovered patterns in empirical models are at odds with the predictions based on theoretical (analytical) models. For example, in unison with the epidemical model, Leskovec et al. in [119] claim that cascades (depicting the blogosphere information diffusion) are mostly tree-like. More specifically, they notice that the number of edges in the cascade increases almost linearly with the number of nodes, suggesting that the average degree in the cascade remains constant as the cascade grows (a trees property). Moreover, Leskovec et al. claim that these trees are balanced, as they notice that the cascade diameter increases logarithmically with the size of the cascade. In contradiction to the above, the trees derived from the chain-letter diffusion model of Liben-Nowell and Kleinberg in [121] are inconsistent with the epidemic model, as they are very narrow and deep, with the majority of their nodes having one child and a median distance from their root to the their leaves being of hundreds steps.
Precisely, in [121] the spread of a chain-letter is represented by a tree. Copies of the chain-letter represent paths through the tree, the root represents the originator and the leaves represent the recipients of a message (w is a child of v if w appends its name in the copy of the letter directly below v). In order to produce trees with the characteristics mentioned in the previous paragraph, the probabilistic model suggested (i) incorporates asynchrony: after receiving a message, each recipient waits for a time t before acting on it, and if it receives more copies of the item in this time interval, it acts upon only one of them, and (ii) encompasses a back-rateβ, as a node can either forward the message to its neighbours with probability 1−β or group-reply to his corecipients with a probability β.
As far as the seed users are concerned, the predictors used include: the num-ber of followers, numnum-ber of friends, numnum-ber of tweets and date of joining, and regarding the past influence of seed users: the average, minimum and maximum total influence and average, minimum and maximum local influence (local refers to the average number of reposts by a user’s immediate friends over a period of one month and total to the average total cascade size over that period).
Bakshy et al. [27] come to the conclusion that although large cascades have in their majority previously successful individuals with many followers as initia-tors, individuals with these characteristics are not necessarily bound to start a large cascade. Thus, because of the fact that estimations cannot be made at an individual level, marketers should rely on the average performance. By studying the return on investment, on the whole, with a cost function of the number of followers per individuali:ci=acf+ficf, where a is acquisition costcf cost per follower andfi is the number of followers, they conclude that relatively ordinary users of average influence and connectivity are most cost-efficient.
Content-related features are, also, according to Bakshy et al. not expected to discriminate initiators of large cascades from non-successful ones, due to the large number of non-successes. In order to take content into account, the regression analysis is repeated encompassing the following features: rated interestingness, perceived interestingness to an average person, rated positive feeling, willingness to share via email, IM, Twitter, Facebook or Digg, some indicator variables for type of URL, and some indicator variables for category of content.
Moreover, Lerman et al. [118] claim that exploiting the proximity of users in the social graph can serve as an adding-value factor for the prediction of infor-mation diffusion. They discriminate proximity as coming from conservative or non-conservative processes (denoting that the amount of spread information in the network remains or not constant, respectively). For the case the underly-ing network is not fully known [132], Najar et al. focus on predicting the final activation state of the network when an initial activation is given. They find the correspondence between the initial and final states of the network without considering the intermediate states. Their work is based on the analogy between predictive and generative approaches for discrimination or regression problems (predictive models depicting a better performance, when the real data distribu-tion can’t be captured).
In [174], Yang and Leskovec use a time series model for modeling the global influence of a node through the whole network. For each node u, an influence function Iu(l) is the number of mentions of an information l time units after the nodeuadopted the information (attu), and withV(t) being the number of nodes that mention the information at time t, it applies:
V(t+ 1) = u∈∈A(t)
Iu(t−tu) (5)