2016 International Conference on Computational Modeling, Simulation and Applied Mathematics (CMSAM 2016) ISBN: 978-1-60595-385-4
Web System for CFD Pedestrian Wind Simulation and Assessment
Jenmu WANG
1,2and Cheng-Hsin CHANG
1,2,*1
Department of Civil Engineering, Tamkang University, New Taipei City, Taiwan
2Wind Engineering Research Center, Tamkang University, New Taipei City, Taiwan
*Corresponding author
Keywords: Computational fluid dynamics, Pedestrian wind, Online.
Abstract. This paper reports the development of a web-based wind environment simulation and
pedestrian wind assessment system using computational fluid dynamics (CFD). Graphical user interfaces were built using Internet browsers to link to the server side CFD programs, which hides the complexity of CFD programs and makes the tool accessible to engineers at the early architectural design stage for quick evaluation of wind field around buildings. The paper describes the system function and architecture, case testing and comparison, and possible future improvement and expansion.
Introduction
The concept of the research is derived from the project-Wind, which was proposed by the Wind Engineering Research Centerat Tamkang University (Cheng et al., 2008). e-Wind aims at providing wind engineering computing, data analysis and other application services on the Internet. A recent developed system for online pedestrian wind assessment is reported in this paper.
In order to provide computational fluid dynamics (CFD) services on the Internet, a user-friendly graphical user interface is crucial. Therefore, hiding the complexity of CFD programs and making them accessible to engineers at the preliminary design stage are the objectives of this study. With appropriate IT and networking technologies, Internet browsers can be used to establish CFD analysis models and perform remote CFD software calculations to obtain wind environment data at the pedestrian level around buildings. Lastly, the distribution of wind speeds can be shown on browsers with hazard spots identified.
This approach dramatically reduces the time spent for wind field assessment and allows quick simulation and evaluation of alternatives at the architectural design stage. The system can also be used as a graphic aid for student to learn the phenomenon of wind environment around buildings.
System Design
Wind environment in dense developed urban area is a serious problem. There are so many variables that influence the wind environment conditions around buildings. According to the vision of e-wind for online computational fluid dynamics calculations, the goal of this project is to develop a web-based pedestrian wind simulation and assessment system, which can be used for city planning and preliminary building designs.
CFD programs usually require large computing resources and highly skilled engineers to operate. How to improve their accessibility and lower hardware and software barriers are major objectives of this study. A good strategy to achieve these goals is to use client-server architecture to host CFD programs on the servers and provide services online. Also, an easy-to-use operating interface and easy-to-understand graphical outputs are crucial.
System Requirement Analysis
Internet Browser Based User Interface
Using web browsers to operate the pedestrian wind assessment system requires no training for the users. Users are familiar with the operation of browsers, and they are readily available and cross platform. Also, no dedicated software needs to be installed on the user computers.
Unified Network Platform
To reduce the complexity of the system and avoid future administrative problems, XAMPP was selected early in the project. XAMPP integrates Apache HTTP server, MYSQL, HTML and PHP to form an easy-to-operate platform with many convenient network services.
Integrated Calculation and Graphic Functions
The web programming language PHP provides the basic numerical calculation essential for pre-processing the data before calling the stand-alone CFD program, and the graphic generation functions are supported using PHP graphic statements and extension packages.
System Architecture
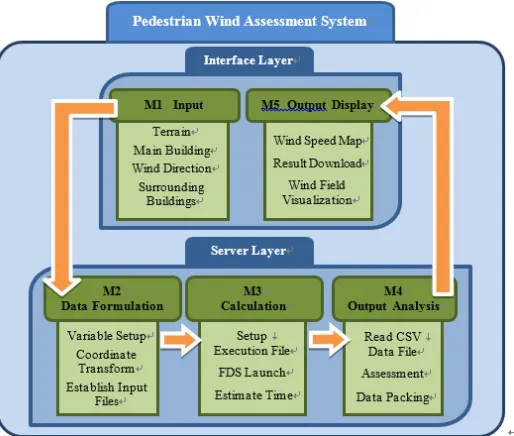
According to the goal and analysis of the previous section, the study set up an online pedestrian wind assessment system with two layers of software structure, namely interface layer and server layer. According to the functional requirement of the system, the 2-layered architecture can be further divided into five program modules, which are input module, data formulation module, calculation module, output analysis module and output display module. Figure 1 shows the 2-layered architecture with the five modules and the control flow of the program.
Interface Layer
The major functions of the layer are building information input and simulation result display. M1 is the data input module, which is coded with dynamic web pages. The geometry of the main building under investigation and its adjacent buildings can be supplied with graphic building layout information displayed. The current implementation is limited to rectangular main and surrounding buildings.
[image:2.612.181.438.499.717.2]M5 is the output display module. The results of CFD analysis can be downloaded from the server and summarized on web pages. Important functions of M5 include drawing 2D wind speed maps and showing 3D wind velocity profiles.
Server Layer
This is the application layer, which provides the pre and post processers for running the associated CFD program. The range of applications that the system can provide depends on the program design and development of this layer. All the low level network connection and file transfer functions are coded in this layer.
M2 is the data formulation module responsible for generating the CFD program input files required. The data collected from the M1 input module needs to be processed and translated to the dedicated format of the linked CFD program.
M3 is the calculation module. It setup the execution environment and activates the required CFD program on the server. Detailed multi-project identification and program runtime locking are handled in this module.
M4 is the output analysis module, which reads the output files after the execution of the CFD program. Designated dada, such as wind speed and node, is searched and processed for the requirements of assessment and display.
System Implementation
The system was implemented using PHP language onan Apache HTTP Server with JpGraph plotting extension package. The CFD software on the server layer is Fire Dynamics Simulator (FDS). The results of executing FDScan be read and displayed as wind speed contour maps of the computational domain. Smokeview (SMV) program and data can also be downloaded from the server to visualize the development of wind field. FDS and Smoke view are free and open-source software tools provided by the National Institute of Standards and Technology (NIST) of the United States Department of Commerce.
The computational domain, grid setup, boundary condition and turbulence modelling of our CFD simulation are based on the suggestions from AIJ for applying CFD to pedestrian wind environment (Mochida et al., 2002, Shirasawa et al., 2003 and Yoshie et al., 2006)as well as our own experiments and studies (Wang 2010). The basic setups for our FDS applications are as follows:(a) Computational domain is 6H×6H×5H, where H is the height of the main building; (b) grids are 60 by 60 in the xy-plane and 200 in the z-direction; (c) boundary layer wind field and 10 m/sec wind speed are used; (d) time step is 0.1 seconds.
System Demo
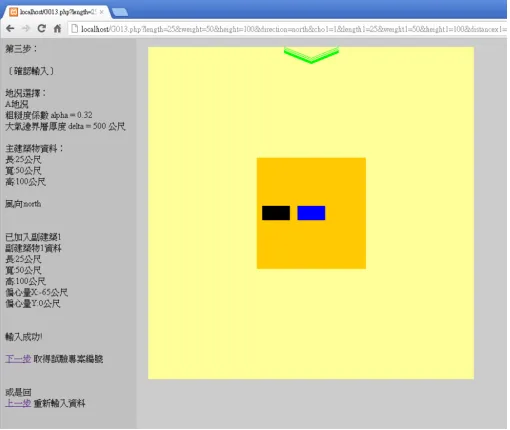
A test case is provided in this section to demonstrate the operation of the system. The main building is located at Terrain A with a rectangular cross section of 25m x 50m and a height of 100m.An interfering building of the same size is 15m to the left of the main building. A typical run of the system consists of the following steps:
Problem Information Input
The three input pages for the test case are shown in Figure 2. Information required includes the terrain of the building site, the sizes of the main and surrounding buildings and the position of the adjacent buildings. As indicated in Figure 2 (b), the system is limited to 4 surrounding buildings for the current implementation.
Data File Generation
Case ID is automatically generated and saved in web browser cookies, which can be used to name files, create a working folder and identify related data throughout the run. This is important for the system to operate in the web environment with multiple projects.
FDS Calculation
pushes the execution button on the web interface, FDS launches and an estimated computing time is given. The program runtime for the test case is about 65 minutes on a 3 GHz IntelPentium 4 computer. A popup window will show up when the program finishes.
Output Analysis
The results of FDS analysis is saved in csv format text files. Our system reads all the data and put values in matrix variables in order to search for the maximum wind speed and calculate the average wind speeds as well as their location in the domain.
Wind Speed Contour Map Display
Users have the option to plot the wind speed contour map online for comparison as shown in Figure 3. The size of the contour map is 200m by 200mcentered on the main building.
Data Download and Smokeview Simulation
Smokewiew program and all the visualization files can be packed on the server and downloaded to user’s computer by clicking the download button. After the installation of Smokewiew, the wind velocity profile can be viewed at the user side. For example, the simulation at 45 seconds is shown in Figure 4.Compared with Wang (2010), the difference is small mainly resulted from the smaller computing domain, different position of the buildings and shorter time length.
[image:4.612.183.438.314.529.2]Figure2. Input verification (noted that GUI is in Chinese).
(a) (b)
Figure 4. (a) Smokeview simulation of the test case; (b)result from reference case Wang (2010).
Conclusions
The implementation successfully developed an online CFD pedestrian wind environment simulation and assessment system, using XAMPP web server package and NIST’s FDS program. In order to get fast online response, the size of the domain and grids are specially chosen to avoid long program execution time. User defined computational grid setting can be added to make the system more flexible. Although the accuracy of the system is not fully validated, preliminary comparisons of cases from the reference paper show the trend is the same. More wind tunnel test verifications are required in the future. It needs to be noted that the system is not a replacement for wind tunnel tests. It is mean to be a quick evaluation tools at the early design stage to locate possible pedestrian wind safety problems.
Acknowledgements
Financial supports for this research from National Science Council of ROC and Wind Engineering ResearchCenterat Tamkang University Taiwan (WERC-TKU) are gratefully acknowledged.
References
[1] Cheng, C.M., Wang, J., Chang, C.H. (2008). e-wind: An integrated engineering solution package for wind sensitive buildings and structures. Journal of Wind & Engineering 5(2), 50-59.
[2] FDS-SMV, http://fire.nist.gov/fds/documentation.html, accessed February 2014.
[3] JpGraph - Most powerful PHP-driven charts, http://jpgraph.net/, accessed February 2014.
[4] Mochida, A., Tominaga, Y., Murakami, S., Yoshie, R., Ishihara, T., Ooka, R. (2002). Comparison of various k–e models and DSM applied to flow around a high-rise building, Report on AIJ cooperative project for CFD prediction of wind environment. Wind Struct. 5 (2–4), 227–244.
[5] PHP: Hypertext Preprocessor, http://php.net/, accessed February 2014.
[6] Shirasawa, T., Tominaga, T., Yoshie, R., Mochida, A., Yoshino, H., Kataoka, H., Nozu, T. (2003). Development of CFD method for predicting wind environment around a high-rise building part 2: the cross comparison of CFD results using various k- models for the flow field around a building model with 4:4:1 shape. AIJ J. Technol. Des. 18, 169–174 (in Japanese).
[image:5.612.109.505.63.244.2][8] Yoshie, R., Mochida, A., Tominaga, Y. (2006). CFD prediction of wind environment around a high-rise building located in an urban area: Proceedings of the Fourth International Symposium on Computational Wind Engineering.