ISSN Online: 2151-1969 ISSN Print: 2151-1950
Flood Forecasting GIS Water-Flow
Visualization Enhancement
(WaVE): A Case Study
Timothy R. Petty1, Nawajish Noman2, Deng Ding2, John B. Gongwer3
1Department of Civil and Environmental Engineering, University of Alaska Fairbanks, Fairbanks, AK, USA 2Esri, Redlands, CA, USA
3iCatalyst, Washington, DC, USA
Abstract
Riverine flood event situation awareness and emergency management decision sup-port systems require accurate and scalable geoanalytic data at the local level. This paper introduces the Water-flow Visualization Enhancement (WaVE), a new fra- mework and toolset that integrates enhanced geospatial analytics visualization (common operating picture) and decision support modular tools. WaVE enables us-ers to: 1) dynamically generate on-the-fly, highly granular and interactive geovisual real-time and predictive flood maps that can be scaled down to show discharge, in-undation, water velocity, and ancillary geomorphology and hydrology data from the national level to regional and local level; 2) integrate data and model analysis results from multiple sources; 3) utilize machine learning correlation indexing to interpolate streamflow proxy estimates for non-functioning streamgages and extrapolate dis-charge estimates for ungaged streams; and 4) have time-scaled drill-down visualiza-tion of real-time and forecasted flood events. Four case studies were conducted to test and validate WaVE under diverse conditions at national, regional and local le-vels. Results from these case studies highlight some of WaVE’s inherent strengths, limitations, and the need for further development. WaVE has the potential for being utilized on a wider basis at the local level as data become available and models are va-lidated for converting satellite images and data records from remote sensing tech-nologies into accurate streamflow estimates and higher resolution digital elevation models.
Keywords
Geovisualization, Riverine Flooding, Geoanalytics Forecasting, Machine Learning, Emergency Management Decision Support
How to cite this paper: Petty, T.R., No-man, N., Ding, D. and Gongwer, J.B. (2016) Flood Forecasting GIS Water-Flow Visuali-zation Enhancement (WaVE): A Case Study.
Journal of Geographic Information System, 8, 692-728.
http://dx.doi.org/10.4236/jgis.2016.86055 Received: October 2, 2016
Accepted: December 19, 2016 Published: December 22, 2016 Copyright © 2016 by authors and Scientific Research Publishing Inc. This work is licensed under the Creative Commons Attribution International License (CC BY 4.0).
1. Introduction
In order to make effective decisions, first responders and other key local level decision makers involved in riverine (channel) flood emergency management require both timely ground-level and contextualized flood information and the means of making sense of and drawing insight from that information.
Local decision makers formulate and implement plans and anticipate and respond to flood events based on many hydrologic factors, but the most critical decisions are de-pendent upon an awareness of the three variables of knowing when (historical, real- time and forecasted times), where (temporal location of stream flow and inundation), and how much (depth, volume and inundation extent, velocity) the flooding is occur-ring or will occur. For true situational awareness, decision makers need to know when and where the rising rivers will occur or are occurring, what depth the inundation is at locations of concern, what points, places and people of interest are being affected, and where potential access and evacuation routes and directions exist for first responders.
Despite technological advances and new research in areas related to flood analysis and decision-making, challenges remain, particularly in the area of providing accurate streamflow and flood inundation data for remote and/or ungaged streams, developing high resolution digital elevation models for producing highly granular and locally scal-able geovisual flood maps (real-time and predictive), and delivering reliscal-able, useful flood data to local decision makers during flood events [1]. Even when these complex issues are addressed, the challenge remains of making sense of large amounts of data in such a way as to be easily understood and effectively utilized by individual practition-ers, while at the same time providing a common operating picture and knowledge framework across the various groups involved in flood emergency management.
In this article, we introduce and test Water-flow Visualization Enhancement (Wa- VE), a new geospatial visualization framework and decision support (DS) toolset de-signed for first responders, water resource managers, scientists and other decision makers. WaVE’s extensible and flexible framework and toolset transforms historic, real-time and forecasted streamflow and flood inundation data into accurate actionable intelligence, enables down-scaled geospatial analysis and visibility, and provides users with easy-to-use and customizable DS tools.
The following sections of this article 1) provide background information on flood geospatial analytics and decision support; 2) describe the three development phases of the WaVE design framework, the future development of the framework for enhancing the platform, review case studies that test and demonstrate WaVE’s capabilities; 3) dis-cuss issues and implications of results from the model and the case study; and 4) sum-marize the authors’ conclusions.
2. Background
2.1. Flood Data—Where, When & How Much
managers and first response emergency management teams.
The first group, floodplain and water resource managers, require this data for effec-tive planning and operations. They gather and assimilate data from research scientists, issue warnings and alerts, create emergency plans for flood scenarios, communicate flood stages to the community, and create predictive models. Water resource managers, such as those from the US Army Corps of Engineers (USACE), use flow data and preci-pitation predictions for such flood mitigation activities as managing flood control re-servoirs, floodway outlets, diversions, levees, and navigation locks. They need timely and accurate forecasts and flow data to predict inflows to reservoirs and pool elevations in order to determine downstream discharge, as well as to make daily decisions regard-ing adjustment of water elevation levels in reservoirs to minimize downstream floodregard-ing and maximize storage [2].
Similarly, first responders and emergency management operations—both before and during actual flooding events—rely on historical and real-time water elevation, time, and water velocity data for situational awareness and executing such emergency opera-tions as fighting floods, evacuaopera-tions, closing bridges and roads, etc. When and how these tasks are implemented can determine the degree to which lives and property are saved [3] [4].
For these groups, time sensitive decisions are often based on information and attributes related to fluctuations in channel and flood water. The elevation and volume of water flow within any watershed basin typically fluctuate in accordance with such weather events and variables as melting snow, rain, surface runoff (the flow over the earth’s surface of excess water from storm water, snowmelt or other sources), subsur-face flow, and in regulated streams by such variables as dams, storage reservoirs, and levees. Heavy precipitation and snowmelt runoff in upstream areas of a catchment can cause high water volumes in river streams, full capacity in river reservoirs, and riverine flood inundation (i.e., extending beyond its channel boundaries) of normally dry areas. The extent of flood inundation is influenced by such factors as channel depth, volume-tric discharge, stream velocity and geomorphological features outside of the channel.
Two hydrologic data parameters—water elevation and time—are essential for ad-dressing these issues. Using these two fundamental pieces of geospatial information, hydrologists can calculate: 1) the volume rate (Q) of water flow (also referred to as str- eamflow, discharge or flow rate) in a channel—calculated as the product of a cross-sec- tional area (A) and the mean velocity (ū) of a stream, and typically expressed as cubic feet/second (f3/s) or cubic meters per second (m3/s); and 2) the inundation of water that
extends outside of normal channel banks.
8000 streamgages throughout the US.
2.2. Flood Mapping
Different models and measurement tools historically have been used to identify or pre-dict flood situations that occur in a variety of geographical and topographical land-scapes. These have ranged from traditional static flood maps, historical flood tables, datasets and statistics developed by analysts and cartographers, to newer tools that le-verage developments in digital elevation and terrain that feature modeling, geospatial analysis and geovisualization, and that integrate hydraulic models with visualized geospatial data and interactive flood maps. Analysts and planners can use digital inun-dation maps overlaid on city maps and combined with other overlaid geographic in-formation systems (GIS) layers to assess potential flood risks and damages. These tools are used to help predict flood occurrences and inundation extent, achieve situational awareness during events, and communicate risks and consequences of current and pre-dicted flooding.
Digital maps are created by superimposing “layers” of pixel or raster-based images that represent geocoded geomorphological features on “top” of digital elevation models (DEMs)—digital models or three-dimensional representations of terrain surfaces [5]. These models are developed using terrain elevation data acquired and recorded by such means as direct land surveys, remote sensing, and photogrammetry. Some earlier coarse resolution DEMs were interpolated from digital contour maps based on direct land surveys, although increasingly these models are higher resolution and generated from remote sensing.
Modern hydrological flood mapping models combine data from historic flood inun-dation maps with real-time data to predict inuninun-dation of current and future flood events. To visualize flood data, a hydraulic model is combined with a digital ground surface elevation model according to a grid cell layout, whereby the digital representa-tion of the elevarepresenta-tion of surface water is overlaid onto a time-sequenced digital repre-sentation of ground surface elevation in a geospatially corresponding grid area to de-termine how far flooding will extend beyond normal channel banks. Inundation extent is then calculated for each grid cell.
The vertical accuracy and spatial resolution (ground surface area within a grid cell) of the base DEM (primary topography) influences the degree of accuracy of hydraulic models and flood maps [6]. The higher the number of cells in a unit area, the greater the resolution and scalability (i.e., the finer the resolution of rasterized data at smaller distances from ground surface elevation, the more accurate the representation of gro- und surface topography).
ap-plications. This method uses such sensing instruments as infrared and film photogra-phy to gather and record information about the radiation (from the sun or other sources) reflected or emitted by the target area or object. The reach and options of pas-sive RS increased significantly with the launching of Landsat in 1972 and the advent of satellite platform-based RS. By contrast, active sensors emit energy to detect remote targets and then measure the radiation reflected back or backscattered from those tar-gets. Advances in active RS using satellite, airborne and terrestrial altimetry technolo-gies have led to increased insights into river flow dynamics and provide alternatives to traditional methods.
Hydrological model-based analysis used in flood forecasting and building static ha-zard maps for situational awareness historically have been dependent on discharge data from in situ streamgage networks. While foundational to much of hydrologists’ under-standing of surface water, gage networks are limited in the information they can pro-vide about local floodplain flow and watershed dynamics. During a flood event, these in situ sources provide only a one-dimensional, point-based set of surface water data [7], without addressing the additional challenge of extrapolating downstream volume after the water passes the monitor and predicting what the water will do if it rises and ex-tends beyond its normal channel. The limited availability of in situ streamflow mea-surement resources hampers flood detection in river areas and restricts the ability to validate real-time flood forecasting models [8]. Furthermore, these streamgages are physically vulnerable and can stop transmitting critical flood water data during storm events or at other critical times.
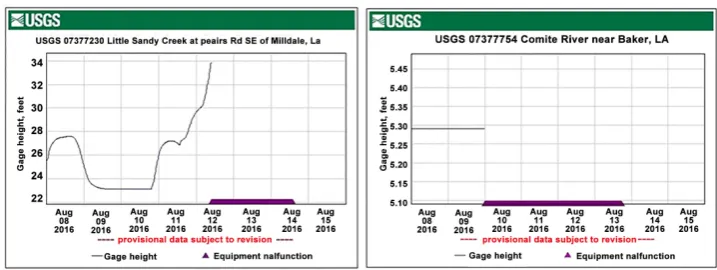
This risk was illustrated in the August 2016 flood event in Baton Rouge, Louisiana. During the floods, 15 USGS streamgages were damaged or destroyed [9]. For three key days during the storm, stations in critical locations stopped sending vital near real-time data to first responders (see Figure 1) who relied on the data for situational awareness about the rising of the river, warning and evacuating at-risk people, and taking steps to protect property [10].
These risks are among the reasons that RS is increasingly being advocated as a com-plement to in situ streamflow measurement and for providing vital data where no streamgages exist [11] [12] [13]. This interest is reflected in the growing body of re-search related to validating inundation maps used during actual flood events, RS mod-els and applications, techniques for working alongside in situ methods, and building proxy streamflow measurement models [14] [15] [16] [17] [18].
Figure 1. USGS hydrographs from the National Streamflow Information Program illustrating the streamflow condition and equipment malfunction during the August 10-15, 2016, Baton Rouge, LA, flood event. http://waterdata.usgs.gov/la/nwis/rt.
satellite altimeters [23] [24] [25] correlate well with in situ streamflow and are suitable for analyzing and predicting streamflow and flood events at national and regional scales.
The demand for higher spatial resolution, accurate DEMs, and hydraulic and channel flow routing model output that can be scaled from the regional to local level, has spurred the growth of related research and applied resources. In the US, an important step toward this goal is the continual development and enhancement of The National Map (TNM), the collaborative effort of USGS and its partners to provide publicly-av- ailable digitized topographic data—elevation, boundaries, transportation, structures, land cover, geographic names, hydrography, aerial photographs, etc. In 2011, the US Government completed the National Enhanced Elevation Assessment, a result of which is the 3D Elevation Program (3DEP), an initiative launched by the USGS. Its initial ser-vices and products begun in 2015, 3DEP collects and adds to the seamless layers of TNM’s high-quality topographic and enhanced elevation light detection and ranging (lidar) data for the coterminous United States, Hawaii and the US territories, and in-terferometric synthetic aperture radar (InSAR, or commonly abbreviated as IfSAR) da-ta for Alaska [26].
IfSAR, on the other hand, is an active RS technology generally used in places like Alaska, where cloud cover and the remote locations of target areas make the use of lidar less effective and relatively impractical. Radar from satellites can penetrate overcast weather and provides valuable continued round-the-clock imagery during storm events
[29]. This active sensing technique combines two or more synthetic aperture radar (SAR) images that are derived from recording the stereoscopic effect caused by the dif-ferences in the phases of radiation waves that return from the target area after it is struck by a narrow radar beam transmitted from an antenna on a satellite platform- based sensor.
In addition to lidar and IfSAR, other laser scanning (LS) technologies for airborne (ALS), mobile (MLS) and set-terrestrial (TLS) laser scanning platforms are also being developed for flood mapping support [30].
A growing body of research studies has focused on flood impact at the regional wa-tershed level, some of which have analyzed the results from RS flood extent and in situ streamflow measurements [19] [31]. Other research has explored the use of data from multispectral and microwave sensors to supplement in situ stream data [32]. Some stu-dies have explored the use of inundation maps derived from higher resolution images to ground truth, while others have focused on testing and validating the accuracy and effectiveness of using RS image datasets for flooding events and inundation maps [33] [34] [35]. Once RS images and derived data are recorded, it greatly impacts the efficacy of the tool for measuring real-time, local impact during flood events, given that satel-lites used for those events may not be at the optimal location for the right times and durations required for best coverage. Despite these limitations, streamflow time series from simulated satellite RS models have been developed, tested, and are starting to im-prove flood inundation maps [1] [36] [37].
2.3. Flood Data Visualization for Decision Support
Streamflow and flood inundation data from traditional and RS sources can be analyzed and visualized using either stand-alone flood mapping tools or those integrated into sets of other emergency management decision support systems (EMDSS)—compute- rized or hybrid human and computer-based information systems used by organization-al management to facilitate the solving of unstructured and partiorganization-ally-structured prob-lems and making decisions related to planning, management, and operations processes
technologies to assist practitioners in these areas.
The development of EMDSS has been further enabled by advances in data storage, retrieval and processing technologies that greatly increase the potential accuracy and efficiency of these systems. Technologies now exist for creating platforms that can combine many different data sources (including discharge data derived from such ac-tive and passive remote sensors as lidar and acac-tive sensor SAR), compute billions of da-ta elements to identify multivariate correlations across diverse environments, analyze and multi-scale that data, and transform that data into customizable and visualized knowledge needed by decision makers.
One area of significant growth in the past few years is the processing of “big da-ta”—data sets that are too large for computation by traditional computing. It is esti-mated that since the 1980s the world's per-capita capacity to store data has doubled every 40 months [43]. Large data sets related to streamflow and flood inundation, plus myriad ancillary emergency management data that in the past required the computing power of supercomputers, can now be processed by running massively parallel software on tens-to-thousands of powerful and smaller servers in multiple locations, all linked together in a “grid”. These grids form virtual supercomputers that can also utilize “cloud computing”—remotely-located shared processing and storage resources for computers and applications that are available on-demand from anywhere for customers with high-speed Internet connections.
This rapid growth in available and interrelated data and the need to process and make sense of it all has overwhelmed traditional data analysis methods. A promising area being explored as a potential solution is machine learning, a developing field of study of how computers can learn without explicit programming—a type of artificial intelligence whereby computers assimilate data and then use algorithms to make in-creasingly accurate predictions as they are exposed to new data [44]. A growing number of researchers are studying how machine learning can be applied to hydrology [45] [46]. Even with the use of machine learning and other means to analyze large amounts of statistical and other structured data, there still remains the challenge of presenting analytic results in such a way as to be easily accessible and understood, both by analysts and by decision maker practitioners.
comput-ers with the exploration (finding, action) and verification (insight, hypothesis) loops of knowledge generation [49].
The integration of flood maps with other tools are examples of a subset of informa-tion visualizainforma-tion and visual analytics called geovisual analytics (or geospatial visual analytics)—a multidisciplinary field that seeks to develop new approaches to solving complex problems related to geographical space and objects, events, processes and phenomena within that geo-temporal context [50]. It is multidisciplinary in that it combines information, scientific and geographical visualization with the computational processing capabilities of statistical analysis and modeling, machine learning, data min- ing, and geographical analysis and modeling [51].
3. Methods
3.1. WaVE Design Framework
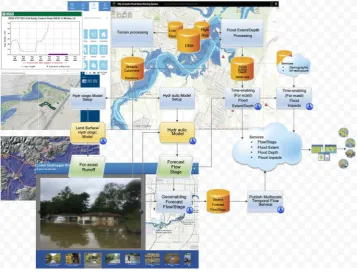
In response to the need for visualizing and making sense of flood water and related impact factors, WaVE is being designed and developed in collaboration with and for first responders, water managers and other decision makers to provide flood decision makes with a common operating picture and decision support. It consists of a geospa-tial analytics visualization framework and DS toolset (currently under development) that transforms historic, real-time and forecasted streamflow and flood inundation data into accurate analytic results, down-scaled visibility, and customizable DS tools. The geospatial design, research and testing for the study areas are performed and developed using an Esri ArcGIS (Version 10.3) platform.
WaVE’s extensible and flexible framework and toolset is designed to provide users with easy-to-use and customizable tools to:
• Generate moderate to highly granular and interactive geovisual real-time and
predictive flood maps that can be scaled down to show discharge, inundation and water velocity (and ancillary geomorphology, hydrology and elevation data) at any point along a mapped stream at the national and regional levels, with some loca- tions providing enough high resolution data to enable maps to also be available on a local level.
• Integrate data from multiple sources and analysis results from commercial, open
source or user’s own tools and models.
• Utilize machine learning correlation indexing to interpolate streamflow proxy
estimates for non-functioning streamgages and extrapolate discharge estimates for ungaged streams, while also providing a streamflow baseline to use computational analysis to test and rate the degree of reliability of the various geospatial data sources and forecast estimates being analyzed.
• Supply ancillary GIS data visualization of environmental features, alternate evacu-
ation routes, city and community analysis of socio-economic demographics, webcams, points of interest, e.g., residences, schools, roads, hospitals (see Figure 2).
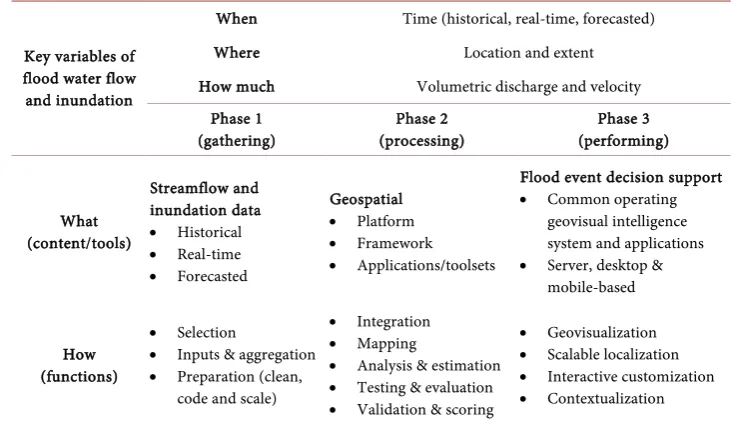
and 3) performing. These three phases are described in Table 1.
3.1.1. Phase 1—Gathering
The first phase consists of selecting, aggregating, and preparing historical, real-time and forecasted streamflow and inundation data.
Selection
[image:10.595.194.554.213.418.2]The first phase begins by selecting the primary historical and forecasted streamflow and flood inundation datasets WaVE will use for preparing its baseline analyses, model results, estimate comparisons, and geovisual tools. WaVE develops its baseline datasets
Figure 2. An example of ancillary flood data that can be integrated into WaVE—screenshot of an
interactive June 2016 Texas flooding ArcGIS Story Map, showing Civil Air Patrol flight path with clickable markers of aerial reconnaissance photos of flood area.
Table 1. Key variables and three phases of the WaVE design process polygons.
Key variables of flood water flow and inundation
When Time (historical, real-time, forecasted) Where Location and extent How much Volumetric discharge and velocity
Phase 1 (gathering)
Phase 2 (processing)
Phase 3 (performing)
What (content/tools)
Streamflow and inundation data
• Historical
• Real-time
• Forecasted
Geospatial
• Platform
• Framework
• Applications/toolsets
Flood event decision support
• Common operating geovisual intelligence system and applications
• Server, desktop & mobile-based
How (functions)
• Selection
• Inputs & aggregation
• Preparation (clean, code and scale)
• Integration
• Mapping
• Analysis & estimation
• Testing & evaluation
• Validation & scoring
• Geovisualization
• Scalable localization
• Interactive customization
[image:10.595.187.554.491.702.2]from historical and forecasted data derived from weather forecasts provided by the fol-lowing American and European forecasting modeling systems: the US Weather Re-search and Forecasting Hydrological (WRF-Hydro) model and the European Centre for Medium-Range Weather Forecasts (ECMWF) model. In Phase 1, WaVE begins build-ing its baseline by gatherbuild-ing datasets from either WRF-Hydro or ECMWF to complete the baseline of its framework.
For coverage of the US, WaVE uses historical and forecasted gridded discharge and inundation data from WRF-Hydro. This modeling extension package was developed by the federally funded US National Center for Atmospheric Research (NCAR) and its re-search partners, and through affiliated rere-search projects.
WRF-Hydro is both a community-based and supported stand-alone hydrological modeling system and coupling architecture designed to link multi-scale process models of the atmosphere and terrestrial hydrology on different spatial grids, as well as to pro-vide accurate and reliable streamflow prediction across scales. WRF-Hydro integrates the following hydrological models: column land surface models, terrain routing models (overland, subsurface flow modules), and channel and reservoir routing models (hy-drologic and hydraulic modules). WRF-Hydro receives data (one-way coupling) from gridded meteorological analysis models, nowcasts and forecasts, as well as data (two- way coupling) from weather and climate predictions—using Multi-Radar/Multi-Sensor System radar-gauge observed precipitation data, High Resolution Rapid Refresh, Rapid Refresh, and Climate Forecast System forecast data. It also receives critical numerical prediction results from the global computer models and variation analyses of the Nu-merical Weather Prediction and US National Weather Service's Global Forecast System (GFS).
Within WRF-Hydro, the GFS model is essential for the forecasting component for WaVE as it generates medium-range forecasts every six hours for up to 16 days out, with decreasing resolution after 10 days. WRF-Hydro inputs this data using its driver and data assimilation tools, and then processes this data, conservatively regridding and downscaling as needed for use in its various models. The WRF-Hydro system features possible component configurations for streamflow prediction, including 5 channel flow schemes [52]. As described later, one of these, RAPID-Muskingum for NHDPlus, is used by WaVE.
require more computational resources, whereas the ensemble forecasts use a variation of Monte Carlo analysis and generate a representative sample of possible forecast pre-dictions by running the model 51 times in parallel under slightly different initial condi-tions [54]. ECMWF makes publicly available some of the IFS model’s most important forecast data and calculations, which can be incorporated into WaVE.
Both the ECMWF [55] and WRF-Hydro systems provide precipitation forecasts and precipitation runoff predictions that are plotted according to a geospatial grid, trans-forming rainfall runoff forecasts from weather-hydro forecast models into gridded streamflow (discharge) runoff predictions and inundation forecasts [56] [57].
Input and aggregation
To input gridded discharge runoff and inundation prediction data, WaVE creates connectivity files and inflow files from ECMWF and WRF-Hydro runoff database tables, and then creates RAPID-Muskingum parameter files and subset files.
Data downscaling and preparation
Because gridded forecast data from ECMWF and WRF-Hydro are provided at the global or regional level, there is a spatial resolution gap between the forecast values and local impact assessments. Even if one can zoom in to see higher resolution of surface areas or objects within a grid cell, there is still only one forecast for the entire area, thus potentially providing a completely inaccurate runoff prediction at the local level. As the highest resolution global model is neither detailed enough nor scalable, its usefulness at the local level is significantly limited [58]. Since the global model result cannot be used directly, this spatial resolution gap needs to be bridged so that the scaled forecast values can correspond to the local level resolution [59].
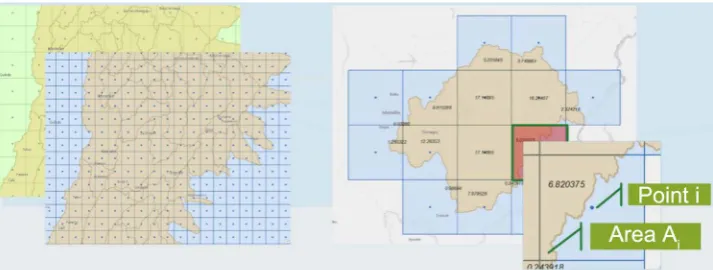
WaVE framework tools bridge the spatial resolution gap by downscaling the fore-casted streamflow runoff and inundation data from the global and regional models for later input into flow routing models. Downscaling is a two-step process (see Figure 3) using Python Geoprocessing Workflows: 1) Create weight table by overlaying catch-ments on a computational grid, and 2) Create inflow file by computing the weighted average runoff for each catchment. Dividing the downscaling process into two steps in-creases efficiency because once the weights are computed and the table created (the most time consuming part of the conversion and downscaling process), these weights can be reused with a new forecast.
eleva-tion data using a web service. As shown in Figure 4, forecast data are then run through a series of geoprocessing operations to spatially overlay the gridded runoff forecast (at the top) with the watershed polygons (at the bottom), and the total runoff per water- shed is summarized for each time step.
The grid cells associated with each catchment are identified and calculated using NHDPlus hydrological flow characteristics and terrain surface and digital elevation da-ta. Each grid cell is given a relative weight (W) assigned at each geospatial gridded cell point (i) where the total area (Ai) of each cell is divided by the catchment area (Acat-chment) (see Equation 1).
i i catchment
W =A A (1)
A collection of open source Python script tools (which can be extended or modified to support other types of runoff or forecast data) are then used to store the identifica-tion of the catchment, cells they fall into, and the associated weights in a file. This file serves as the weight table used in the second step of the downscaling process.
Total runoff is then calculated using the appropriate weights divided by the areas of the contributing points.
[image:13.595.244.504.364.518.2]The second step consists of creating an inflow file for the model forecast by compu-ting weighted average runoff for each catchment. To do this, the WaVE tool extracts
Figure 3. The two-step downscaling process.
[image:13.595.196.553.550.685.2]forecasted runoff time series (for all time steps) from each grid cell associated with a respective catchment, multiplies them by the appropriate weight (or area) to generate Q, or river discharge, and then adds all the grid cells. As shown in Equation (2), the to-tal runoff (Runofftotal) for the combined catchment areas of all cells is equal to the sum
total of all the cells (∑) of cell grid runoff (Runoffi) multiplied by the weight (Wi) for
each cell grid point (i), and multiplied by the catchment area (Acatchment) for each cell
Equation (2).
(
)
total
Runoff =
∑
Runoffi× ×Wi Acatchment (2)The process is repeated for all catchments. This step results in the weighted inflows that can be used to map streamflow and inundation.
3.1.2. Phase 2—Processing
Once prepared, in Phase 2, WaVE processes and integrates the data with results and output from other hydraulic and analytic models, estimates forecasts, analyzes, tests and evaluates results, and validates and scores results for accuracy and uncertainty.
Integration
In order to analyze and geovisualize the prepared data, WaVE integrates and utilizes a variety of existing open source, public and commercial hydraulic, geospatial analytic, machine learning algorithms, and geovisualization models and tools. As discussed later, WaVE’s flexible framework allows it to easily add and integrate new and existing tech-nologies from its geospatial application toolbox.
Weighted inflow data from processed historical, real-time and forecasted streamflow runoff in Phase 1 can then be visualized by computing discharge and choosing selec-tions from flow routing models. Once it is known how much water runoff comes from each watershed at each time step, WaVE models the flow routing in catchments using the Routing Application for Parallel Computation of Discharge (RAPID).
For flow routing of water networks within the United States, RAPID utilizes the NHDPlus dataset, an integrated geospatial hydrologic framework and datasets built by the US Environmental Protection Agency and US Geological Survey. NHDPlus com-bines the vector National Hydrology Dataset (NHD) stream network and Watershed Boundary Dataset (WBD) hydrologic unit boundaries, together with the National Ele-vation Dataset (NED) gridded land surface, to show each NHD stream segment’s local catchment area. A catchment area layer contains water flowline, sink-points, area fea-tures and bodies of water. NHDPlus produces the stream network datasets’ flowline attributes using five flow estimation models.
The first version of NHDPlus (NHDPlus V1) launched in 2006, and NHDPlus ver-sion 2 (V2), debuted in 2012. Both feature the NHD 1:100,000-scale stream network and the 30-meter ground spacing (1 arc-second) NED. NHDPlus V2 features over a thousand isolated networks in the NHD, NED coverage for over 40% of the country, and WBD expanded to cover all the US [63]. Currently under development is the US- GS High Resolution NHDPlus (HR-NHDPlus), with the stream network resolution in-creased to a 1:24,000-scale and the 10-meter ground spacing (1/3 arc-second) NED
[64].
The model estimates streamflow by associating stream segments in each catchment with temperature, rainfall and runoff data. NHDPlus uses elevation to compute stream slope, streamflow and velocity, and other associated attributes [65].
Analysis and Estimates
In order to test the methodology for visualization analysis, a comparison and con-trast system was developed to better understand the dataset relationships and dataset requirements for any given watershed tested. For this analysis, a watershed basin case study was developed in order to analyze for both a quantitative and qualitative mea-surement perspective regarding the interaction between watershed basin datasets available for each given watershed tested and the basic methodology correlation com-parison between the given watersheds tested. (See summary analysis in the Study Re-gions section and the Discussion section.)
Mapping streamflow and inundation forecasts
For this big model array to be visualized, the data needs to be put on a map. WaVE uses an integrated automated process to geoenable (i.e., associate with geospatial prop-erties) and publish this runoff forecast data using a multi-scale temporal map service. The maps are published at multiple scales in order to be viewed and show varying de-grees of detail at different levels.
scale temporal map service to generate visualizations of flood extents and impacts. This flood inundation database is rendered on a geo-enabled rating curve that correlates flood depth with flood extent for each watershed reach. To visualize water flow and understand depth for purposes of developing an inundation map, terrain is analyzed and pre-calculated for each modeling reach. Flood extent, depth of flooding, and water surface elevation are all calculated for a series of incremental depths. A pre-existing ob-served rating curve can be used, or a synthetic one can be derived based on proven and tested hydraulic assumptions.
Once the streamflow and inundation forecast data are prepared, the WaVE toolset can generate down-scaleable flood maps using a Raster Function Template (RFT) mod-el. Using the RFT model, several analytical functions available right out of the box are chained together to create a complex model that can be used to perform on-the-fly analysis. This analytical capability can be extended using the Python Raster Function and Height Above Nearest Drainage (HAND) [66]. Flood maps are then created using a combination of HAND Raster Mosaic, Catchment Raster and the resulting visual mod-el. HAND is a terrain model that normalizes topography according to the local relative water heights found along the drainage network by combining flood inundation map-ping catchments and flowlines with elevation (DEM). The model defines river channel geometry and flood inundation extent for 5 million kilometers of stream reaches over the continental US.
3.1.3. Phase 3—Performing
In the third and final phase of WaVE, the performing step is publishing the forecast data and mapping the results as web services. Forecasted visualization maps can be consumed in a wide variety of web and mobile application services for a broad spec-trum of end users. The capabilities of the applications are determined by the kinds of services that are published, as well as by the capabilities of the user applications. These variable map applications include: flow at a location, flow along a reach, depth at a lo-cation, and depth raster needs. By publishing the modeling results as web services, the results become widely accessible, not just to specialists in the science, water resources managers and emergency management communities, but to the concerned public, in-cluding residents living in a floodplain or business owners affected by potential floods.
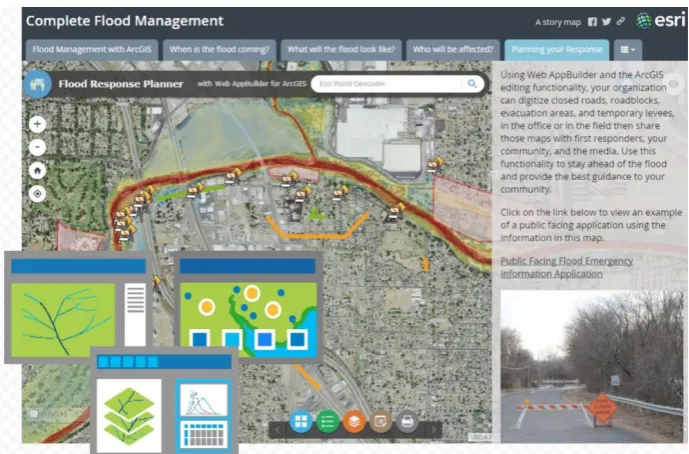
The multi-scale temporal map services are then used by various web applications re-lated to predicting and responding to hydrologic events. Configurable application tem-plate builders are available on a larger platform based toolset to easily create and pub-lish interactive analytic applications (see Figure 5).
in the world by selecting either the WRF-Hydro or ECMWF forecasting model systems (see Figure 5 and Figure 6).
3.2. Building the Future Model—Enhancing the Framework for Accuracy and Localization
3.2.1. Transforming Knowledge into Action
[image:17.595.202.544.200.397.2]In order to be confident that first responders are making decisions that accurately re-flect the reality of a crisis event, decision makers need to be confident that they have
Figure 5. An example of ancillary flood data that can be integrated into WaVE—Screenshot
of an interactive June 2016 Texas flooding ArcGIS Story Map, showing moveable split screen comparing pre- and post-event satellite imagery of flood area.
Figure 6. An example of ancillary flood data that can be integrated into WaVE—Screenshot
[image:17.595.202.547.449.676.2]previously considered and made sense of all the relevant observations and information before they can strategize, plan, create and implement response scenarios [42].
Muhren and Walle [67] define this sense-making as contextualizing and making un-derstandable a situation or scenario when there is an absence or loss of meaning, a pe-riod often precipitated by “unforeseen changes in the environment which break the imaginary link between expectation and reality and force actors to reevaluate what they are doing and where they should go.” To make sense of all the various bits of structured and unstructured data and often conflicting human interpretations, responders need and search for the right frame of reference they can use in order to interpret, contex-tualize and draw insight for making decisions and acting.
In crisis situations, where events often unfold very quickly and there is a high degree of uncertainty regarding what is known or needed to be known, responders usually ei-ther lack an adequate frame of reference (ambiguity) or are confronted with multiple, conflicting interpretations and frames (equivocality). Decision makers can develop an adequate frame of reference or reduce the equivocality of multiple frames by making use of a variety of sources to notice what is going on around them, interact with others, and communicate with others to enable action. A well-designed EMDSS can provide the means for dealing with ambiguous or equivocal frames of reference [67].
Having a common operating picture (knowledge base), the conditions for which must be developed before a crisis event, is essential for sharing information, coordina-tion, focused action and support among different geographically diverse organizations and jurisdictions. While in reality, sense-making, decisions and actions are carried out at individual group levels according to roles and competencies, emergency manage-ment without a common operating picture tends to revert to hierarchy as a means of control [41].
WaVE is an integrated support system that aggregates relevant hydrologic and ancil-lary data, analyzes that data, and publishes the geoanalytic results using common-ly-shared (yet providing user-defined customization) geovisualization platform and toolsets for flood event situational awareness and EMDSS (see Figure 7).
3.2.2. Integrating Machine Learning for Enhancing River Flow Accuracy
Accuracy and reliability of data are critical for decision makers, not only as a basis for making time-sensitive and effective choices, but also as factors that influence the level to which decision makers trust, adopt and use these tools. The next phase of develop-ment of WaVE will likely integrate a hydrologic machine learning predictive model de-veloped and tested by the authors (and currently under peer review for publication). This new model will interpolate and extrapolate streamflow and inundation data for gaged and ungaged catchment channels, and test, analyze and score the degree of both accuracy and uncertainty for results from other hydraulic models.
Developed in collaboration with researchers from Microsoft and leveraging the latest Esri GIS hydrology and Microsoft Azure cloud computing technologies, this new pre-dictive model (either standalone or integrated with WaVE) can:
offline or damaged during flood events).
• Interpolate data from ungaged streams deemed to be similar to proximally indexed
gaged streams.
• Be used to identify the optimal locations for positioning physical streamgages. • Estimate streamflow in ungaged water catchments using datasets derived from sate-
llites and other remote sensors.
• Create a virtual streamgage historical index for interpolation of missing discharge
data and extrapolation of forecasted discharge.
• Compare and test runoff forecasts developed from WRF-Hydro and ECMWF mo-
dels.
Using cloud computing to compute billions of data elements, the model relies on machine learning to process (i.e., teach itself) and interpret large volumes (“big data”) of historic complex hydrologic information. The model uses this information to con-struct a virtual dataset index of correlations and groups (clusters) of relationship corre-lations between selected streamgages in a watershed and under differing flow condi-tions. These estimates are continuously tested, scored and revised using multiple re-gression analysis processes and methodologies. WaVE can then integrate this conti-nually updated, forecasted and real-time streamflow data into its framework.
[image:19.595.195.553.401.673.2]Integrating this machine learning correlation indexing model enables WaVE to util-ize large volumes of forecasted data to make more accurate predictions and better test local-downscaled inundation map models in the future.
Figure 7. Integrating geospatial analytics, visualization and machine learning into WaVE’s com-
3.2.3. Developing Satellite Remote Sensing to Derive Streamflow Data
The United States has upwards of 8000 streamgages, yet there is a continued demand from water resource managers and flood emergency managers for more streamflow in-formation, especially during a flooding event. Many streams and large portions of streams throughout the country lack in situ gauge measurement resources. In response to this lack of streamgage availability, Gleason [68] designed the At Many-stations Hy-draulic Geometry (AMHG) model to derive streamflow discharge data estimates solely from multiple satellite imagery. This innovative computational riverine research is an example of RS application being developed to meet the demands of the quantity and quality of data required for WaVE framework integration. In the AMHG model, Glea-son describes its functional research relationship to river streamflow by using RS and computational analytic river flow width (w), mean streamflow depth (d), and mean ve-locity (v) in order to build a critical discharge (Q), where Q = wdv. Significant practical applications using this discharge data can be developed for the building of inundation maps with WaVE’s framework, by using RS discharge river datasets, building a histori-cal indexing river (Q) dataset system, and then integrating new methodology applica-tions outlined in the machine learning analysis. Three of the four watersheds hig-hlighted in the case study section below used AMHG methodology for measuring river discharge which can then be used for building historical and actual inundation maps using the streamflow estimation methodology and WaVE framework.
3.3. Study Regions: Testing Integration Analysis
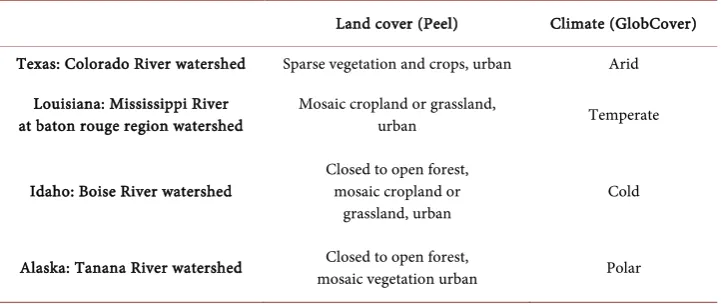
[image:20.595.194.555.552.704.2]WaVE was studied and tested at watershed sites in four US geographical regions, cho-sen for their diversity in topography, river geomorphology, climatic conditions, popu-lation in the environs and the amount of available data from various hydrologic com-putation models: 1) Southwest United States (Texas), 2) Central United States (Louisi-ana), 3) Northwest United States (Idaho), and 4) the far north Arctic region (Alaska). The broad variety of local conditions in these settings belong to five of the ten main land cover classes by GlobCover [69] and represent four of the five types of climate classification (see Table 2) [70].
Table 2. Land cover & climate characteristics of watersheds.
Land cover (Peel) Climate (GlobCover) Texas: Colorado River watershed Sparse vegetation and crops, urban Arid
Louisiana: Mississippi River at baton rouge region watershed
Mosaic cropland or grassland,
urban Temperate
Idaho: Boise River watershed Closed to open forest, mosaic cropland or grassland, urban
Cold
The three-phase process of Gathering, Processing and Performing, described in the methods section, was used to test WaVE in order to evaluate its capability and effec-tiveness in downscaling data from a global, national and regional level to the local level (as close as possible, depending on data availability and spatial resolution of the under-lying hydraulic model and DEM), with the goal of transforming this data into a visua-lized local level flood inundation map. With the goal of eventually incorporating into WaVE other application models that derive discharge for forecasting purposes, two ad-ditional models were tested: a machine learning hydrology estimation model and a sa-tellite RS model.
Texas: Colorado River Watershed Basin
This Texas watershed basin has an arid climate with minimal seasonal rainfall, mixed sparse vegetation in the upper watershed, and irrigated crop vegetation. The region is directly impacted by irregular storms and hurricane events that can cause high flash floods in an area with a large population at the base of the watershed, threatening sig-nificant property damage and loss of life. To help prevent or mitigate these flood risks, water managers and floodplain managers face the challenge of balancing reservoir sto-rage levels and flood control systems.
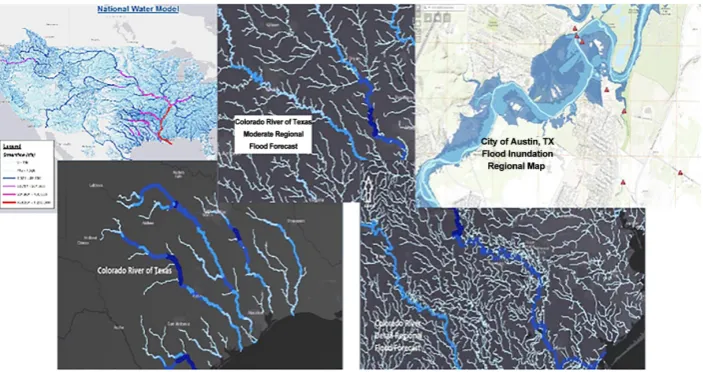
[image:21.595.198.550.483.669.2]When WaVE was tested on the Colorado River watershed, it successfully downscaled the available data and produced a forecasted enhanced inundation map of the national and regional levels, but lacked adequate data to be able to downscale to the local level.
Figure 8 depicts an example of the dynamic, interactive and time-sequential WaVE screenshots of the Colorado River watershed. They demonstrate streamflow estimation using 6 hour intervals over a 10-day occurrence highlighting the ability to simulate fo-recasted streamflow with precipitation impact of national, state, regional, and partial local watershed regions. This same process, generating visual enhanced streamflow models, was also created on each of the other three watersheds with different outcomes.
Figure 8. Plates created by WaVE demonstrating forecasted and real-time scaled levels of
Louisiana: Mississippi River, Baton Rouge Regional Watershed
A segment of the Mississippi River within the Baton Rouge regional watershed basin, located in the central-southern US, was selected for its temperate climate, mosaic vege-tation, and the broad river basin’s high flood impact on local populations. Large vo-lume water accumulation during rain runoff can result in high flood inundation, creat-ing a flood hazard potential for the large number of residents, particularly in the Baton Rouge community.
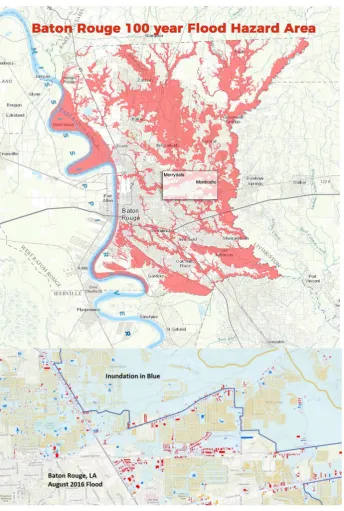
When WaVE was tested on the Mississippi River within the Baton Rouge watershed, the model successfully downscaled the available data and produced an enhanced inun-dation forecast map at the national and regional levels, but lacked adequate data for downscaling to the local level. The two maps portrayed in Figure 9 are historically ac-curate, localized inundation maps that have been verified by local flood officials at the end of the August 2016 flood event in Baton Rouge. Localized inundation maps like these were used to validate WaVE’s prediction of inundation in all four study regions.
Idaho: Boise River Watershed
The Boise River basin is located in the Northwest United States, west of the Rocky Mountains, with high mountain ranges and steep slopes east and north of the city of Boise. The land cover is closed-to-open forest and mosaic cropland. This watershed was selected for its combination of high flood inundation events caused by irregular season-al rainfseason-all that can occur in early spring; the melting of large accumulations of snow in the mountains creates high volumes of spring runoff that can result in flash floods that threaten the state capital’s large population and surrounding communities. In this wa-tershed basin, water and floodplain managers have to balance water storage capacity for agriculture and water utilities with necessary flood control precautions and measures.
When WaVE was tested on the Boise River watershed, it successfully downscaled the available data and produced a forecasted enhanced inundation map of the national and regional levels, but lacked adequate data and adequate DEM spatial resolution to be able to downscale to the local level.
The images in Figure 10 highlight and demonstrate streamflow estimation using 6 hour intervals over a 10 day occurrence, illustrating the ability to simulate forecasted streamflow with precipitation impact on a state and regional level. However, lack of high resolution datasets prevented WaVE from downscaling to the local level with the detail requested by emergency responders for the watershed region. This same process was implemented on each of the other three watersheds with different outcomes.
The Boise River Watershed was specifically selected as part of this case study because of the availability of many years of informationally-rich, well-documented hydrology streamgage data for testing the machine learning methodology. Together with near real-time data, the historical data was measured and applied to acquire historical dis-charge rates that could be utilized for flooding events like the August, 2016 Baton Rouge flood event when streamgages stopped transmitting and information was lost as a result of the flood.
Figure 9. Flood inundation map of August 2016 Baton Rouge Regional Area. Images designed using ArcGIS 10.3 and Arc Hydro and the Federal Emergency Management Association (FEMA) datasets.
Alaska: Tanana River Watershed
The Tanana River watershed is a large, glacially-defined riverine system formed by numerous mountain ranges and arctic streams within the central part of Alaska. The region is characterized by a polar climate and land cover of closed-to-open forest with mosaic vegetation. This watershed was selected because of the complex flooding events caused by large amounts of snow runoff in the spring that flow into and meet with ice sheets in the Tanana River. Since much of the inland (non-coastal) Alaskan human population is located in the city of Fairbanks and within the Tanana River drainage ba-sin, this frontier city is often threatened with the possibility of extensive riverine flood devastation (see Figure 11).
Figure 10. Plates demonstrating WaVE forecast and pre and post flood inundation in
downtown Boise. Images courtesy of Esri and designed using ArcGIS 10.3 and Arc Hydro and Google Map services.
[image:24.595.207.539.234.482.2](a) (b)
Figure 11. (a) Aerial photo (provided by US Army Corps of Engineers) of the braided
[image:24.595.210.539.537.662.2]When WaVE was tested on the Tanana River watershed, it successfully used the available data to produce a broad national hydrology water map using both the WRF- Hydro and ECMWF. However, the lack of in situ discharge measurement tools pre-vented the ability to gather the data needed to produce an enhanced inundation fore-cast map at even the regional level for the Tanana River. Anticipating these limitations, the AMHG remote sensing application was used as another means of forecasting inun-dation. Testing AMHG [12] parameters and cross-referencing the research on several of the lower latitude watersheds provided tangible research data for further investiga-tion for the WaVE integrainvestiga-tion model.
Data Analysis Methodology and Indicator and Agreement Comparison
Analysis results are highlighted in Table 3. The need still exists to develop tools for gathering discharge data that will operate in this high northern latitude region. Apply-ing the WaVE methodology to each case study region, a comparative and contrastApply-ing quantitative and qualitative measurement analysis was created by testing available da-tasets within the full integration framework as a downscaling analysis (see Table 4).
The quantitative measurement analysis, that was conducted, compared and corre-lated the visualized map results of forecasted (pre-) integrated datasets and actual (post-) integrated datasets, and evaluated the available forecasting datasets and the downscaling process for each study region. Using Pearson linear correlation coefficient (r), the formula for testing and analyzing the forecasting (pre-) and actual inundation (post-) event dataset for each watershed basin is as follows:
(
)(
)
(
)
(
)
2(
)
21 1 1
n n n
i i i i
i i i
[image:25.595.192.554.448.531.2]r=
∑
= x −x y −y ÷∑
= x −x∑
= y −y (3)Table 3. WaVE—Forecasted data visualization downscaling analysis (Flood Inundation Map).
Case Study National Regional Local Texas Yes Yes No Louisiana Yes Yes No Idaho Yes Yes No Alaska Yes Partial No
Table 4. WaVE—Forecasted Data Visualization Analysis of (pre-) and (post-) dataset detection.
[image:25.595.195.557.568.704.2]In this equation, (x) is the forecast dataset collection event, (y) the mean of the actual dataset (post-) collection event, (x) is the mean of (x), (y) is the mean of (y), and (n)
is the time (in days) of a forecasting time scale event (Equation 3). Note: The forecast-ing datasets for each tested watershed contain multiple variables and integration processes for each location, measurement, and time, are not evaluated for dataset quan-tity. Therefore, testing with large quantity data methods, including root mean square, mean absolute error, and R-square error calculations was not performed on this re-gional case study project at this time.
Future application models for WaVE framework
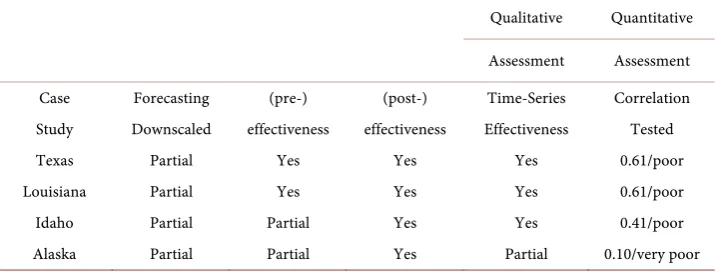
All four watersheds received preliminary testing for the hydrology machine learning prediction model for discharge analysis using in situ measurement data and the AMHG model for discharge analysis using RS measurement data. During a flooding event, pro-viding estimated forecasting discharge data and integrated WaVE methodology, new estimated inundation map for first responders on a local level could be assessed. Table 5 summarizes the test results of all four watersheds for both the authors’ hydrologic machine learning model (previously described) and the AMHG model [12].
4. Discussion
The purpose of WaVE is to provide flood event decision makers with enhanced geoa-nalytic visualization (common operating picture) and user-customized DS toolsets for contextualizing, making sense of and acting upon accurate and scalable hydrologic and ancillary flood data. The previously described case studies were conducted to test and demonstrate the functionality, reliability, and effectiveness of the WaVE framework and toolsets (including the use of machine learning for estimating proxy streamflow data) under diverse geomorphology, streamflow and flood-related conditions at na-tional, regional and local levels. Results from these case studies highlight some of WaVE’s inherent strengths (both existing and potential), limitations, and the need for further development.
4.1. Capabilities and Functional Validation
[image:26.595.195.553.600.706.2]Framework, downscaling, and visualization The primary goals of the case studies were to:
Table 5. WaVE framework—forecasted data: using machine learning & AMHG for gauging river
discharge and flood inundation maps.
Case study Machine learning AMHG discharge Comments Discharge value Value
Texas Partial Not tested More testing required Louisiana Partial Yes—0.91/very good Good long term dataset
• Input, aggregate, and prepare historical, real-time and forecasted data used in base-
line analyses, models, estimate comparisons and tools.
• Demonstrate the ability to downscale and utilize national precipitation, flood fore-
casting, hydrography, and landscape topography datasets to the regional and local scale level (depending on DEM spatial resolution and availability of streamflow and inundation data).
• Demonstrate the use of hydrologic machine learning to produce accurate stream-
flow estimates that can be integrated into WaVE models.
• Transform this downscaled data into visualized local-level flood inundation fore-
casts and other useful actionable flood-related knowledge elements of where, when, and what.
• Develop a precipitation, flood forecast visualization map for each of the watersheds
and compare their output maps with some form of calibration for pre-, mid-, and post-processing integration of data sets for all technologies into functioning GIS platform characteristics for each of the watershed regions.
• Demonstrate how other models and model results can be integrated into, analyzed
and geospatially visualized using WaVE.
Three of the case studies—Texas, Louisiana, and Idaho—provide clear parameters and datasets for a fully integrated test analysis for the WaVE framework as applied to different types of land use and local and regional roles in watershed flooding events. The fourth case study area—Alaska—was used to develop the data requirements. As discussed below, the lack of ground station measurements results in a limited availabil-ity of streamflow data and highlights the importance of RS as a source of data.
All six goals of the case studies were achieved to varying degrees according to the av- ailability, quality, and spatial resolution of the data. Overall, the results from the case studies indicate that WaVE can capably and effectively downscale forecast data, as well as transform that data on-the-fly into dynamic streamflow routing and inundation maps. Analysis of forecasted case study map results, compared and contrasted with ac-tual flood inundation maps, demonstrated a medium to high correlation and degree of accuracy.
Ubiquity, flexibility and extensibility
Addressing fundamental limitations of existing flood visualization tools and EMDSS, WaVE was intentionally designed to use a standard and widely available software archi- tecture, together with a flexible and extensible framework that could be easily adapted to users’ needs and integrate their existing tools and data. The lack of ubiquitous, inte-roperable, flexible and extensible systems and standardized data formats are primary reasons why many decision makers and communities either don’t acquire flood aware-ness and EMDSS or are unable to effectively utilize existing programs.
le-verage existing structures for in-place procedures. Acquisition and adoption of new technologies to build flood hazard prediction models may be unacceptable due to per-ceived costs—additional time and training requirements, the restructuring of old pro-grams, problems associated with the short-term loss of flood propro-grams, accuracy issues of flood prediction tools, or even the increased cost of hiring new staff. Furthermore, for many practitioners, these models and tools simply are not seen as sufficiently ac-cessible or useful to justify acquisition and adoption. This is due to the fact that these models and tools are generally computationally complex, data-intensive, and accessible only to the domain experts who build them, frame the issues, model the results, and de-sign the products they’ve determined practitioners need [72]. Plus, for many users, ac-cessing near real-time data is expensive and often cost-prohibitive.
Other user groups are willing to undertake the transition because they perceive the realized and potential future benefits to be greater than short-term considerations and the cost of acquiring new emergency flood mapping resources or restructuring existing ones. For these groups, however, such a transition is complicated by the variances in user needs, availability of required data and resources, and limitations of satellite-based flood detection systems [18]. The frequent lack of data continuity from one region to another, the lack of historic flood images, and the poor quality of available data often result in poor coverage datasets. Disruptions of datasets often created by the use of dif-ferent platforms and access points imagery by data providers further complicate flood map development.
To address many of these limiting factors, the authors constructed WaVE to enable potential users to leverage already-owned and familiar building blocks of architecture, platform, framework, mapping and GIS tools. The core WaVE framework is built upon Esri ArcGIS (v. 10.3) and ArcHydro (v. 10.3) platforms and software architecture for three key reasons: 1) most potential US institutional users are decision makers at the federal, state and local government levels that already have Esri institutional licenses and ArcGIS–ArcHydro platforms and applications; 2) users’ existing programs and da-tasets can be integrated into the full Esri suite; and 3) many hydrologic models (wheth-er open source or proprietary) in current use or und(wheth-er development (e.g., WRF-Hydro, NHDPlus, RAPID, Tethys, USACE’s Hydrologic Engineering Center’s River Analysis System, HAND, etc.) are all built on top of Esri’s ArcGIS architectural platform. The worldwide GIS market is highly fragmented [73] and consists of a wide spectrum of open source, public and proprietary systems that often use incompatible, non-standar- dized platforms, data formats, etc. By contrast, ArcGIS, while owned by Esri, is the most common GIS mapping platform worldwide.
Additionally, the case studies also show that WaVE’s framework accommodates data from newly-developing research models that use hydrologic machine learning and sa-tellite RS imagery. These models interpolate or extrapolate estimated streamflow data in gaged and ungaged rivers, thereby providing valuable datasets of streamflow esti-mates. This data can then be integrated into WaVE’s forecasting and prediction model and downscaled to the local level, expanding the possibility of developing new, accurate and predictive inundation maps. Although WaVE presently uses Microsoft’s Azure cloud computing platform, it is also compatible with other cloud services (e.g., Ama-zon, Google, IBM, Oracle or open source), further illustrating WaVE’s flexibility and extensibility.
4.2. Limitations
While validating the overall WaVE framework and model, the case studies also hig-hlighted WaVE’s inherent dependence on adequate historical streamflow and inunda-tion forecast datasets and sufficiently high spatial resoluinunda-tion DEM and hydraulic model results for downscaling visualized data at the local level.
Testing the WaVE model at different geospatial scales (e.g., regional or local) re-quires high spatial resolution and detail of elevation and terrain, as well as adequate historical streamflow data. For some areas, there is neither sufficient data nor high enough resolution for adequate regional or local analysis and forecasts.
Inadequate streamflow and inundation data
Another significant limiting factor in the adoption and utility of contemporary hy-draulic models and flood inundation maps is the lack of standardized and accurate streamflow and ancillary hydraulic data [18].
Severe climatic conditions or geographic inaccessibility in some regions greatly limit the ability to place and maintain a sufficient number of in situ streamgages for measur-ing and recordmeasur-ing quantitative data of river discharge. For example, many rivers in the Arctic, like the Tanana River, lack evenly-spaced in situ streamgages to gather quantita-tive data of river discharge along the full flow of the watershed, thereby restricting the ability to provide advance warning of a flood event to the surrounding communities.
In order to supply historical or real-time data estimates for gaged streams with non- transmitting gages or for ungaged streams, WaVE utilizes a new hydrologic streamflow estimation model to create proxy datasets by either interpolating missing data for inter- ruptions in streamgage datasets, or to extrapolate forecasted estimates using machine learning and correlation indexing.
Glea-son’s analysis required no in situ measurements, but rather utilized hydraulic geometry that focused on river width, depth and other empirical parameters from remote sensed imagery to estimate measurements of log-linear velocity and discharge. This research process, now referred to as the “at-many-stations hydraulic geometry” (AMHG) model, was evaluated for potential integration into WaVE as an analysis tool.
Challenge for localized data downscaling
A second primary goal of WaVE—effectively scaling flood inundation and stream-flow mapping down to a local level, whereby a first responder can accurately determine the extent and depth of inundation at any point along a stream—requires higher spatial resolution and detail of elevation, terrain, and streamflow data than what is currently available in most locations.
While insight at national and regional levels is useful for analyzing trends, it is often of relatively little use to local decision makers who need accurate real-time or nearly real-time information at the local scale to both anticipate and prepare for flood events, as well as tailor mitigation actions and responses.
The focus of research and the availability and spatial scale of data related to RS has shifted from global and national to regional and, increasingly, local. While moderate resolution imaging and passive microwave satellite observation datasets are valuable sources of land surface hydrological information, more frequent and quickly accessed and processed satellite images are needed to evaluate RS as a reliable and effective source of data for analysis and mapping. Combining remotely sensed data with ground- based information provides a more comprehensive overview than just in situ stream-gage data of the holistic watershed, including landscape topography, geology, watershed drainage, soil moisture, visual history of changes in river water flow drainage, and va-riables due to weather and seasonal changes [74]. Of the two RS methods, satellite im-agery from SAR platforms is seen as superior for showing and measuring repeatability of land change awareness, whereas lidar technology toolsets are preferred for achieving local ground awareness [75].
Currently only a small percentage of the surface elevation of the US (lower 48 states) has been digitally mapped using lidar, and an even smaller percentage of the country (most of that in Alaska) has been digitally mapped using IfSAR [76]. A small percentage of the lidar-mapped surface is mapped at a high enough spatial resolution for effective down-scaling and localization. As higher resolution data becomes availa-ble, WaVE will be able to provide localized mapping with greater accuracy and granu-larity.
4.3. Further Research and Development
The research and testing of WaVE has revealed that in order for this framework to de-liver downscaled, localized, predictive, and high resolution inundation maps for emer-gency responders and flood managers, higher quality streamflow, elevation and remote sensed data are needed.