A Study of Smog Issues and PM
2.5
Pollutant Control
Strategies in China
David Hu1*, Juyuan Jiang2
1Blue Valley Southwest High School, Overland Park, Kansas, USA; 2School of Automation Engineering, Tianjin University of
Technology, Tianjin, China. Email: *[email protected]
Received April 29th,2013; revised May 31st, 2013; accepted June 29th, 2013
Copyright © 2013 David Hu, Juyuan Jiang. This is an open access article distributed under the Creative Commons Attribution Li-cense, which permits unrestricted use, distribution, and reproduction in any medium, provided the original work is properly cited.
ABSTRACT
The increased occurrence of smoggydaysin major Chinese cities is of major concern to the general public. This paper explores the major sources of PM2.5 pollutants, a key contributor to the smog in Beijing, one of China’s largest cities. Evidence indicates that the secondary PM2.5 particles formed through NOx, SOx, NH3, VOCs, etc. have a strong impact on human health. As a result, PM2.5 pollution control should not simply focus on controlling particulate emission, but should involve adopting an integrated multi-pollutant control strategy. In addition to identifying the major sources of PM2.5, this paper explores its impact on environmental and human health. Although the intention of this research is not to provide solutions for reducing PM2.5 pollution, the paper analyzes the United States’ experience with establishing PM2.5 standards and mandates. Specifically, this paper focuses on the air quality control strategies adopted in California since the 1940s and draws parallels with present-day China. The research suggests that adequate government regulation, public awareness, regional collaboration and industrial compliance are keys to successfully controlling PM2.5 pollution.
Keywords: PM2.5; Smog; Air Quality Control; Multi-Pollutant Control; Coal Combustion; Vehicle Emission; Beijing;
China
1. Introduction
Particulate matter (PM2.5) particles are air pollutants with a diameter less than 2.5 micrometers, small enough to invade even the smallest of airways in human body. Par- ticulate matter pollutant is composed of a mixture of mi- croscopic solids and liquid droplets suspended in air. These pollutants are made up of a number of components, including SOx, NOx, NH3, organic chemicals, volatile metals (e.g. mercury), soil or dust particles, and allergens (e.g. such as pollen or mold spores). When suspended in the atmosphere, PM2.5 particles are the major cause of reduced visibility in major Chinese cities, such as Beijing [1]. Since 2008, the US embassy in Beijing has issued hourly readings of the PM2.5 concentration on their Twit- ter feed [2], causing the Chinese Ministry of Environ- mental Protection to criticize the data as inaccurate, claiming it is a single data point that is not representative of the entire city of Beijing. This controversy, along with the increase in smoggy days in the Beijing area [3], be- lieved to be caused by PM2.5 pollutants [4], has led to
increased local interest in PM2.5 pollutants.
Unlike most air pollutants that consist of only one chemical compound, PM2.5 particles consist of multiple compounds and are formed from primary and secondary participles [5]. Primary particles are formed during com- bustion, industrial processes and in natural processes (e.g. wind erosion). Secondary particles are formed indirectly through nucleation, condensation or processes where gaseous pollutants (SOx, NOx, NH3, VOCs) are involved in particle formation or growth. Secondary sulfate and nitrate particles formed from SOx or NOx precursors are usually the dominant component in PM2.5 particles. As a result of the chemical components in secondary partici- ples, the environmental and health impacts from them are greater than from primary particles. Since PM2.5 partici- ples consist of multiple compounds, multi-pollutant con- trols are needed to reduce PM2.5 pollutants [6]. This study is focused on identifying sources of the PM2.5 pollutants observed in major Chinese cities and its effects on human health. Additionally, this paper will analyze the US air quality regulations, with a focused look at PM2.5 regula- tion in California. The US experience in air quality con-
trol will provide some thought leadership for air quality management in China.
2. Methodology
This paper was drafted through primary and secondary research. Primary research was conducted through inter- views with environmental protection experts in China and the United States as well as analysis of historical data on PM2.5 pollutant levels and regulations obtained through the US EPA’s air quality control office. Secon- dary research was conducted through literature searches of journal articles, research reports, books, conference notes and news articles. News articles containing politi- cal opinions were excluded from the literature search. In addition, the authors also visited major Chinese cities to observe the smog first-hand. A workshop discussion was also held with environmental engineering professors at the Tianjin University of Technology. Data regarding the increased number of vehicles in Beijing, the increased production of coal and cement, and the increased resi- dential construction were compared with the increased number of smoggy days in Beijing to illustrate potential sources of PM2.5 particles. Lastly, the authors researched key events, legislation and approached adopted in Cali- fornia from 1940-2012 to control air quality. These ap- proaches helped alleviate the smog issue in California and could be adopted by China in the future.
3. Results and Discussion
3.1. Smog and Major Sources of PM2.5 Pollution
In 2012, there were 124 recorded smog days in Beijing [3]; in January 2013, there was 25 smoggy days, 13 days higher than the monthly average the previous years [7]. Areas adjacent to Beijing, such as Tianjin and Hebei Provinces, facing similar effects, have had over 100 smoggy days per year [8]. Research has shown that most high PM2.5 events occur under a large surface high- pressure system, which causes air to sink on a large scale and traps pollutants and moisture near the surface [9]. These systems are often associated with light winds, which prevent particles from ventilating out of an area. Identifying which emissions or chemical processes are contributing to a certain city or county’s particle pollu- tion can be challenging. This makes PM a difficult pol- lutant to predict and control. Industrial sectors, such as automobile manufacturing, coal mining, construction and cement manufacturing, have grown significantly over the last 10 years. These sectors are known to generate large quantities of air pollutants, especially PM2.5 particles.
3.1.1. Automobile Industry
Souring vehicle emission in China is one of major sources of PM2.5. Vehicle emission can be a major con-
tribution to smog because SOx, NOx, NH3 and VOCs generated from vehicle exhaust can form secondary PM2.5 particles. It has been reported that 41.8% PM2.5 pollution in Beijing is contributed from vehicle exhaust [4]. In Beijing, from 1998 to 2012, the number of regis- tered vehicles has increased by almost 4 million. As shown in Figure 1, in the last 10 years, the number of
vehicles has more than doubled in Beijing. This is corre- lated to the increase in the number of smoggy days in Beijing [3,7]. Meanwhile, the population has increased from 12 million people to 20 millions in the last 10 years [10], but exhaust pollution has grown 10-fold. Although existing pollution sources have been treated, it can only be concluded that new pollution sources have emerged [11].
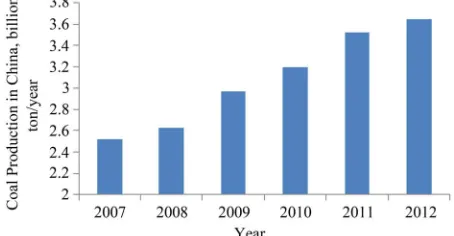
3.1.2. Coal and Industrial Processes
Coal combustion from utility and industrial boilers con- tributes significantly to PM2.5 pollution [12]. China’s heavy reliance on coal to fuel its power generation and industry processes, especially the use of poor quality coal, are likely to be the main cause. As shown in Figure 2, in
[image:2.595.313.535.420.554.2]the last 5 years, annual coal production has increased from 2.5 billion tons to 3.6 billion tons. Most of the coal is combusted directly from industrial boilers. Due to the lack of clean coal technology in China, a significant amount of primary and secondary PM2.5 particles are
[image:2.595.309.536.600.718.2]Figure 1. Increase of the number of vehicles in Beijing, China.
generated during coal combustion. It is reported that 36.4% PM2.5 particles in the city of Beijing is contributed from coal combustion, and in suburban Beijing, coal combustion contributes 48.6% to PM2.5 particles [4]. Al- though China has sought to impose strict fuel quality standards, experts say they are often circumvented. As long as penalties for pollution violations are mild, the enforcement of air quality control is nominal [9].
The smog effects have not been isolated to China— many other countries have experienced the same set of effects during their industrial boom periods. For example, many Japanese cities experienced the same problem, but with stricter enforcement of fuel and clean air standards, their long-term pollution problems are much less severe than China’s today [13]. A research report comparing European and U.S approaches towards PM2.5 particles control shows that in most western countries in the 1990’s, the main contribution to PM2.5 pollutants are sttionary combustion, industrial process, transportation and agriculture [14].
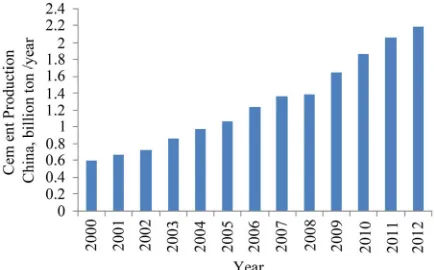
[image:3.595.314.531.85.220.2]3.1.3. Construction and Cement Manufacturing Industry
Figure 3. Annual cement production in China.
3.2. Impact of PM2.5 Pollution on Human
Health
In 1952, the “London Smog” epidemic led to the prema-
ture deaths of an estimated 12,000 people, who suc-
cumbed primarily to bronchitis, asthma, and respiratory distress within the two months following the event [19]. At the time, scientists understood very little about the adverse health effects of smog, but recognized the link between the precipitous rise in the death rate and the smog.
The increase of population in Beijing stimulates housing industries. In the last few years, Beijing’s residential con- struction has reached a total of 180 million square meters, generating 3.5 million tons of construction waste [15]. One-third of the wastes are generated from deconstruc- tion of old apartments and re-build of new apartments within six districts of Beijing. Due to the lack of control on waste storage and transportation, some of construction wastes end up as blowing dust. Huang et al carried out research and developed models to estimate the amount of construction wastes contributing to blowing dust [16]. According to local environmental agency’s analysis, residential and commercial construction wastes contrib- ute 15.8% to PM2.5 particulate in Beijing [15]. Cement is a major construction material. In China, the cement in- dustry’s boom began a decade ago, and with the fast growth of investment in capital assets such as housing and transport, investment in the cement industry reached 170 billion yuan in 2007 [17]. As shown in Figure 3,
since 2000, cement production continues to increase at annual average growth rate of 7.7%. By 2006, China is the number one cement production country, producing 50% of the world’s cement output. By 2012, total annual cement production reached 2.1 billion tons [18]. Cement manufacturing is a low efficiency and high polluting in- dustry. In China, coal energy is used to manufacture ce- ment and it is estimated that 7% of the annual coal pro- duced is consumed by the cement industry. Coal com- bustion exhausts along with cement dust have been major sources of PM2.5 pollution.
The chemical composition of particulate matter changes with size [5,6] and therefore, their effect on hu- man health varies depending on the pollutant’s size. The human body is unable to filter out small particulates [1] and as a result, dust and particulate matter that are smaller than 2.5 micrometers can enter into the alveoli in the lungs, where gas exchange occurs. These PM2.5 parti- cles negatively affect gas exchange within the lungs and can even penetrate the lung, escaping into the blood stream to cause significant health problems [20].
Health studies in the US and Europe have shown a significant association between exposure to fine particles and premature death from heart or lung disease. Fine par- ticles can aggravate heart and lung diseases and have been linked to cardiovascular problems, cardiac arrhyth- mias, heart attacks, respiratory issues, asthma attacks, and bronchitis. These health issues can result in increased hospital admissions, emergency room visits, and school or work absences, and restricted activity. Additionally, older adults, children and individuals with existing heart or lung disease may be particularly sensitive to fine par-ticle exposure [14].
A joint study by Greenpeace East Asia and Beijing University’s School of Public Health estimates that PM2.5 pollution caused the cities of Shanghai, Guangzhou, Xi’an and Beijing a combined total of US $1.08 billion in economic losses over the past year. Greenpeace is calling for an urgent policy adjustment, including capping re- gional coal consumption, retrofitting De-NOx for exist- ing coal-fired power plants, and shutting down inefficient coal-fired industrial boilers. The report, “PM2.5: Meas- uring the Human Health and Economic Impacts on China’s Largest Cities”, states that if these cities can ef- fectively lower their PM2.5 levels to meet the World Health Organization’s Air Quality Guidelines, then pre- mature deaths could be reduced by at least 81%, and economic losses for these four cities could be reduced by US $868 million [21]. A research report from Beijing University showed that effective implementation of PM2.5 standards in major Chinese cities could result in health benefits estimated at billions of dollars [22].
3.3. US Approaches towards PM2.5 Pollutant
Control
3.3.1. US Regulation on Particulate Matter Pollutants
In 1997, the US Environmental Protection Agency (EPA), issued a fine particle standard of 65 μg/m3, based on hundreds of health study evaluations and an extensive peer review process using the 3-year average of the 98th percentile concentration.
However, recent research on the health effects of par- ticular matter has caused a revision to the National Am- bient Air Quality Standards (NAAQS). During this revi- sion, new pollutants with a diameter less than 2.5 μm, commonly called PM2.5, is now regulated [23]. In 2006, the US EPA reissued their fine particle standard to a re- duced level of 35 μg/m3 [24].
At the time the fine particle standards were established in 1997, the US EPA also issued standard methods for monitoring fine particle levels in the ambient air to de- termine which parts of the country were subject to un- healthy levels. The US EPA deployed a nationwide net- work of more than 1200 monitors. Requiring 3 years worth of quality-assured data to create a revised particle standard meant that most sites did not have all the re- quired information until mid-2003.
The designation process adopted by the US EPA has played an important role in identifying for the general public whether the air quality in a given area is healthy. In April 2003, the US EPA issued a memorandum out- lining the schedule for designating areas under the PM2.5 standard and related guidance on nine factors to consider in identifying nonattainment areas. The Clean Air Act provides for states to submit designation recommenda- tions to the US EPA, and it requires the US EPA to pro-
vide time for consultation in cases where the administra- tor plans to promote a designation that modifies the state’s recommendation.
The US EPA designates an area as nonattainment if it has violated the fine particle standards over a three-year period, or if relevant information indicates that it con- tributes to violations in a nearby area. The US EPA also may designate an area as attainment/unclassifiable, if: 1) monitored air quality data show that area has not violated the fine particle standards over a three-year period; or if 2) there is not enough information to determine the air quality in the area [25].
3.3.2. Air Quality Control Strategies and Practices Adopted in California
Early last century, smog was a concern to many industri- alized countries such as the United States and the United Kingdom. It took a long time and dedicated efforts to solve smog problem in these countries. Today, in Beijing, the phenomena and the cause of smog are not that dif- ferent from those occurred in western countries during industrialization: coal combustion, vehicle emission, in- dustrial growth. The question should be posed as whether China can learn from the history and experience of other countries in particulate emission control.
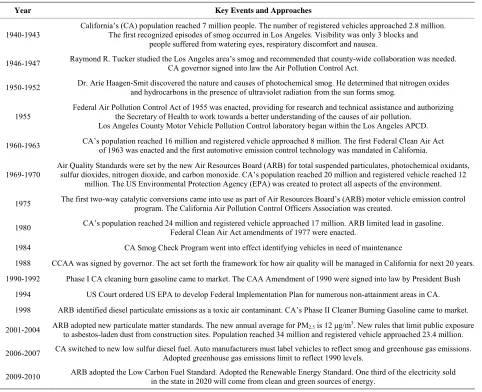
The following analysis is based on records of key his- torical events and approaches adopted by State of Cali- fornia towards the air quality management [26].
As illustrated in Table 1, in 1940s, episodes of smog
occurred in Los Angeles. Visibility was only 3 blocks and people suffered from watery eyes, respiratory dis- comfort and nausea. Today, Beijing’s smog situation has many aspects in common with that of 1940’s Los Ange- les. As summarized in Table 1, it took more than half
century for California to keep air quality under control. The key factors of success are highlighted as follow:
Multi-Pollutant Control: smog is not simply caused by suspended particulates. Photochemical oxidants, sulfur dioxides, nitrogen dioxide, and carbon monox- ide are the precursors of PM2.5 particles which are major components of smog. California’s experience indicates that PM2.5 pollution control is not simply to reduce particulate emissions, it requires integrated control strategy for multi-pollutant control.
Regional Control Approach: due to the nature of the air pollutants, especially long-distance transport phnomena of PM2.5 particles, air quality manage- ment effort within a county or a city is ineffective. California’s experience has shown that county-wide or interstate-wide collaboration is necessary.
Regulate Energy Source: California has eliminated the use of coal, only allowing natural gas to be used as fuel for utility and industrial boilers.
Vehicle Emission Control: regulation installed cata- lytic converters and mandated low-sulfur fuel for transportation
Support Research and Scientific Discovery: state and federal government agencies invest in R&D to better control air pollution and develop viable technologies to reduce pollutants.
Consistency of Policy: the success of quality control resides on having consistent policies, to which new mandates can be rolled out in phases that are built upon the success of earlier phases
Compliance and Enforcement: in order to establish effective air quality control standard, California regu- lations have encouraged the public and industries to participate in public hearings. Typically, US indus- trial companies have environmental health and safety (EH & S) department to ensure compliance with gov-
ernment regulations. Violations can be extremely costly to industrial companies, and it is not uncom- mon that violations can result in bankruptcy.
3.4. Regulation, Technology Development and Prevention Strategies
[image:5.595.63.545.346.738.2]Since 2011, public concern has led to calls for the Chi- nese government to establish a more stringent air quality policy that includes PM2.5 control. Additionally, strong support exists for each provincial capital and municipal- ity to begin monitoring PM2.5 levels. As of January 2013, 74 Chinese cities have announced plans to publish PM2.5 levels in real-time [27]. A long-term plan was announced by the Beijing municipal government in February 2012 to reduce annual average PM2.5 concentrations to 35 μg/m3. The plan calls for reducing PM2.5 concentration to 60 μg/m3 by 2015 and 50 μg/m3 by 2020. In the future, China will increasingly face air pollution issues due to the rising consumption of fossil fuels. As a result,
Table 1. History of air quality control in california.
Year Key Events and Approaches
1940-1943 California’s (CA) population reached 7 million people. The number of registered vehicles approached 2.8 million. The first recognized episodes of smog occurred in Los Angeles. Visibility was only 3 blocks and people suffered from watering eyes, respiratory discomfort and nausea.
1946-1947 Raymond R. Tucker studied the Los Angeles area’s smog and recommended that county-wide collaboration was needed. CA governor signed into law the Air Pollution Control Act.
1950-1952 Dr. Arie Haagen-Smit discovered the nature and causes of photochemical smog. He determined that nitrogen oxides and hydrocarbons in the presence of ultraviolet radiation from the sun forms smog.
1955
Federal Air Pollution Control Act of 1955 was enacted, providing for research and technical assistance and authorizing the Secretary of Health to work towards a better understanding of the causes of air pollution.
Los Angeles County Motor Vehicle Pollution Control laboratory began within the Los Angeles APCD.
1960-1963 CA’s population reached 16 million and registered vehicle approached 8 million. The first Federal Clean Air Act of 1963 was enacted and the first automotive emission control technology was mandated in California.
1969-1970
Air Quality Standards were set by the new Air Resources Board (ARB) for total suspended particulates, photochemical oxidants, sulfur dioxides, nitrogen dioxide, and carbon monoxide. CA’s population reached 20 million and registered vehicle reached 12
million. The US Environmental Protection Agency (EPA) was created to protect all aspects of the environment.
1975 The first two-way catalytic conversions came into use as part of Air Resources Board’s (ARB) motor vehicle emission control program. The California Air Pollution Control Officers Association was created.
1980 CA’s population reached 24 million and registered vehicle approached 17 million. ARB limited lead in gasoline. Federal Clean Air Act amendments of 1977 were enacted.
1984 CA Smog Check Program went into effect identifying vehicles in need of maintenance
1988 CCAA was signed by governor. The act set forth the framework for how air quality will be managed in California for next 20 years.
1990-1992 Phase I CA cleaning burn gasoline came to market. The CAA Amendment of 1990 were signed into law by President Bush
1994 US Court ordered US EPA to develop Federal Implementation Plan for numerous non-attainment areas in CA.
1998 ARB identified diesel particulate emissions as a toxic air contaminant. CA’s Phase II Cleaner Burning Gasoline came to market.
2001-2004 ARB adopted new particulate matter standards. The new annual average for PM2.5 is 12 μg/m3. New rules that limit public exposure
to asbestos-laden dust from construction sites. Population reached 34 million and registered vehicle approached 23.4 million.
2006-2007 CA switched to new low sulfur diesel fuel. Auto manufacturers must label vehicles to reflect smog and greenhouse gas emissions. Adopted greenhouse gas emissions limit to reflect 1990 levels.
strengthening air pollution control policies has become increasingly necessary not only for coal-based power plants, but also for other sectors.
Based on California’s experience, air pollution control requires collaboration among the governments of af- fected regions [28]. Regulating PM2.5 pollutants in Bei- jing alone will not solve the smog issue. Instead, estab- lishing regional air quality management coordination systems in developed cities such as Beijing and its sur- rounding suburbs will be necessary [29]. With the rapid urbanization and economic development in China and the resulting rise in air pollutant emissions, there is a need to establish regulations to limit air pollutant emissions.
Currently, China lacks research on PM2.5 reduction technologies and strategies. Research and development into technology to reduce air pollution and promote air quality improvement needs to be established. In the United States, while there are no smog issues on the scale of the problem in Beijing, the Clean Air Interstate Rule has been established to invest US $41 billion in R&D to reduce air pollution in 108 hot spots. One possible future area of innovation is in using weather data to forecast PM2.5 levels. However, more research needs to be con- ducted on PM2.5 forecasting and its application on public health.
In Beijing, another future area of innovation is in re- ducing vehicle emissions. The correlation between vehi- cle emission levels and air pollution is widely recognized. Improving fuel quality, including reducing the sulfur content in fuel oil, is an important step towards reducing toxic vehicle emissions.
Further research also needs to be conducted to deter- mine best practices for protecting the public from high pollutant levels. Public health recommendations need to be tested for efficacy and should balance protection with practicality. For example, recommending the general public to limit their outdoor recreation during high pol- lutant days may not be practical and instead, recommen- dations may need to be targeted at high-risk groups (e.g. the elderly). Recommendations must also be economi- cally feasible. For example, while buying an expensive air purifier may help, this recommendation would only be feasible for a minority of the population [30].
4. Conclusion
PM2.5 particles are dangerous pollutants that are harmful to human health and have the potential to destroy the environment. Most PM2.5 particles, especially those con- taining sulfates, nitrates, and many organic compounds, are created through secondary industrial and manufac- turing processes. Characterizing the chemical reactions that take place in the atmosphere to determine the source of fine particles is complicated. As a result, it is a chal-
lenge to attribute secondary particle formation to specific emission sources. In Beijing, China, the high frequency of smoggy days is strongly associated with levels of PM2.5 pollutant. Major sources of PM2.5 include vehicle exhaust, coal combustion from the utility industry and industrial processes, and the housing construction indus- try, including the cement manufacturing process. Strin- gent, government-mandated and integrated multi-pol- lutant control strategy, and regional control approaches have been shown to be very effective in California air quality management. Adequate government regulation, public awareness, regional collaboration and industrial compliance are the keys to successful control of PM2.5 pollution and smog.
5. Acknowledgements
United States Environmental Protection Agency for providing PM rule-making and historical documents.
REFERENCES
[1] Y. Li, “Smog Weather, Be Aware of PM2.5 Pollution,”
Food & Health (Chinese), 2012, pp. 9-11.
[2] S. Liu, “Why China, US Argue over PM2.5 Data,” 2012. http://www.china.org.cn/opinion/2012-06/08/content_255 98211.htm
[3] H. Li, B. Bai and L. Cheng, “Beijing Experienced 124 Days in 2012, the Highest in Last 10 Years,” Legal Eve-ning News (Chinese), 14 January 2013.
[4] Y. Ye, “Study of Decreasing PM2.5 Emission from Ther-mal Power Plant,” Electric Power Construction, Vol. 33,
No. 2, 2012, pp. 49-52.
[5] H. Ji, H. Zhao, S. Kong, Z. Bai and B. Han, “Seasonal Variation of Inorganic Composition in Ambient Particu- late Matter in Tianjin Offshore Area and Its Source Analysis,” China Environmental Science, Vol. 31, No. 2,
pp. 177-185.
[6] S. Wang and J. Hao, “Air Quality Management in China: Issues, Challenges, and Options,” Journal of Environ- mental Sciences, Vol. 24, No. 1, 2012, pp. 2-13.
doi:10.1016/S1001-0742(11)60724-9
[7] Q. Luo, “ 25 Smoggy Days Occurred in January 2013,” Beijing Daily, 1 Februry 2013
[8] Z. Bai, B. Wang and S. Du, “Status of PM2.5 Pollution in China,” Environmental-China Newspaper, 21 February 2012.
[9] B. D. Keim, L. D. Meeker and J. F. Slater), “Manual Synoptic Climate Classification for the East Coast of New England (USA) with an Application to PM2.5 Con- centration,” Climate Research, Vol. 28, 2005, pp. 143-
154. doi:10.3354/cr028143
[10] Xinhua News, “Beijing Population Tops 20.69 Million”, 2013.
http://www.china.org.cn/china/2013-01/21/content_27747 807.htm
http://english.caixin.com/2012-02-27/100361100.html [12] D. Li, P. Qi and X. Huang, “The Preliminary Discussion
of Preventive Countermeasures on Airborne Fine Parti- cles PM2.5,” Contaminations Control and Air Condition- ing Technology, Vol. 4, 2005, pp. 34-36.
[13] AP News, “Japan Seeks Cooperation with China on Smog Problem,” Gulf News, 9 February, 2013.
[14] Case Study, “Comparison of the EU and US Approaches Towards Control of Particulate Matter,” 2005.
http://ec.europa.eu/environment/archives/cafe/activities/p df/case_study4.pdf
[15] Y. Li, “Construction Dust Accounted for 15.8% of PM2.5 Particles, Beijing Authority Reinforce Construction Waste Management,” 2013.
http://www.bj.xinhuanet.com/bjpd_sdzx/2012-02/20/cont ent_24742145.htm
[16] Y. Huang, S. Fan, J. Qin, B. Yan, G. Li and G. Tian, “Study of Pollution from Deconstruction of Residential and Commercial Buildings,” Technology Development for Beijing’s Green Olympic Environmental Protection, 2006, pp. 1-7.
[17] T. Zhang, “China’s Cement Industry Suffers from Over- capacity,” 2013.
http://english.cntv.cn/program/bizasia/20130130/103129. shtml
[18] S. Feng and Z. Wang, “Cement Industry, From Expansion to Merger,” 21st Century Economic Report, 2011. [19] M. L. Bell and D. L. Davis, “Reassessment of the Lethal
London Fog of 1952: Novel Indicators of Acute and Chronic Consequences of Acute Exposure to Air Pollu-tion,” Environmental Health Perspectives, Vol. 109,
Suppl. 3, 2001, pp. 389-394.
[20] M. Fu, F. Zheng, X. Xu and L. Niu, “Advances of Study on Monitoring and Evaluation of PM2.5 Pollution,” Mete-orology and Disaster Reduction research, Vol. 34, No. 4,
2011, pp. 1-6.
[21] “Study on Premature Deaths Reveals Health Impact of
PM2.5 in China,” 2012.
http://www.greenpeace.org/eastasia/press/releases/climate -energy/2012/air-pollution-health-economic/
[22] Research Report, “Economic Analysis on Implementation of PM2.5 Standard,” Institute of Environmental and Eco-nomic Research, Beijing University, Beijing, 2011. [23] US EPA, “National Ambient Air Quality Standards for
Particulate Matter: Proposed Decision,” Federal Register,
Vol. 61, No. 241, 1996.
[24] Final Report, “Regulatory Impact Analysis for the Final Revisions to the National Ambient Air Quality Standards for Particulate Matter,” 2012.
[25] US EPA’s Technology Transfer Network, “National Am-bient Air Quality Standards (NAAQS),” 2013.
http://www.epa.gov/ttn/naaqs/standards/pm/s_pm_index. html
[26] California Environmental Protection Agency, “Air Re-sources Board.” http://www.arb.ca.gov/homepage.htm [27] Z. Chen, “74 Chinese Cities Release Real-Time PM2.5
Data,” 2013.
http://news.xinhuanet.com/english/china/2013-01/01/c_1 32075595.htm
[28] D. Evarts, “Regional Approaches for Improving Air Quality,” Second US-China NOx and SO2 Control Work-shop, Dalian, 2005.
[29] J. Hao, “Air Pollution Control Strategy in China,” Tsinghua University Report, 2008.
http://www.landecon.cam.ac.uk/research/eeprg/cleed/pdf/ HAO%20Jiming_Air.pdf
[30] S. Yu, R. Mathur, K. Schere, D. Kang, J. Pleim, J. Young, D. Tong, G. Pouliot, S. A. McKeen and S. T. Rao, “Evaluation of Real-Time PM2.5 Forecasts and Process Analysis for PM2.5 Formation over the Eastern United States Using the Eta-CMAQ Forecast Model during the 2004 ICARTT Study,” Journal of Geophysical Research,