Journal of Chemical and Pharmaceutical Research, 2013, 5(9):599-605
Research Article
CODEN(USA) : JCPRC5
ISSN : 0975-7384
Multilevel image threshold selection based on the shuffled
frog-leaping algorithm
M. H. Horng
Department of Computer Science and Information Engineering, National Pingtung
Institute of Commerce, Pingtung, Taiwan
_____________________________________________________________________________________________
ABSTRACT
Multilevel thresholding is an important technique for image processing and pattern recognition. The maximum entropy thresholding (MET) has been widely applied in the literature. In this paper, a new multilevel MET algorithm based on the technology of the shuffled frog-leaping (SFLO) algorithm is proposed: called the maximum entropy based shuffled frog-leaping algorithm thresholding (MESFLOT) method. The SFLO had been applied to solve the optimization problem such as image thresholding. Four different methods are compared to this proposed method: the particle swarm optimization (PSO), the hybrid cooperative-comprehensive learning based PSO algorithm (HCOCLPSO), the Fast Otsu’s method and the honey bee mating optimization (HBMO). The experimental results demonstrate that the proposed MESFLOT algorithm can search for multiple thresholds which are very close to the optimal ones examined by the exhaustive search method. Compared to the other four thresholding methods, the segmentation results of using the MESFLOT algorithm is the most, however, the computation time by using the MESFLOT algorithm is shorter than that of the other four methods.
Key words: Particle swarm optimization, honey bee mating optimization, hybrid cooperative-comprehensive learning based PSO algorithm, fast Otsu’s method, shuffled frog-leaping algorithm
_____________________________________________________________________________________________
INTRODUCTION
______________________________________________________________________________
thresholds that separate the gray-level regions of an image in an optimal manner based on some discriminating criteria such as the between-class variance, entropy and cross entropy. The popular method, Otsu’s method (1997), selected optimal thresholds by maximizing the between-class variance. Sahoo et al. (1988) found that the Otsu’s method is one of the better threshold selection methods for real world images with regard to uniformity and shape measures. [11]However, inefficient formulation of between-class variance makes the methods very time consuming in multilevel threshold selection. To solve this problem, Liao et al. (2001) proposed a fast recursive algorithm, Fast Otsu’s method, along with a look-up-table to implement in the application of multilevel thresholding.[7]Ye et al. (2007) proposed a particle swarm optimization (PSO) algorithm to optimize the Otsu’s criterion. Kapur et al. (1985) proposed a method for gray-level picture thresholding using the entropy of histogram. Abutable (1989) proposed a 2-D maximum entropy thresholding method for separating the regions of image.[1] Zhang et al. (2006) adopted the particle swarm optimization algorithm to maximize the entropy for underwater image segmentation. [14]
Madhubanti et al proposed a hybrid cooperative-comprehensive learning based PSO algorithm (HCOLPSO) based on maximum entropy criterion.[8] Yin (2007) developed a recursive programming techniques to reduce the order of magnitude of computing the multilevel thresholds and further used the PSO algorithm to minimize the cross entropy. [13]Horng (2010) applied the honey bee mating optimization (HBMO) to search for the thresholds of histogram of image.[4] The developed method was called the maximum entropy honey bee mating optimization (MEHBOT) algorithm. The experimental results demonstrated that the result of the MEHBOT algorithm was superior to other algorithms such as the PSO, HCOLPSO and Fast Otsu’s methods. Hammouche et al (2009) compared various meta-heuristic techniques implemented in the multilevel thresholding. They found that the differential evolution was the most efficient and the particle swarm optimization converged the most quickly.[3]
Eusuff and Lansey (2003) proposed the shuffled for leaping optimization through observing, imitating and modeling the behavior of frogs searching for food laid on the discrete stones randomly located in a pond.[2] In essence, the SFLA is a memetic meta-heuristic algorithm that is based on the evolution of memes carried by individuals and a global exchange of information among the population. It combines the advantages of the global search behavior such as the particle swarm optimization and the idea of the mixing information from the local search so as to move toward the global optimal solution. This paper applies the SFLO algorithm to search for the multilevel thresholds using the maximum entropy (MET) criterion. This proposed method is called the maximum entropy based shuffled frog-leaping algorithm thresholding (MESFLOT) algorithm. In the experiments presented in this paper, the exhaustive search method is conducted to derive the optimal solutions for comparison with the results generated from MESFLOT method. The four different methods, -- the PSO, the hybrid cooperative-comprehensive learning based PSO algorithm (HCOCLPSO), the Fast Otsu’s method, and the MEHBMOT -- are implemented in the several real images for purposes of comparison. [10]
EXPERIMENTAL SECTION
The SFLO algorithm is a meta-heuristic method that mimics the memetic evolution of a group of frogs as seeking for the position that has the maximum amount of available food. These fogs are seen as host for memes and describe as a memetic vector with the same structure but different adaptabilities, They can communicate with each other and improve their memes by inflecting (pass information among) each other. Generally speaking, in applying SFLO algorithm to optimization problems, each frog associated with its adaptability that defined by a specific fitness, generally represents a feasible solution to problem. These frogs (ie. solutions) are partitioned into a lot of subsets referred to as memeplexes. The different memeplexes are considered as different cultures of frogs, and then, frogs in each memeplexes performs local search according to specific strategies to allow the transference of meme among them. After a pre-defined number of memetic evolution steps, information is passed between memeplexes in a shuffling process. The local search and shuffling process are carried out alternatively until the defined convergence criterion is satisfied. The SFLO algorithm is described as follow. Specifically, assume that the initial population is created by F randomly generated frogs Xi, i=1,2,…,F. The fitness of Xidefined by f(Xi)is used to evaluate the frog’s performance. Furthermore, all frogs are sorted in a descending X order and divided into m memeplexes,
m
Y Y Y1, 2,...,
based on the Eq. (1), thereby, each memeplex contains n frogs, that is to say, Fmn.
.} ,..., 2 , 1 and . ,.., 2 , 1 ,
{X X X ( 1)i n k m
Y k mi
k i k i
k
(1)
further, the frog with the global best fitness among all frogs is defined as Xg. The local evolution search is carried out in parallel in each memeplex to modify according to the following updating rules.
) (
() Xb Xw
rand
D (2)
D X Xw' w
, DminDDmax (3)
Where rand() is a random number generating function ranged from 0 to 1; and Dminand Dmaxare the maximum and
minimum allowed change in the frog’s position. If this process generates a better frog '
w
X , it replace the worst one Xw, else the global best frog Xgis used to replace Xb to carry out the above updating rules. If there is still no improvement, a feasible solution to replace Xwis randomly generated. The calculations continue for a pre-determined number of iterations within each memeplex, and further, the whole population is mixed together in the shuffling process. The local exploration and global shuffling alternate until a pre-defined convergence condition is satisfied. The entropy criterion, proposed by Kapur et al (1985), was widely used in determining the optimal thresholding in image segmentation. The original algorithm had been developed for bi-level thresholding.[6] The method can also extend to solve multilevel thresholding problems and can be described as follows. Let there be L gray levels in a given image I and these gray levels are in the range {0, 1, 2,…, L-1}. Then one can define Pi h(i)/N, (0iL1)where
) (i
h denotes the number of pixels with gray-level i. N denotes total number of pixels in the image.
Here, given a problem to select D thresholds, [t1,t2,....,tD] for a given image I, the objective function f is to maximize:
D
D H H H H
t t t
f([1,2,..., ]) 0 1 2... (4)
1 1 1 2 2 2 1 2 1 1 1 1 1 1 1
0 0 0 0 1 0 0 ln , ,... ln , ln , ln , 3 2 3 2 2 1 2 1 1 1 D D D D t t i D i D i D t t i i D t t i i i t t i i t t i i i t t i i t i i i t i i P P H P P P H P P P H P P P H P
In our proposed MESFLOT algorithm, we try to obtain this optimum D-dimensional vector [t1,t2,....,tD], which can maximize (4). The objective function is also used as the fitness function of the MESFLOT algorithm.
In this paper, a shuffling frog-leaping optimization based on the maximum entropy thresholding algorithm is developed. The details of MESFLOT are introduced as follows.
Step 1. Generate the initial population of solutions.
The initial population of the P frogs (solutions), zi (i1,2,...,P), with c dimensions is generated randomly and then is
denoted by Z.
] ,..., , [z1 z2 zP
Z ,
) ,..., ,
( i,1 i,2 i,c
i z z z
z (5)
where the zi,jis the jth component value of zi, that is restricted into [0,…,L-1] and the zi,jzi,j1 for all j. Sets M0.
______________________________________________________________________________
Step 2. Sorting and distribution
In Step 2, each frog first computes their fitness value based on the Eq. (4), and then all frogs are sorted in descending order based on their fitness values. Secondly, all frogs are divided into m memeplexes, each containing n frogs (i.e.,
n m
P ), based on the following way that the first frog goes to the first memeplex, the second frog goes to the second, the m goes to the m memeplex and the m+1 frog goes to the first memeplex, etc. Sets the Ni=0; the Ni records the evolution number of the ith memeplex.
Step 3. Evolution of each memeplex
This step takes in any of memeplex, the fogs with the best and the worst fitness are denoted toXb and Xw, and further, the fog with the current global best fitness in all memeplexex is identified as Xg, respectively.
The worst frog Xwof each memeplex is improved by Eqs. (6) and (7).
) (Xb Xw
r
D (6)
D X
Xw w ,Dlimit DDlimit (7)
Where, the r is the random number ranged from 0 to 1; and theDlimit is the limit vector of the change of position for the worst frog updates. If the update generates a better solution, the new Xw replaces the old worst frog, else the original worst frog Xw tries to update its position by Eqs. (8) and (9) .
) (
1 r Xg Xw
D (8)
1 D X
Xw w ,Dlimit D1Dlimit (9)
If the new position of Xwimproves the old frog, the new frog replaces with the old one, else the new frog is randomly generated to replace with the old one.. If the evolution number of ith memeplex,Ni, is less than Ndefined, and then set
i
N =Ni+1 and go to Step 3, else go to Step 4.
Step 4. Frogs shuffling
All frogs are collected and stored by their fitness values. Records the global best, Xg, and sets MM1 and Ni=0, for all memeplexes.
Step 5. Check the termination criterion
If M is equal toNmaximun, the convergence criterion is satisfied and program stops and outputs Xg as the
solution of the program, otherwise return to Steps 2-4.
RESULTS AND DISCUSSION
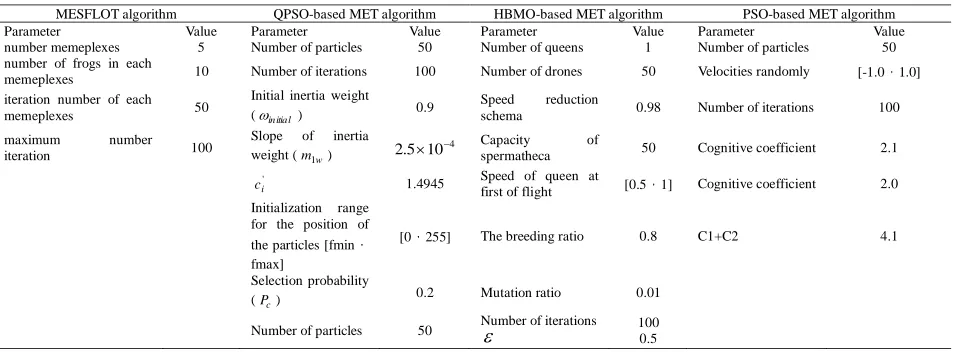
We implement all programs in Visual C++ 6.0 on a personal computer with 2.4GHz CPU, 1G RAM running window XP system. The used parameters of SFLO-based MCET algorithm inclide the number memeplexes is 5, the number of frogs in each memeplexes is 10, iteration number of each memeplexes is 50 and the maximum number iteration is 100. The used parameters of other five methods are shown in Table 1. Five images named “LENA” “PEPPER” “BIRD” “CAMERA” and “GOLDHILL” are used in conducting our experiments. The popular performance indicator, peak signa l to noise ratio (PSNR), is used to compare the segmentation results by using the multilevel image threshold techniques. For the sake of completeness we define PSNR, measured in decibel (dB) as
) 255 ( log
20 10
RMSE
PSNR (dB) (10)
where RMSE is the root mean-squared error, defined as:
N M
j i I j i I RMSE
M
i N
j
1 1
2
)) , ( ) , ( (
Here I and
Iare original and segmented images of sizeMN, respectively.
[image:5.612.70.547.220.396.2]First, we execute the MESFLOT algorithm on partitioning the five test images. The exhaustive search is also conducted for deriving the optimal solution for comparison. Table 2 shows the selected thresholds derived by the MESFLOT algorithm and the optimal thresholds generated from the exhaustive search method. We find that the selected thresholds of MSFLOT algorithm are equivalent or very close to optimal thresholds derived by the exhaustive search methods. Furthermore, we find that the computation times of exhaustive search method grows exponentially with the number of required thresholds. Obviously, the computation needs for the exhaustive search are absolutely unacceptable for T4(T: number of thresholds). The computation times of the MESFLOT algorithm is significantly faster compared to the exhaustive search algorithm.
Table 1. Values of parameters of each of the four algorithms
MESFLOT algorithm QPSO-based MET algorithm HBMO-based MET algorithm PSO-based MET algorithm
Parameter Value Parameter Value Parameter Value Parameter Value
number memeplexes 5 Number of particles 50 Number of queens 1 Number of particles 50
number of frogs in each
memeplexes 10 Number of iterations 100 Number of drones 50 Velocities randomly [-1.0,1.0]
iteration number of each
memeplexes 50
Initial inertia weight (initial) 0.9
Speed reduction
schema 0.98 Number of iterations 100
maximum number
iteration 100
Slope of inertia
weight (m1w) 2.5104
Capacity of
spermatheca 50 Cognitive coefficient 2.1
'
i
c 1.4945 Speed of queen at
first of flight [0.5,1] Cognitive coefficient 2.0
Initialization range for the position of
the particles [fmin, fmax]
[0,255] The breeding ratio 0.8 C1+C2 4.1
Selection probability
(Pc) 0.2 Mutation ratio 0.01
Number of particles 50 Number of iterations 100
[image:5.612.134.480.431.670.2]0.5
Table 2. The selection thresholds for five test images by using the MESFLOT algorithm and the exhaustive search method ( k: number of thresholds)
Table 3. Thresholds, computation times, PSNR values and Fitness values for test images by using MESFLOT algorithm
Image Number of thresholds Thresholds Computation time (ms) PSNR (dB) Fitness Value
LENA 2 80,150 1.01 15.46 12.6990
) 512 512
( 3 60,109,160 3.54 18.55 15.7658
Image (size)
k
Exhaustive MESFLOT
Thresholds Computation time (ms) Thresholds Computation time (ms)
LENA 2 80,150 4.89 80,150 1.01
) 512 512
( 3 60,109,160 158.49 60,109,160 3.54
4 56,100,144,182 8290 56,100,144,182 22.39
5 44,79,114,150,185 451304 44,79,115,148,187 139.35
PEPPER 2 74,146 3.73 74,146 1.11
) 512 512
( 3 61,112,164 145.58 61,112,164 3.98
4 57,104,148,194 7965 57,104,148,194 26.78
5 42,77,113,153,194 439784 42,77,113,153,194 124.35
BIRD 2 71,138 4.13. 71,138 1.34
) 256 256
( 3 70,129,177 132.67 70,129,177 3.89
4 51,96,139,177 6564 51,94,138,178 17.38
5 46,74,104,141,177 414789 45,74,105,142,177 119.35
CAMERA 2 128,193 4.54 128,193 1.48
) 256 256
( 3 44,104,193 138.67 44,104,193 3.42
4 44,97,146,197 7169 44,97,146,197 22.34
5 40,84,119,155,197 439697 40,83,119,154,197 139.64
GOLDHILL 2 90,157 5.57 90,157 1.09
) 256 256
( 3 79,132,178 140.17 79,132,178 3.46
4 67,108,151,191 7190 67,108,151,191 23.25
______________________________________________________________________________
4 56,100,144,182 22.39 19.71 18.5875
5 44,79,115,148,187 139.35 21.76 21.2512
PEPPER 2 74,146 1.11 16.47 12.6348
) 512 512
( 3 61,112,164 3.98 18.42 15.6892
4 57,104,148,194 26.78 19.21 18.5397
5 42,77,113,153,194 124.35 21.81 21.2830
BIRD 2 71,138 1.34 17.44 11.1647
) 256 256
( 3 70,129,177 389 18.53 13.8659
4 51,94,138,178 17.38 20.84 16.4558
5 45,74,105,142,177 119.35 22.67 18.6567
CAMERA 2 128,193 1.4 13.65 12.1688
) 256 256
( 3 44,104,193 3.42 14.61 15.2274
4 44,97,146,197 22.34 20.21 18.3995
5 40,83,119,154,197 139.64 22.59 21.0831
GOLDHILL 2 90,157 1.09 14.26 12.5384
) 256 256
( 3 79,132,178 3.46 16.05 15.5957
4 67,108,151,191 2325 18.60 18.3957
5 59,96,131,167,201 11.87 20.98 21.0687
[image:6.612.115.498.428.654.2]First, we execute the MESFLOT algorithm on partitioning the five test images. The exhaustive search is also conducted for deriving the optimal solution for comparison. Table 2 shows the selected thresholds derived by the MESFLOT algorithm and the optimal thresholds generated from the exhaustive search method. We find that the selected thresholds of MSFLOT algorithm are equivalent or very close to optimal thresholds derived by the exhaustive search methods. Furthermore, we find that the computation times of exhaustive search method grows exponentially with the number of required thresholds. Obviously, the computation needs for the exhaustive search are absolutely unacceptable for T4(T: number of thresholds). The computation times of the MESFLOT algorithm is significantly faster compared to the exhaustive search algorithm. .For evaluating the performance of the proposed MESFLOT algorithm, we have implemented this method on the five test images. The performance metrics for checking the effectiveness of the method are chosen as the computation time so as to get an idea of complexity, and the PSNR which is used to determine the quality of the threshold images. Table 3 shows the selected thresholds, computation time, PSNR value and the corresponding fitness value of five test images with different thresholds. This table provides quantitative standard for evaluating. This table shows that the number of thresholds increase, the PSNR and the fitness value are enlarged.
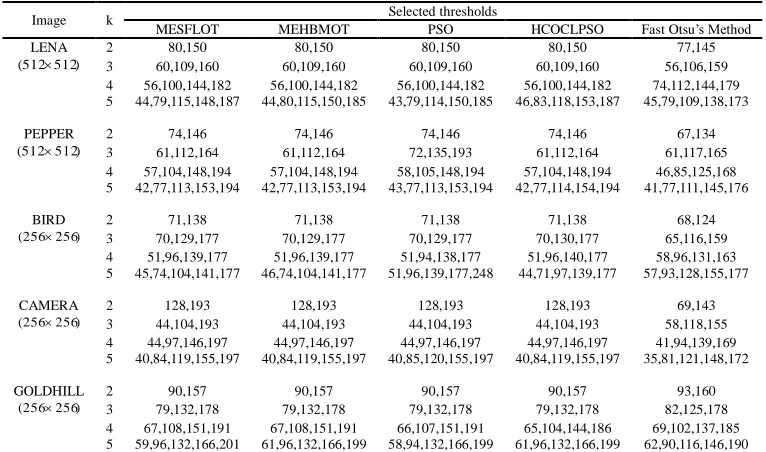
Table 4. Selected thresholds of test images by using five different thresholding algorithms
The MESFLOT and other four multilevel thresholding methods that are MEHBMOT, PSO, HCOCLPSO and Fast Otsu’s algorithms are implemented for the purpose of comparisons. Table 4 shows the selected thresholds of the five test images. It is interesting that the selected thresholds by the MESFLOT algorithm are equivalent (for 2- or 3-threshold problems) or very close (4- or 5-threshold problem) to the ones MEHBMOT algorithm; nevertheless, there are significant differences of selected thresholds with regard to the Fast Otsu’s method. This result reveals that the
Image k Selected thresholds
MESFLOT MEHBMOT PSO HCOCLPSO Fast Otsu’s Method
LENA 2 80,150 80,150 80,150 80,150 77,145
) 512 512
( 3 60,109,160 60,109,160 60,109,160 60,109,160 56,106,159
4 56,100,144,182 56,100,144,182 56,100,144,182 56,100,144,182 74,112,144,179
5 44,79,115,148,187 44,80,115,150,185 43,79,114,150,185 46,83,118,153,187 45,79,109,138,173
PEPPER 2 74,146 74,146 74,146 74,146 67,134
) 512 512
( 3 61,112,164 61,112,164 72,135,193 61,112,164 61,117,165
4 57,104,148,194 57,104,148,194 58,105,148,194 57,104,148,194 46,85,125,168
5 42,77,113,153,194 42,77,113,153,194 43,77,113,153,194 42,77,114,154,194 41,77,111,145,176
BIRD 2 71,138 71,138 71,138 71,138 68,124
) 256 256
( 3 70,129,177 70,129,177 70,129,177 70,130,177 65,116,159
4 51,96,139,177 51,96,139,177 51,94,138,177 51,96,140,177 58,96,131,163
5 45,74,104,141,177 46,74,104,141,177 51,96,139,177,248 44,71,97,139,177 57,93,128,155,177
CAMERA 2 128,193 128,193 128,193 128,193 69,143
) 256 256
( 3 44,104,193 44,104,193 44,104,193 44,104,193 58,118,155
4 44,97,146,197 44,97,146,197 44,97,146,197 44,97,146,197 41,94,139,169
5 40,84,119,155,197 40,84,119,155,197 40,85,120,155,197 40,84,119,155,197 35,81,121,148,172
GOLDHILL 2 90,157 90,157 90,157 90,157 93,160
) 256 256
( 3 79,132,178 79,132,178 79,132,178 79,132,178 82,125,178
4 67,108,151,191 67,108,151,191 66,107,151,191 65,104,144,186 69,102,137,185
segmentation results depend heavily on the objective function that is selected. Furthermore, the thresholds obtained by PSO algorithms in the segmentation of BIRD image are also distinct from the one of the MESFLOT algorithm in 5-level thresholding. It is possible to reveal that the PSO algorithm is unsuitable to search for thresholds.[12]
CONCLUSION
In this paper, we have proposed a method, called the MESFLOT algorithm, for multilevel thresholds selection using the maximum entropy criterion. The MESFLOT algorithm simulates the behavior of swarming mechanisms of frogs to develop the algorithm to select the adequate thresholds for image segmentation. The experimental results of MESFLOT algorithm are promising, and then it encourages further researches for applying this algorithm to other image analysis problems such as automatic target recognition and complex document segmentation.
Acknowledgment
The author would like to thank the National Scien Council, under Grant No. NSC 101-2221-E-251-008 for support.
REFERENCES
[1]Abutaleb, A.S., 1989. Computer Vision Graphics image Process, 47: 22-32. [2]Eusuff, M.M., Lansey, K.E., 2003. Water Resour. Planning Manag. 129: 210-229.
[3]Hammouche, K., Diaf, M. & Siarry, P., 2010. Engineering Applications of Artificial Intelligence.23:676-688. [4]Horng, M.H., 2010. Applied Mathematics and Computation, 215:,3302-3310.
[5]Kittler, J. & Illingworth, J., 1986. Pattern Recognition, 19,:41-47.
[6]Kapur, J.N., Sahoo, P.K. & Wong, A.K.C., 1985. Computer Vision Graphics Image Processing, 29:273-285. [7]Liao, P.S., Chen, T.S. & Chung P.C., 2001. Journal of Information Science and.Engineering, 17:713-727. [8]Madhubanti M. & Amitava, A., 2008. Expert Systems with Application, 34: 1341-1350.
[9]Otsu, N., 1979. IEEE Transactions on Systems, Man, Cybernetics, SMC-9, 62-66.
[10]Sahoo, P.K., Soltani, S., Wong, A.K.C. & Chen, Y.C., 1988. Computer Vision raphics and Image Processing, 41:233-236.
[11]Wang, S., Chung, F.L. & Xiong, F., 2008. Pattern Recognition, 41: 117-129.
[12]Ye, Z.W., Chen H, Li, W. & Zhang, J.P., 2008. Automatic threshold selection based on Particle swarm Optimization algorithm, International conference on Intelligent Computation Technology and Automation, 36-39 [13]Yin, P.I., 2007. Mathematics and Computation, 184, 503-513.