Journal of Chemical and Pharmaceutical Research, 2013, 5(7):256-261
Research Article
CODEN(USA) : JCPRC5
ISSN : 0975-7384
Influence of surfactants on the solute-solvent interactions in aqueous solutions
of
α
-alanine at different temperatures
Smruti Pattnaik
1and UpendraNath Dash
21
U.N. Autonomous College, Adashpur
2Department of Chemistry, I.T.E.R., Siksha ‘O’ Anusandhan Deemed to be University, Bhubaneswar,Odisha (India)
_____________________________________________________________________________________________
ABSTRACT
Density (d) values of have been measured at 298.15, 303.15, 308.15, and 313.15K in three different compositions (0.1, 0.2 and 0.3 wt. %) of aqueous solutions ofsurfactants like TX-100, cetrimideand SDS.Partial molar properties of α-alanine,e.g.,apparent molar volume (VΦ), limiting apparent molar volume (VΦ⁰), apparent molar expansibility (EΦ), and limiting apparent molar expansibility (E⁰Φ) have been evaluated in these solutions from the density data. The ultrasonic velocity (U) values in these solutions have been measured at 298.15K only. Acoustical parameters such as isentropic compressibility (Ks), apparent molar compressibility, (Ks,Φ) and solvation number (Sn) have been
computed for these solutions from the values of ultrasonic velocity. The results are discussed in the light of molecular interactions in the solutions.
Keywords: α-alanine, TX-100, Cetrimide, Sodium dodecyl sulphate, ultrasonic velocity.
_____________________________________________________________________________________________
INTRODUCTION
The study of surfactants – protein interactions is very important for immunology, pharmacology, and medicine. Due to complex molecular structure of proteins direct study is quite difficult. So the amino acids which are the building blocks of proteins are studied. In continuation of our previous work in aqueous medium [1],the present investigation
aims at studying the molecular interactions of α-alanine in aqueous solutions of (0.1, 0.2 and 0.3 wt.%)
surfactants(TX-100,cetrimide and SDS) ranging from 298.15K to 313.15K at an interval of 5K. Various parameters
such as apparent molar volume (VΦ), limiting apparent molar volume (V⁰Φ) , apparent molar expansibility (EΦ),
limiting apparent molar expansibility (E⁰Φ), isentropic compressibility (Ks),apparent molar compressibility(Ks,Φ)
have been calculated from the density (d) and ultrasonic velocity (U) data, respectively, which provide qualitative information regarding molecular interactions.
EXPERIMENTAL SECTION
All the chemicals used were of AnalaR grades and used as such. The solutions of α-alaninewere prepared on the
molalbasis and conversion of molality to molarity was done by using the standard expression [3] using the density
values of the solutions determined at 298.15K. Conductivity water (Specfic conductance ~10⁶ Scm-¹ ) was used to
prepare solutions of TX-100, cetrimide and SDS and the solutions were used on the same day. The densities of pure solvents and their solutions were determined by using a specific gravity bottle (25ml capacity) as described else
where [3]. At least 5 observations were taken and the differences in any two readings did not exceed ± 0.02%. The
ultrasonic velocity was measured by using Ultrasonic interferometer (Mittal Enterprises, New Delhi, Model No
F-81) using a frequency of 2MHz. The precision of the ultrasonic velocity measurement was within ± 0.5 m/s. The
glycine content in the solutions varied over a concentration range of 0.006 to 0.08 mol dm‾³ in various solvents.
Theoretical aspects:
From the density data the apparent molar volume (VΦ) was calculated by using equation [4]
VΦ= 1000 (cd0)
-¹(d0-d) + M₂d0
-¹ (1)
Where d0 is the density of solvent
It was found that the VΦ varied linearly withconcentration c1/2
The VΦdata were fitted by a method of least squares to Masson equation [4]
VΦ = V⁰Φ+ Svc1/2 (2)
to obtain V⁰Φ(limiting apparent molar volume) and the slope SE
The apparent molar Expansibility ,EΦ was determined from equation [4]
EΦ = α0VΦ + (α-α0) 1000c
-¹ (3)
The EΦ data were fitted by a method of least squares to the Masson equation [4]
EΦ = E⁰Φ + SEc1/2 (4)
The ultrasonic velocities ‘U’ of α-alaninein aqueous TX-100, cetrimide and SDS solutions at different concentrations were fitted to an equation of the form [5-7]
U = U₀ + Fc + Gc3/2 + Hc² (5)
U₀ is the sound velocity in pure solvent andF,G,H, are the empirical constants
U = (Ksd)-1/2 (6)
The values of Ks obtained were fitted to an equation of the form
Ks = Ks0 + A'c +B'c3/2 + C'c (7)
where A', B' and C' are the empirical constants.
The apparent molar compressibility Ks, Φ has been computed from equation (8) [5-7]
Ks, Φ= 1000 Ksc-1 – Ks0d0-1(1000c-1d-M2) (8)
The Ks, Φdata were fitted to Eqn. 9
Ks,Φ = K⁰s,Φ + F'c1/2+ G'c (9)
to obtain K0s, Φ (the limiting apparent isentropic compressibility)
The solvation number Sncan be related to Ks by equation (10)
Sn = n1n2-1[1-VKs(n1V10Ks0)-1] (10)
Where V is the volume of the solution containing n₂ moles of solute
V₁⁰ is the molar volume of solvent and n₁ is the number of moles of solvent
The variation of solvation number with molar concentration of the solute leads to the limiting solvation number, Sn0
which was obtained from the relation (11)
Lim Ks,φ = -Sn0V10Ks0 (11)
c->0
From the density and sound velocity values,the magnitude of relative association, RA was calculated from the
relation [5-7]
______________________________________________________________________________
RESULTS AND DISCUSSION
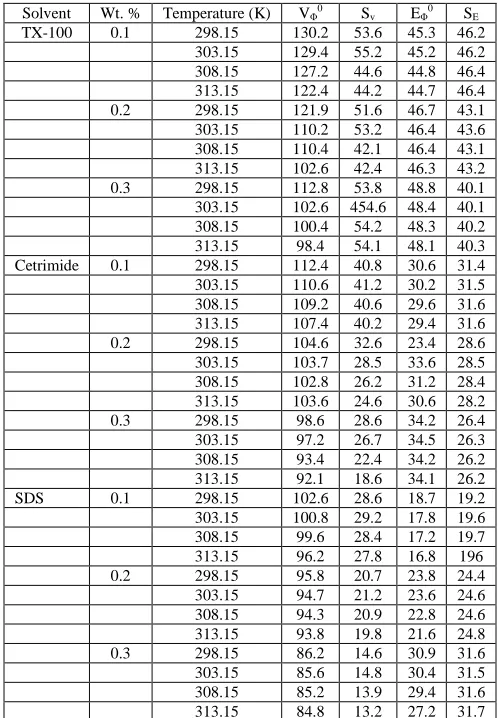
The values partial molar volume (VΦ0), partial molar expansibility (EΦ0), the slope (Sv) of the plot of VΦvs c1/2and
the slope SE of EΦvs c1/2 are given in Table1 for α-alanine in different compositions (0.1,0.2 and 0.3 wt. %) of
TX-100,cetrimide, and SDS in water at temperatures ranging from 298.15K to 313.15K at an interval of 5K.
The density values of the solutions of α-alanine vary linearly with concentrations in all compositions of aqueous
solutions of TX-100, cetrimideand SDS at different temperatures.It was found that the VΦ values vary linearly with c
½
for all the solutions at the experimental temperatures (a typical plot is given in figure 1 at 298.15K for
0.1wt.%TX-100, cetrimide, and SDS). Since VΦ0value indicates the ion-solvent interactions at infinite dilution (as the ion-ion
interaction vanishes at infinite dilution), the positive values indicate the presence of ion-solvent interaction which decreases with rise of temperature. The presence of ion-solvent interactions between the molecules promotes
structure making effect of α-alanine in the solutions of surfactants. As observed (Table-1) the VΦ
0
values of
α-alanine are higher in all compositions of TX-100 than in cetrimide and SDS solutions pointing to the fact that ion-solvent interactions take place strongly in TX-100 solution as compared to the solutions of cetrimideand SDS.
As the magnitude of Sv is a measure of ion-ion interaction, the positive value of Sv, in most of the solutions, are the
indicative of strong ion-ion interaction. However, they vary with change of temperature and the content of
surfactants. As observed the magnitudes of VΦ0values are much greater than those of Sv for all the solutions which
[image:3.595.181.430.354.713.2]suggest that the ion-solvent interactions dominate over ion-ion interaction in all the solutions and at all experimental temperatures.
Table 1 : Values of VΦ0(m3 mol-1), Sv(m3/2 mol-3/2), EΦ0(m3 mol-1 K-1), and SE(m3/2 mole-3/2 K-1) for αααα-alanine in different compositions (0.1,
0.2 and 0.3 wt. % of TX-100, cetrimide and SDS solutions at different temperatures)
Solvent Wt. % Temperature (K) VΦ0 Sv EΦ0 SE
TX-100 0.1 298.15 130.2 53.6 45.3 46.2 303.15 129.4 55.2 45.2 46.2 308.15 127.2 44.6 44.8 46.4 313.15 122.4 44.2 44.7 46.4 0.2 298.15 121.9 51.6 46.7 43.1 303.15 110.2 53.2 46.4 43.6 308.15 110.4 42.1 46.4 43.1 313.15 102.6 42.4 46.3 43.2 0.3 298.15 112.8 53.8 48.8 40.1 303.15 102.6 454.6 48.4 40.1 308.15 100.4 54.2 48.3 40.2 313.15 98.4 54.1 48.1 40.3 Cetrimide 0.1 298.15 112.4 40.8 30.6 31.4 303.15 110.6 41.2 30.2 31.5 308.15 109.2 40.6 29.6 31.6 313.15 107.4 40.2 29.4 31.6 0.2 298.15 104.6 32.6 23.4 28.6 303.15 103.7 28.5 33.6 28.5 308.15 102.8 26.2 31.2 28.4 313.15 103.6 24.6 30.6 28.2 0.3 298.15 98.6 28.6 34.2 26.4 303.15 97.2 26.7 34.5 26.3 308.15 93.4 22.4 34.2 26.2 313.15 92.1 18.6 34.1 26.2 SDS 0.1 298.15 102.6 28.6 18.7 19.2 303.15 100.8 29.2 17.8 19.6 308.15 99.6 28.4 17.2 19.7 313.15 96.2 27.8 16.8 196 0.2 298.15 95.8 20.7 23.8 24.4 303.15 94.7 21.2 23.6 24.6 308.15 94.3 20.9 22.8 24.6 313.15 93.8 19.8 21.6 24.8 0.3 298.15 86.2 14.6 30.9 31.6 303.15 85.6 14.8 30.4 31.5 308.15 85.2 13.9 29.4 31.6 313.15 84.8 13.2 27.2 31.7
The values of limiting apparent molar expansibility EΦ0(Table 1) are also positive and decrease with increase of
EΦ0values in TX-100 solutions as compared to those in cetrimide and SDS-solutions suggest that the appearance of caging or packing effect occurs to a greater extent in the former solution than in the latter two solutions.
A study of ultrasonic behaviour of solutions of α-alaninein different compositions of TX-100, cetrimide and SDS in
water at 298.15K reveals that the sound velocity increases and the isentropic compressibility (Ks) decreases as the
contents of TX-100, cetrimide and SDS in water increases. The values of U0 and the empirical constants F, G and H
are given in Table 2.
Table-2 :Values of U0 (ms-1) and the constants F, G, H at 298.15K
α-alanine Solvent Wt.% U0 (ms-1) F G H
Water 0.0 1510.0 386.41 582.48 1932.86 TX-100 0.1 1616.0 612.8 229.2 1832.6
0.2 1624.8 786.4 396.4 1541.6 0.3 1632.0 823.2 191.2 1392.4 Cetrimide 0.1 1552.0 938.2 -1931.0 712.8
0.2 1564.0 526.2 -1365.2 623.4 0.3 1572.0 465.4 -1024.6 1816.7 SDS 0.1 1524.0 1022.4 627.4 -2022.2
0.2 1536.8 812.2 -1413.2 -1914.6 0.3 1544.0 413.4 -1028.4 -1128.2
Such changes are also reported by other workers in other aqueous solvent mixtures like water + methanol [10], water + PG [11]. As observed, the sound velocity increases with increase in concentrations of the solutions in TX-100, cetrimide and SDS. The values of sound velocities of α-alanine are higher in TX-100 solutions than in the solutions of cetrimide and SDS. This is because of the higher mass of TX-100 as compared to cetrimide and SDS.(a typical
plot of U –U0/c vs c1/2 in different solutions is given in figure 2 for 0.2 wt.% of surfactants). The value of isentropic
compressibility (Ks) decreases with increase in concentration of the solutions in all the surfactants (a typical plot of
Ks – Ks0 / c vs c ½ are given in figure 3 for 0.3 wt. % of surfactants). As observed the values of Ks of α-alanine are
less in TX-100 solution than in cetrimide and SDS solutions and are in the reverse order to the sound velocities.
Fig.1:Plot of Vⱷ vs.C1/2 in 0.1 wt% of TX-100,Cetrimide ,SDS.
0 20 40 60 80 100 120
0 5 10
v ⱷ in m 3m o l -1 c1/2 TX-100 CETRIMIDE SDS
Fig.2:Plot of U-U0/C vs.C1/2 in 0.1 wt% of TX-100,Cetrimide ,SDS at 298.15K. 0
500,000 1,000,000 1,500,000 2,000,000
0 5 10
U -U 0 /C i n m s -1 m o l -1 d m 3 C1/2 TX100 CETRIMIDE SDS
Fig.3:Plot of Ks-K0/C vs.C1/2 in 0.3 wt% of TX-100,Cetrimide ,SDS at
-30 -20 -10 0
0 5 10
______________________________________________________________________________
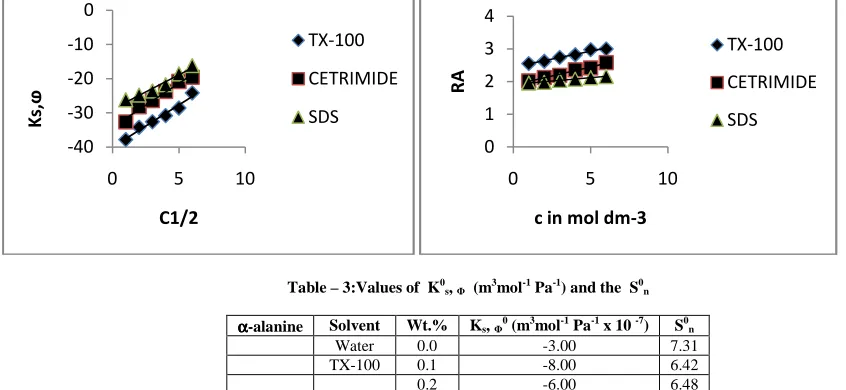
The apparent isentropic molar compressibility Ks,Φ increases with concentration of the solutions of α-alanine in all
the surfactants. The values of Ks,Φ are negative and so also the values of K
0
s,Φ[18]. The negative values may be
explained by two different phenomena, i.e., electrostriction and hydrophobic solvation.
The loss of compressibility of the sorrounding solvent molecules due to strong electrostrictive forces leads to the electrostrictive solvation. In other words, a tight solvation layer is formed around the ion for which the medium is
little compressed by application of pressure. A typical plot of Ks,Φ Vs. c1/2 for 0.2 wt.% of TX-100, cetrimide and
SDS solutions are given in figure 4.
The values of K0s,Φ and S0n are given in Table3 for α-alanine in aqueous TX-100, cetrimide and SDS solutions.
Another property [12,13] which also can be studied to understand the ion-ion or ion-solvent interaction is relative
association RA(a typical plotof RAvs. c in 0.2 wt. % of TX-100, cetrimideand SDS is shown in figure 5). The relative
association is influenced by two factors : (i) the breaking up of the solvent structure on addition of solute to it and
(ii) the solvation of solute. The former results in the decrease and the lattrer results in increase in RA. The increase in
RA with conc.(Fig:5 ) suggests that the solvation of α-alanine in surfactants predominates over breaking-up the
solvent structures. It is observed that RA increases linearly with concentration of the solutions of α-alanine in
[image:5.595.72.495.288.483.2]TX-100,cetrimideand SDS.
Table – 3:Values of K0
s, Φ (m3mol-1 Pa-1) and the S0n α
αα
α-alanine Solvent Wt.% Ks, Φ0 (m3mol-1 Pa-1 x 10 -7) S0n
Water 0.0 -3.00 7.31
TX-100 0.1 -8.00 6.42
0.2 -6.00 6.48
0.3 -6.00 6.72
cetrimide 0.1 -4.00 5.46
0.2 -0.8 5.48
0.3 -6.00 5.84
SDS 0.1 -8.00 4.92
0.2 -0.2 4.96
0.3 -7.00 4.98
The Sn values also increased with increasing TX-100, cetrimideand SDS content in water. Higher Sn0 values in
aqueous TX-100 indicates strong electrostriction as compared to aqueous cetrimide and SDS solutions. However the
variation of Sn
0
as well as Sn values predicts the degree of hard electrostrictive solvation. It represents a structural
effect of solute on solvent in a solution.
CONCLUSION
The results of the present investigations on alanine in aqueous TX-100, cetrimideand SDS solutions reveal that α-alanine shows high ion solvent interaction in solutions of surfactants. The higher sound velocity values of α-α-alanine in aqueous TX-100 solutions than in aqueous cetrimideand SDS solutions are due to higher mass of benzoate anion
in the solution. The decrease in value of Ks with increase in concentration of solutions may be due to occupation of
the interstitial spaces of water by the solute molecules thereby making the medium less compressible. The increase
in RA values with increase in concentration of solution indicates that ion-solvent interaction dominates over ion-ion
interaction in all the solutions. The variation of Sn0 values predicts the degree of hard electrostrictivesolvation, i.e., it
represents the structural effect of α-alanine on the solutions surfactants.
-40 -30 -20 -10 0
0 5 10
K
s,
ⱷ
C1/2
TX-100
CETRIMIDE
SDS
0 1 2 3 4
0 5 10
R
A
c in mol dm-3
TX-100
CETRIMIDE
REFERENCES
[1] S. Pattnaik and U.N. Dash J.Chem. Pharm. Res., 4(9),2012:4364-4369.
[2] R.A Robinson; R.H. Stokes, Electrolyte Solutions, Butterworths, Scientific Publication, London,1955,p.30. [3] U.N Dash; S.Supkar ,Acoust.Letters,1992, 16,135.
[4] H.S. Harned; B.B. Owen.,The Physical Chemistry of Electrolyte Solutions, 3rd, edn.,Reinhold , New York, 1958
[5] P.S. Nikam; M. Hassan, Indian J. Pure & Appl. Phys.1986, 24,502. [6] M. Kaminsky; Disc Faraday Soc.1957, 24, 171.
[7] A. Passinsky; Acta. Phys. Chem., USSR,1930,8,835.
[8] S.Thirumaran; R. Murugan; N. Prakash.,J. Chem.Pharm., Res.,2010,2(1),(53). [9] S .Thirumaran;S.Sudha,J. Chem.pharm Res2010 2(1) 327.
[10] A.K. Chattopadhya; S.C. Lahiri, Eleetrochem.Acta.1982, 27, 269. [11] U.N.Dash; P.K. Padhi, The Research Network,2010, 5(3),1. [12] H. Eyring; J.F Kincaid, J.Chem.phys,1977,6,728.
[13] Saneel K Thakur;ShivaniChauhan,J.Chem Pharm. Res., 2011,3(2),657. [14] U.N.Dash; N.N. Pasupalak, J. mol. Liquids, 1998, 76,97.
[15] C.Sharma; Indian, J. Pure &Appl, Physics,1989, 27,32.
[16] Rose Venis; Rosario Rajkumar,J.Chem. Pharm. Res., 2011,3(2),878.