Journal of Chemical and Pharmaceutical Research, 2012, 4(6):2919-2927
Research Article
CODEN(USA) : JCPRC5
ISSN : 0975-7384
Thermal Behavior, X-Ray Diffraction and Morphological Studies on
Renewable Resources Based Interpenetrating Polymer Networks
N. Mohanty
1, B. N. Guru
1, S. Mopapatra
2, N. C. Pal
*2and S. Lenka
21
Department of Chemistry, Ajay Binay Institute of Technology, CDA, Cuttack, Odisha, India
2Laboratory of Polymers and Fibers, Department of Chemistry, Ravenshaw University, Cuttack, Odisha, (India)
_____________________________________________________________________________________________
ABSTRACT
Agricultural wastes and natural oils have taken the priorities as raw materials for synthesis of polymers over the traditional petrochemical based raw materials. Interpenetrating Polymer Networks based on polyurethane of polyol modified linseed oil and 1,6-diisocyanatohexane with phosphorylated cardanol using benzoyl peroxide as initiator and ethylene glycol dimethacrylate as crosslinker were synthesized. The chemical structures of these polymers were confirmed by Fourier Transform Infrared Spectra. Various Thermal Analysis techniques were used to determine the percentage of decomposition of such polymer blends at the interval of 50O celsius , ascertain the relative thermal stability of the polymers, evaluate temperatures of maximum rate of decomposition and study the exothermic and endothermic behavior of associated with decomposition process. Kinetic constants, order of reaction and energy of activation, were calculated at two different temperature ranges for the thermal degradation of polymers by the dynamic Freeman-Anderson method. It was observed that the relative thermal stability of such biopolymers not only depends on the NCO/OH molar ratio of the polyurethane component but also depends on the PU/PC weight ratio of the Interpenetrating Polymer Networks. The calculated kinetic parameters were also in good tune with observed thermal data. Surface morphology was studied by X-ray diffraction analysis and scanning electron microscopy. It was observed that the variation of NCO/OH molar ratio and PU/PC weight ratio has appreciable effect on the crysrtallinty and surface morphology of the polymers.
Keywords: Phosphorylated Cardanol, Linseed Oil, Polyurethanes, Interpenetrating Polymer Networks.
_____________________________________________________________________________________________
INTRODUCTION
______________________________________________________________________________
natural and agricultural resources of India by carrying out the result oriented study of techno economic feasibility of converting such resources into low cost IPNs with improved properties from the view point of commercial applications to meet the present demand for the reduction of consumption of petrochemical derivatives.
EXPERIMENTAL SECTION
Synthesis of Polyurethanes (PUs)
Linseed oil was heated to 250-260OC in an inert nitrogen atmosphere with 0.1568 g of PbO i.e. 0.05% litharge (oil basis) as catalyst and 80mL (1.5 times stoichiometric quantity) of glycerol with constant stirring to obtain polyol modified linseed oil (PL) . 0.708g of polyol modified linseed oil was reacted with 0.504g of hexamethylene-1,6- diisocyanate (HMDI) at 45OC in methyl ethyl ketone (MEK) as solvent with constant stirring for 45 min until a viscous prepolymer (polyurethane) [14,15] separated out with NCO/OH molar ratio at 1.5. The same procedure was followed to prepare PU with NCO/OH molar ratio at 2.0.
Synthesis of Interpenetrating Polymer Networks (IPNs)
[image:2.595.207.407.409.456.2]Anacardic acid (2-carboxylic -3- pentadecadienylphenol), the major component of Cashew Nut Shell Liquid was decarboxylated to cardanol by vacuum distillation [16-17]. A mixture of 150g (0.5 mol) cardanol and 49g of (0.5 mol) ortho-phosphoric acid was condensed at 175OC under vacuum to obtained phosphorylated cardanol (PC). The mixture of polyurethane (PU) and phosphorylated cardanol (PC) with different weight – to – weight ratios ( 35:65 ; 50:50) for 1.5 NCO/OH molar ratio and a weight - to - weight ratio (50:50) for 2.0 NCO/OH molar ratio were separately taken in MEK in a reaction vessel in presence of BPO and EGDM. The mixture was constantly stirred at room temperature by means of a magnetic stirrer for 15 min to get a homogeneous solution and thereafter the temperature was raised to 75OC to initiate the polymerization and stirring was continued for about 1h to get a viscous mass which was poured into a glass mould and kept in a preheated oven at 750C for 24h. The thin film thus formed was cooled and removed from the mould and labeled. The feed composition data of the IPNs are furnished in Table 1.
Table 1 Feed Composition Data of IPNs
Sample
Code Composition
NCO/ OH molar ratio
PU / PC (wt. ratio)
IPN-1 PLa + HMDIb + PCc 2.0 50:50
IPN-2 PL + HMDI + PC 1.5 50:50
IPN-3 PL + HMDI + PC 1.5 35:65
a Polyol modified linseed oil , b Hexamethylene diisocyanate ,c Phosphorylated cardanol
RESULTS AND DISCUSSION
FTIR spectral analysis
The infrared spectra of the Interpenetrating Polymer Networks (IPNs) were obtained using Perking Elmer FTIR spectrometer model paragon 1000.
The FTIR spectrum was used mainly to confirm the presence of component materials in the IPNs. The characteristic absorptions of IPN-1 corresponding to N-H stretching of >NH group at 3488.15 cm-1, C-H stretchings (ss/as) of >CH2 and –CH3 groups at 2900.01 cm-1 and 2926.11cm-1, N≡C stretching of –N=C=O for isocyanate terminating PU
unit at about 2444.00 cm-1, C=O stretching of >C=O in urethane linkage at 1738.95 cm-1 were observed (Fig.1).
Similar characteristic absorption peaks were observed for IPN-2 and IPN-3 as shown in Fig. 2 and Fig. 3 respectively.
Thermal analysis
Perkin Elmer Thermal Analyzer model PYRIS diamond USA was used for TGA, DTG and DTA measurements. 6.208 mg of IPN-1 with 5.5 mg alumina as reference was scanned between 45OC and 660OC at a heating rate of 10O Celsius / minute in an inert nitrogen atmosphere (N2 100g/min) (Fig.4). In a similar way other IPNs were scanned
______________________________________________________________________________
Figure 1: FTIR of IPN-1
Figure - 2 : FTIR of IPN-2
Figure - 3 : FTIR of IPN-3
______________________________________________________________________________
[image:4.595.146.472.158.725.2]the range of 400OC- 450OC [10] along with main functional groups such as –OH, >NH, >C=O etc. and due to partial decomposition of cross linking with EGDM between PU and PC unit. Finally, about 8% of weight loss recorded in the range of 450OC to 600OC can be due to complete decomposition of crosslinkings with EGDM between PU and PC units.
Figure 4 : TG/DTG/DTA of IPN-1
Figure 5: TG/DTG/DTA of IPN-2
[image:4.595.151.459.172.321.2]______________________________________________________________________________
Table 2: Percentage of Thermal Decomposition of the IPNs at various Temperatures (0C)
Sample Code 100 150 200 250 300 350 400 450 500 550 600 650
IPN-1 0.27 0.48 1.4 5.79 27.98 57.4 76.66 89.18 96.27 96.37 96.37 96.4
IPN-2 0.09 0.18 1.04 5.91 29.11 55.95 72.52 86.77 97.02 97.10 97.10 97.1
IPN-3 0.55 0.46 1.78 7.51 35.17 60.46 76.00 86.53 96.94 97.07 97.1 97.1
Table3 DTA data of IPNs
Sample Code Composition NCO / OH molar ratio PU/PC
wt. ratio Temperature
oC DTA Peak/oC % of
decomposition
endo exo
IPN-1 PL+ HMDI+ PC 2.0 50:50
150-250 214.42 05.31
250-450 307.00 83.39
450-600 562.62 07.19
IPN-2 PL+ HMDI+ PC 1.5 50:50
150-250 161.85 05.73
250-450 354.04 80.86
450-600 504.79 10.33
IPN-3 PL+ HMDI+ PC 1.5 35:65
150-250 185.16 07.05
250-450 546.85 79.02
450-600 347.86 10.57
From the thermal decomposition data it is evident that all the IPNs exhibit high thermal stability upto 250OC. The IPN-2 is thermally more stable than the IPN-1 between 250OC to 450 OC and thereafter there is no significant change in thermal stability of the two IPNs. The enhanced thermal stability of the IPN-2 compared to IPN-1 may be due to the increase in oil content of the PU component (the two IPNs having the same PU/PC weight ratio but varying NCO/OH molar ratio). Also IPN-2 is thermally more stable than IPN-3 in the same temperature range as expected due to the increase in PU content in the IPN-2 and the PU being linear is subjected to more crosslinkings.
Between 250 OC and 350 OC the order of thermal stability is IPN-2> IPN-1 > IPN-3. It is further observed that thermal stability values of IPN-1 and IPN-2 between 350OC and 450OC are comparable where as in the same temperature range IPN-3 is more stable than IPN-1. Above 450 OC there is no noticeable change in thermal stability of all the IPNs.
The study of TGA is supplemented by the study of its first derivative (DTG) curves. The DTG curves show the rate of thermal decomposition (µg / min) with respect to temperature. The DTG curve in Fig-4 shows that the IPN-1 has three peaks at 298OC, 387 OC and 439OC with corresponding 454.5µg/min, 227.545µg/min and 144.84 µg/min rate of decomposition. The DTG curves in Fig-5 and 6 show similar peaks at 293OC with 467.15 µg/min , 396OC with 305.92 µg/min and 459OC with 218.71 µg/min rate of decomposition for IPN-2 and at 294OC with 510.59 µg/min , 385OC with 239.57µg/min and 462OC with 223.88 µg/min rate of decomposition for the IPN-3. Overall, all the three IPNs showed similar behavior, however IPN-3 recorded highest rate of decomposition 510.59µg/min at 294OC.
DTA thermograms of the IPN-1 show an endothermic peak at 214.42OC and exothermic peak at 49.35OC, but in range of 450OC to 600OC only one exothermic peak at 562.62OC is observed. Similar exothermic and endothermic peaks are also recorded for the IPN-2 and IPN-3 which are listed in the Table 3. The DTA curves indicate that the thermal decomposition process for all the three IPNs is a three step reaction.
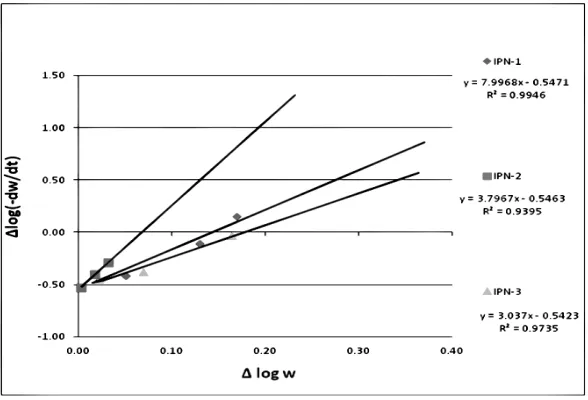
Kinetic Parameter Calculation
The mechanism of thermal degradation of polymers can be interpreted from calculation of kinetic parameters by the application of the Freeman-Anderson method.The equation used for the Freeman-Anderson method is
where -dw/dt is the rate of decomposition (calculated from DTG measurements), is the residual mass (calculated
______________________________________________________________________________
of ‘Ea’ and ‘n’ indicating the higher order of crosslinkings. The IPN-2 shows the highest order of reaction 7.99 in the temperature range 200oC to 315oC and hence is thermally most stable. The calculated kinetics parameters are in good agreement with the observed thermal data.
[image:6.595.161.455.138.338.2]Figure 7: Freeman-Anderson Plots for 200-315OC
Figure 8: Freeman-Anderson plots for 315 - 450 OC
Table 4 Kinetic Constants of Thermal Decomposition and Crystallinity of IPNs
Sample Code Temperature oC Ea
(kJ mol –1)
n Xcr
(%)
IPN-1 150-250 104.60 3.79 27.48
250-450 94.84 2.64
IPN-2 150-250 104.75 7.99 30.95
250-450 76.84 2.16
IPN-3 150-250 103.83 3.03 26.94
250-450 89.88 2.48
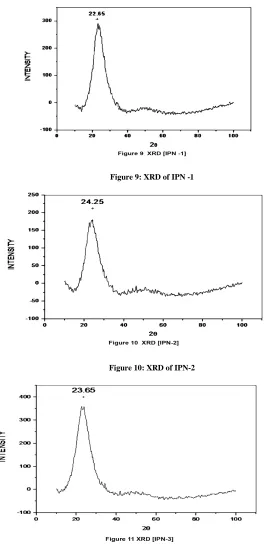
X-ray diffraction (XRD) analysis
The degree of crystallinity of IPNs has been calculated by using XRD method. The scanning regions of the diffraction angles were 10O to 30O which covered most of the significant diffraction peaks of the polymer crystallites. The equation for degree of crystallinity is as follows Xcr =Ac/(Ac+Aa) , Xcr refers to degree of crystallinity, Ac refers to crystallized area and Aa refers to amorphous area on the x-ray diffractogram. The
[image:6.595.171.450.373.553.2]______________________________________________________________________________
[image:7.595.154.418.116.662.2]curves to remove the background scattering. The degrees of crystallinity of the IPNs calculated from the Fig-9 to Fig-11 were about 30% given in Table 4. The degree of crystallinity increases with increase of PU content due to the linear nature of PU and also with decrease in NCO/OH molar ratio due to higher extent of cross linking.
Figure 9: XRD of IPN -1
Figure 10: XRD of IPN-2
Figure 11: XRD of IPN-3
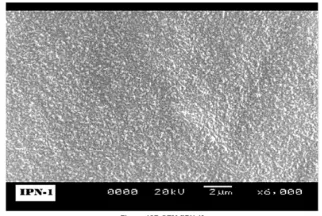
SEM Study
Fig-______________________________________________________________________________
[image:8.595.109.514.56.513.2]Figure 12A: SEM of IPN 1 Figure 12B: SEM of IPN-1
[image:8.595.334.495.75.183.2]Figure 13A: SEM of IPN-2 Figure 13B: SEM of IPN-2
Figure 14A: SEM of IPN-3 Figure 14B: SEM of IPN-3
CONCLUSION
The biopolymers produced from cashew nut shell liquid and triglyceride oil have added advantage over the polymers from petroleum based monomers. These polymers are expected to be eco-friendly, cheaper and easily accessible than the petroleum based polymers. Interpenetrating Polymer Networks prepared from polyol modified linseed oil and phosphorylated cardanol are largely cross linked and have higher thermal stability with high mechanical strength and improved morphological property. The ultimate properties of IPNs depend upon various factors such as type of diisocyanate, NCO/OH molar ratio, nature of monomer and PU/PC weight ratio.
Acknowledgement
The authors are thankful to the Registrar, Ravenshaw University, Odisha for his kind permission to publish this paper. The authors are also thankful to the Central Research Facility, IIT, Kharagpur for providing facility for the characterization of the samples. The authors are also thankful to the Ajay Binay Institute of Technology, Cuttack for providing facility to access the Journals in E-Library.
REFERENCES
[1] A Barreto , M Esmeraldo, D Rosa, P Fechine, S Mazzetto (2010), Polym Compos 31: 1928–1937. Doi: 10.1002/pc.20990
______________________________________________________________________________
[3] P Campaner , D D'Amico, P Ferri, Longo L, A Maffezzoli, C Stifani, A Tarzia (2010), Cardanol Based Matrix for Jute Reinforced Pipes. Macromol. Symp., 296: 526–530. Doi: 10.1002/masy.201051069.
[4] K Kumari, J. Chem. Pharm. Res., 2010, 2(4),892-89.
[5] S Gopalakrishnan; R Sujatha, J. Chem. Pharm. Res., 2010, 2(3),193-20. [6] CIS Raj; M Christudhas; GAG Raj, J. Chem. Pharm. Res., 2011, 3(6), 127-13.
[7] S Gopalakrishnan; NT Nevaditha; CV Mythili , J. Chem. Pharm. Res., 2011, 3(4),490-49.
[8] LS Parasa; T Sunita; KB Rao; AH Rao, JS Rao; LCA Kumar, J. Chem. Pharm. Res., 2011, 3(5),736-74. [9] LH Sperling (1981) Advances in Interpenetrating Polymer Networks (Lancaster:Technomic) 2 : 284.
[10] LH Sperling , JA Manson , CE Carracher , SP Quereshi , LW Barrett (1991) Polymers from biotechnology (C.G. Gebelline) Plenum Press, New York.
[11]P. Ganga Raju Achary, Namita Mohanty, B. N. Guru and Narayan Chandra Pal, J. Chem. Pharm. Res., 2012, 4(3):1475-1485
[12] KI Suresh, V S Krishanprasad (2005) Ind. Eng. Chem. Res. 44: 4504-4515.
[13] S Lenka, NC Pal, S Patra, D Praharaj (2004). International Journal of Plastics Technology 8 : 172-179. [14] D Akram, E Sharmin, S Ahmad (2010) J. Appl. Polym. Sci., 116: 499–508.
[15] F Yücedag, C Atalay-Oral, S Erkal, A Sirkecioglu, D Karasartova, F Sahin, S B Tantekin Ersolmaz, F S Güner (2010), J. Appl. Polym. Sci., 115: 1347–1357. Doi: 10.1002/app.30788.
[16] Smita Biswal, PGR Achary , N Mohanty , Narayan Pal (2011) International Journal of Plastics Technology 15(1): 52-67.