2018 3rd International Conference on Computational Modeling, Simulation and Applied Mathematics (CMSAM 2018) ISBN: 978-1-60595-035-8
Accelerating Remote Sensing Data Analysis Workflows by
On-demand Processing
Zhen-chun HUANG
1,*and Zhuo-jing TIAN
21
Department of Computer, Tsinghua University, Beijing, China
2
Beijing Key Laboratory of Information Service Engineering, Beijing, China
*Corresponding author
Keywords: Remote sensing, Data analysis, On-demand processing.
Abstract. In the recent decades, remote sensing data are rapidly growing in size and variety. In the traditional remote sensing analysis workflows, Earth science data users have to download raw data files to local workstations before processing them for science discoveries. The data transfer often costs a lot of time and slows down the analysis workflows. In most cases, results of remote sensing data analysis models are usually much smaller than raw data to be processed. Therefore, “on-demand processing”, which tries to upload data analysis models and execute them “near” data, can reduce the costs of data transfer and significantly accelerate the execution of remote sensing analysis workflows. In this paper, a framework, which enables on-demand remote sensing data analysis, is proposed. The evaluation on a prototype system shows that on-demand processing framework obviously accelerates the execution of analysis models by reducing data transfers, especially for those analysis workflows which transfer data through low bandwidth Internet.
Introduction
In the last years, new high spatial, temporal and radiometric resolution remote sensing systems based on satellite, airborne and ground are available continually. The volume of remote sensing data continues to multiply exponentially due to the launch of new flying platforms; hosting more powerful, multispectral, and accurate sensors. For example, the data amount managed by NASA’s Earth Observing System Data and Information System (EOSDIS) [1] is more than 9 Peta-Bytes in Jan. 2018, and still grows at 6.4 TB/day. At the same time, the increase of computing power enables simulations at a global scale with unprecedented accuracy. For many scientists, the ever-growing observation capability and computing power enable a completely new approach for data intensive scientific discovery known as Fourth Paradigm [2].
Besides its volume, remote sensing data is also characterized by a significant heterogeneity due to historical and technological reasons, including: different acquisition sensors, diverse methodology to describe the real world phenomena (e.g. field or coverage view and feature or boundary view), different encoding formats, etc. Meanwhile, remote sensing data analysis which is fast and accurate enough is still a great challenge, especially for those applications such as disaster warning and response, global mapping, and high resolution real-time parameter estimation. Therefore, it is widely accepted that earth sciences have been some of the disciplinary domains most strongly pushing, and potentially benefiting from, the e-Science approach, which are facing big data challenges. It is a great opportunity to enhance our knowledge of the Earth System, but it also poses great challenges.
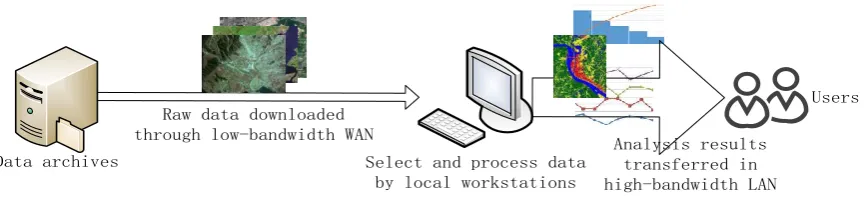
Users
Select and process data by local workstations Raw data downloaded
through low-bandwidth WAN Analysis results
[image:2.595.81.514.72.171.2]transferred in high-bandwidth LAN Data archives
Figure 1. Classical workflow for remote sensing data analysis.
In most cases, results of data analysis models are much smaller than raw data to be processed. If raw data can be on-demand processed “near” where they are stored, the time cost for data transfer will be reduced because only analysis results, which is much smaller, need to be downloaded through low-bandwidth WAN. It is often called “nearby processing” or “on-demand processing”. To process raw data “near” on-demand where they are stored, the remote sensing data analysis models need to be uploaded to processing nodes “near” raw data and dynamically deployed for execution. (Figure 2)
Metadata Directory
Da
ta
s
to
ra
ge Deploy and execute analysis models on-demand
Users
Select dataset and view analysis results through WAN Send data requests and upload analysis models
Transfer raw data through LAN
On-demand processing
Figure 2. On-demand processing workflow for remote sensing data analysis.
There are already some efforts at “on-demand processing” in both service computing and remote sensing data processing. For example, On-demand service in grid tries to speed up mass data processing service by “provide right service for user according to his requirement” in a SOA based grid-computing environment [3]. Furthermore, Web Coverage Processing Service (WCPS) [4] by the Open Geospatial Consortium (OGC), defines a protocol-independent language for the extraction, processing, and analysis of multi-dimensional coverages representing sensor, image, or statistics data. Davis et al. also tries to “move the tools required for processing data to computer system of data providers, and away from the data consumers” to “improve turnaround times for data processing workflows” in LP DAAC Satellite Data Archives [5].
But, there is still a lot of work for on-demand processing of remote sensing data analysis models, one of them is an extensible framework for on-demand processing environment, which makes them possible to build right runtime environments for data analysis models, deploy and invoke the models on given data sets, and control the input/output of runtime model instances.
In this paper, after the introduction about architecture design of the on-demand processing framework in section 2, section 3 discusses some implementation details, builds a prototype system based on the framework, and tests for its performance evaluation. At last, section 5 concludes the paper and discusses about future work.
Architecture
[image:2.595.73.515.287.466.2]Computing Nodes Storage Archived Data Software ……
Re
so
ur
ce
Environment Builder Model Deployer On-Demand Processing Adapter and Monitor
En
gi
ne
On-Demand Processing Dispatcher Users and Applications
Interaction and Result Collection On-Demand Processing Environment Description Model Description Control, Monitor and Parameters Co lla bo ra tio n Description Interpreter
Programming Interface and User Interface
On-Demand Processing Description
Resource Allocation Interface Resource Employment Interface
[image:3.595.108.490.71.270.2]Resource Allocation Resource Employment
Figure 3. Architecture.
There are three layers in the architecture. The bottom one is “resource layer”, with all kinds of resources for data processing, e.g., computing nodes, storage devices, archived data, and software components. In this layer, resources are organized as a “resource pool” for basic capabilities of on-demand processing system, such as data storage and processing.
In the engine layer, there are three major function modules: Environment Builder, Deployment Module, and On-Demand Processing Adapter/Monitor, which serves the three major steps for on-demand processing. Environment Builder creates a runtime environment for the remote sensing data analysis models to execute in, Model Deployment Module deploys the analysis models in the runtime environment founded by Environment Builder, and On-Demand Processing Adapter/Monitor invokes the deployed data analysis models and monitors their execution.
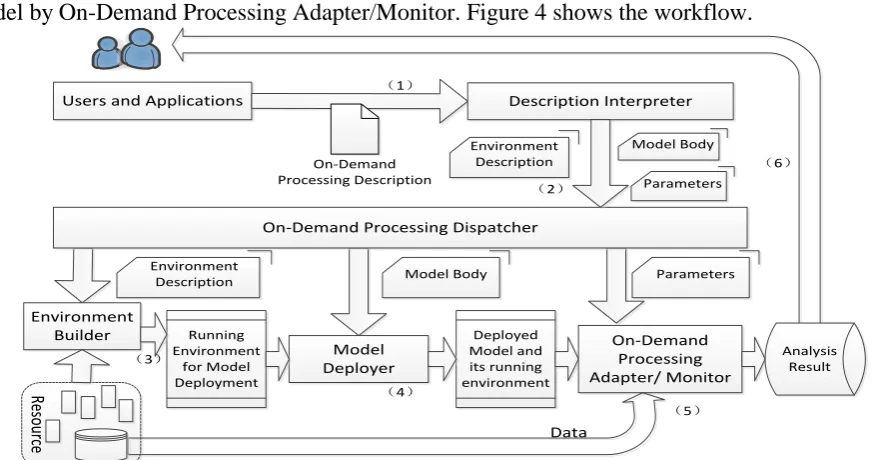
Collaboration layer, which is the top layer, is the most important layer in the on-demand processing framework. In this layer, Programming Interface or User Interface receives On-Demand Processing Descriptions first. Then, On-Demand Processing Description Interpreter parses the On-Demand Processing Descriptions and translates them as runtime environment descriptions, analysis model bodies, and parameters for models. At last, under the guidance of translated description, the On-Demand Processing Scheduler creates a runtime environment by Environment Builder, deploy the analysis model in the runtime environment by Deployment Module, invoke and monitor the analysis model by On-Demand Processing Adapter/Monitor. Figure 4 shows the workflow.
Users and Applications Description Interpreter
Environment
Description Model Body Parameters
On-Demand Processing Dispatcher
Running Environment for Model Deployment Environment Builder Model Deployer Re so urc e Deployed Model and its running environment On-Demand Processing Adapter/ Monitor Data Environment Description Model Body Parameters On-Demand Processing Description (1)
(2)
(3)
(4)
(5)
Analysis Result (6)
[image:3.595.75.514.535.765.2]To launch an on-demand processing workflow, user or client application must create a document named “On-Demand Processing Description”, which should think of everything about the on-demand data analysis processing jobs: what to do (Model Body), how to do (Launching Parameters), and what depends on (Runtime Environment Description). When the On-Demand Processing Description is submitted to the framework through the User Interface or Programming Interface (step (1) in figure 4), Description Interpreter parses and interprets the description into three parts (Runtime Environment Description, Model Body Description, and Launching Parameters), and send them to On-Demand Processing Dispatcher (step (2) in figure 4).
Under the guide of the three parts, the on-demand processing workflow starts. First, Environment Builder creates an appropriate runtime environment described by Runtime Environment Description based on resources provided by resource layer (step (3) in figure 4). Then, Model Deployer deploys the remote sensing data analysis model into the runtime environment under the guide of Model Body Description (step (4) in figure 4). At last, On-Demand Processing Adapter/Monitor starts the deployed analysis model by the Launching Parameters and monitors them in the runtime environment (step (5) in figure 4).
When the execution of analysis model accomplishes, results are collected and sent back to users or client applications through programming/user interface (step (6) in figure 4), and the workflow finishes.
Implementation Details and Performance Evaluation
For the successful deployment of analysis models, it is very important to describe the runtime environment fully detailed, including the hardware platform, operating system, compilers, static/dynamic libraries, APIs, etc. It is the duty of Runtime Environment Description, which often adopts XML format. With a detailed list of frequently used platforms, operation systems, libraries, and toolkits, Runtime Environment Description helps Environment Builder to find or create a runtime environment for the requirements in the document, and to finish step (3) in figure 4.
There are several ways to describe bodies of remote sensing data analysis models. According to the difference of implementation methods of remote sensing data analysis models, they can be deployed in different ways. The simplest one is homogeneous platform based on-demand processing. In this solution, analysis models are submitted as an executable program with native codes to homogeneous computing nodes. In step (4), the deployment accomplishes successfully by simply copying the executable program files into the homogeneous environments. It is simple to be implemented, but not compatible enough for different requirements of different remote sensing data analysis models.
Another possible solution is based on the virtual machine (VM) technology. In this solution, remote sensing data analysis models are pre-bound with runtime environment needed in a VM image, and deployed as a VM instance for execution in step (4). Because a VM image can pack everything needed for the execution of an analysis model, it can be deployed everywhere. The major downside of this solution is the extra time cost caused by uploading VM image with large volume of data. New container technologies with better performance, such as Docker and Openvz, are also available for this solution.
Furthermore, script language is also possible for the description of remote sensing data analysis models. There are many alternative script languages, e.g., JavaScript, Python, function languages such as R language, shell scripts such as bash, and embedded script languages such as IDL in ENVI. Script languages are very flexible; they supply rich and powerful capabilities for analysis models, and is simple for deployment in step (4). However, the low execution performance, bad extensibility, and difficulty of parallelization are obvious shortcomings of script language based model description.
environment first. Then, in step (4), Model Deployer copies the source codes of analysis model into the runtime environment, and compiles the source codes for their further execution. Although it is complex and difficult to describe all details about required toolkits and libraries correctly, analysis models described by source codes are much flexible and high-performance because they executes on hardware platform directly and can be well optimized by compilers.
To evaluate the performance of on-demand processing framework, a prototype system is built for test. The prototype system has 2 Gigabits Ethernet connected computers, with one intel [email protected] CPU, 16GB memory and 4TB hard disk per server. One of them is used as on-demand processing server with Apache Tomcat, and the other one plays the role of client. In the prototype system, analysis models are described by java source codes, and some toolkits and libraries such as JDK and HDF library for Java [6] are ready for on-demand deployment in Windows 64-bits based runtime environment. As an example, a global drought detection analysis model process the MODIS Surface-Reflectance Product (MOD 09) for Normal Differential Water Index (shortly NDWI) brought up by Gao in 1996 [7]. NDWI is:
Figure 5. Algorithm for drought detection
NDWI is the difference between two bands in 8-day composite MODIS surface reflectivity data. The bands are green (ρ2, 0.86-μm) and near-infra-red (NIR, ρ5, 1.24-μm). It is an important index for remote sensing of vegetation liquid water from space, which is sensitive to changes in liquid water content of vegetation canopies. avgNDWI is the average value of NDWIs with the same tile in given time scope. As the result, AWI is short for Anomaly Water Index, which points out how drought the vegetation canopies are in a given time.
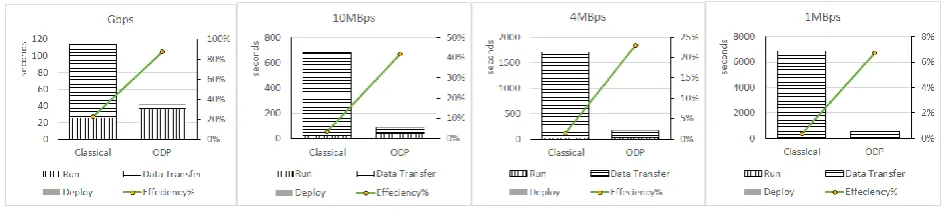
[image:5.595.61.534.519.625.2]The test data set of performance evaluation is MOD09 data on tiles h27v05 and h27v06 for 4 days each year in 11 years (2000-2010). The data amount of 88 MOD09 files is about 6.42GB, and the data amount of AWI result files is about 483MB. The analysis model executes twice with workflows shown in figure 1 (Classical) and figure 2 (On-Demand Processing, shortly ODP) for each bandwidth limitation at 1MB/s, 4MB/s, 10MB/s, and 1Gbps. Time costs for data transfer, on-demand model deployment and model execution are plotted in figure 6.
Figure 6. Performance test result.
Figure 6 shows that the time costs for data transfer are reduced obviously in all bandwidth limitations because only about 7.5% data transferred. Moreover, the efficiencies of model execution in on-demand processing framework are markedly improved for 3.85 ~ 19 times.
Summary
workflow continually. To make matters worse, scientists and engineers may not know whether the raw image data is available for further processing before data are downloaded successfully. The ineffective download wastes more time and makes the efficiency much lower.
The biggest challenge of on-demand processing is to deploy the analysis models into the runtime environment for further execution. There are several ways to describe bodies of remote sensing data analysis models, such as executable program files, embedded or standalone scripts, and source codes, and they are deployed differently. For example, homogeneous platform based model deployer copies executable program files into homogeneous runtime environments, virtual machine based model deployer executes analysis model pre-bounded with its dependencies, and source code based model deployer compiles source codes of analysis model for execution in the runtime environment created by Runtime Environment Builder.
At last, to evaluate the performance of on-demand processing framework, a prototype system is built for test. The result shows that on-demand processing framework can obviously accelerate the execution of analysis models in by reducing data transfers.
Besides improving efficiency of the remote sensing data analysis workflow by moving the calculation on massive data “nearby” where the data store, on-demand processing also enables the sharing of remote sensing data analysis models. It turns classical remote sensing data service systems into remote sensing data processing infrastructures or remote sensing data clouds, which provide IaaS (Infrastructure-as-a-Service) and PaaS (Platform-as-a-Service) services for developing much more remote sensing data analysis applications. With continuously growing data, tools and libraries in the remote sensing data infrastructures, users can develop more analysis models to process remote sensing data stored according to their requirements, create new applications based on these models, and exchange their knowledge each other by sharing models.
Acknowledgement
In this paper, the research was sponsored in part by National Key Research and Development Program of China from MOST (2016YFB0501504).
References
[1] Brennan, J. 2006. “NASA’s EOSDIS Data Centers Offer Something for Everyone.” In Earth Imaging Journal, September/October 2006, Vol. 3, No. 5, pp. 30-35.
[2] Hey, T., Tansley, S., Tolle, K. (Eds.), 2009. The Fourth Paradigm: Data-intensive Scientific Discovery, p. 252. Microsoft Corporation edition.
[3] Huang, Z. C., He, C., Gu, L., & Wu, J. F. (2005, July). On-demand service in grid: Architecture, design and implementation. In 11th International Conference on Parallel and Distributed Systems (ICPADS'05) (Vol. 2, pp. 674-678). IEEE.
[4] Baumann, P. (2010). The OGC web coverage processing service (WCPS) standard. Geoinformatica, 14(4), 447-479.
[5] Davis, B. N., Werpy, J., Friesz, A., et. al. (2015). Interactive Access to LP DAAC Satellite Data Archives Through a Combination of Open-Source and Custom Middleware Web Services. IEEE Geoscience and Remote Sensing Magazine, 3(4), 8-20.
[6] McGrath, Robert E., Xinjian Lu, and Michael Folk., Java (TM) applications using NCSA HDF files. Concurrency Practice and Experience 9.11 (1997): 1113-1125.