Munich Personal RePEc Archive
Intergenerational mobility in educational
occupational attainment: a comparative
study of social classes in India
Majumder, Rajarshi
Department of Economics, University of Burdwan
1 September 2010
Online at
https://mpra.ub.uni-muenchen.de/40939/
[The final, definitive version of this paper has been published in MARGIN, Vol. 4, Issue 4, November, 2010 by SAGE Publications India Private Limited, All rights reserved. © SAGE Publications India Private Limited, 2010.
It is available at: http://mar.sagepub.com/content/4/4/463.short]
INTERGENERATIONAL MOBILITY IN EDUCATIONAL & OCCUPATIONAL
ATTAINMENT: A COMPARATIVE STUDY OF SOCIAL CLASSES IN INDIA
Rajarshi Majumder••••
1 INTRODUCTION
It is often found that Intergenerational Mobility in terms of both Education and Occupation is lower in developing countries in general, and among specific ethnic groups within those
countries in particular. It starts from the fact that specific ethnic groups (in developing and developed countries) are excluded from the process of capability formation and income-earning opportunities due to various forms of discrimination. This exclusion and backwardness transcends the boundary of the current generation and spills over to successive generations as well. The World Bank (2000) has accepted the overlapping generation impact
of social exclusion by commenting:
“Discrimination on the basis of gender, ethnicity, race, religion, or social status can lead to
social exclusion and lock people into long-term poverty traps.”
Such processes of exclusion can be linked to deprivation or impoverishment in a multi-dimensional, multigenerational, and interactional fashion, rather than in a linear way. On one
hand, ‘the poor’ are likely to be excluded from wider participation in society because of their relative material disadvantage in terms of income. On the other, exclusion from the avenues of capability formation due to poor income also renders them poorly endowed in terms of human capital and hence reduces the income of their next generation. Under such circumstances it becomes imperative to understand the absence of intergenerational
educational and occupational mobility among socially excluded classes in developing countries in comparison to certain advanced groups. India serves as an excellent case study because of the presence of diverse social groups and historical disparities between them.
•
2 REVIEW OF CURRENT RESEARCH
a) Methodological Approaches
Studies on Intergenarational transmission of educational and occupational characteristics have mostly followed two methodological approaches. The first type cross tabulates the individual characteristics with those of their parents and computes a Mobility Matrix, based on which proportion of people exhibiting Upward Mobility (children having higher educational/occupational position compared to their parents) are calculated. Starting with
Driver (1962), this method has been used by Erikson and Goldthorpe (1992, 2002), Cheng (1995), Biblarz (1996), Kumar (2002), Behrman et al (2001), Beller and Hout (2006), and Louw et al (2006). This is basically a descriptive approach without analysing the impact of other variables on such transmission. When computed separately across social groups, it
provides measures of upward mobility for each of them, which can then be compared. However, this method is unable to bring out the causal relation between parental educational
and occupational status and that of the children objectively when several other possible explanatory factors are present. This gives rise to the second method which is more rigorous in nature and typically regress child’s educational / occupational characteristics on those of the parents along with a set of other control variables. The coefficients of parental
characteristics will give us a measure of intergenerational inertia in our dependent variable. A high coefficient will denote low mobility while a low coefficient will represent high mobility. Apart from OLS Regression, Logistic Regression and Correlation has also been used to objectively measure parental influence on children’s achievement level using this method. Researchers using this methodology include Behrman and Wolfe (1984), Solon (1992),
Peters (1992), Gang and Zimmermann (1999), Bowles and Gintis (2002), Bourguignon (2003), Black et al (2003), Checchi et al (2008), and Brown et al (2009). While the Mobility
Matrix method has been used mostly for case studies when achievement levels are discrete categories in hierarchically ordered classes (e.g. occupational category), the Regression/Correlation method has been used when a large dataset has been available and achievement levels are measured in continuous scale (e.g. income or completed years of
schooling). Though the regression/correlation approach has been in favour in recent times, it is sometimes criticised on the ground that the association between parental and children’s
separately for different social groups from the mobility matrix and comparing them; then
attempting an econometric exercise where individual educational/occupational attainments have been expressed as function of parental achievements; to bring out the dynamics of intergenerational mobility.
b) Empirical Experience – International
Internationally, in economics, there is an extensive literature on the transmission of economic success from generation to generation. That the family plays a crucial role in shaping income inequality has long been recognised by economists [Knight, 1935; Parsons, 1975; Becker and Tomes, 1979, 1986; Loury, 1981]. Hertz et al (2007) estimated trends in intergenerational persistence of educational attainment for a sample of 42 nations around the globe over fifty
year period and obtained large regional differences, with Latin America displaying the highest intergenerational correlations, and the Nordic countries the lowest. Most of the recent studies, e.g. Cheng (1995) for China, Behrman et al (2000) for Latin America, Bowles and Gintis (2002) for the US, Bourguignon et al (2003) for Brazil, Checchi et al (2008) for Italy, conclude that there is both a significant direct and indirect effect of parental education/occupation/income on young people’s educational attainment level, occupational
destinations and well being [see Mazumder (2001) for a brief review]. On the other hand, low parental influence has been reported by Peters (1992) for the US, Gang and Zimmermann (1999) for immigrant Germans, Black et al (2003) for Norway, Louw et al (2006) for South Africa, and Brown et al (2009) for Great Britain.
c) Empirical Experience – Indian Context
One of the earliest works in Indian context has been that of Driver (1962). Using data on the male heads of households in Nagpur district, he concluded that intergenerational mobility is frequent among rural and urban castes but is generally confined to occupations of similar
rank. This association was attributed by the author to differences among castes in educational attainment. Surprisingly, caste being such an important issue in India in determining various
socio-economic and political dimensions, there has been only few studies to compare intergenerational mobility of various castes in India in recent times. Kumar et al (2002, 2002a) discussed the role of caste and community in class mobility and the impact of modernisation on such processes using National Election Study data of 1971 and 1996 from
the stagnation is attributable to financial and other resource-related factors and not caste
alone.
More recently Jalan and Murgai (2007) look at inequalities in educational outcomes across groups of individuals and the perpetuation of these inequalities across generations using NFHS data for 1992-93 and 1998-99 and conclude that educational mobility in India is up to international standards and has further has increased over time. Also, the differences in mobility are more along Rich-Poor divide rather than along caste lines. Deshpande and
Palshikar (2008) uses survey data from Pune city to look at intergenerational occupational mobility across different castes and observes substantial upward mobility in the aggregate. Using both mobility matrix and regression techniques, they also infer that while caste does matter for upward mobility, in general occupational mobility across generations is not shaped by caste factors.
It is thus evident that though a plethora of work has been done at the international level, especially in the developed countries context, the area has remained under-focussed in Indian economic research. This is quite unexpected since social exclusion and disparity have been quite substantial in India and none have had as long-lasting an effect as the division along caste lines. The Scheduled Castes (SCs), Scheduled Tribes (STs), and Other Backward Classes (OBCs) have been a pariah in the development process of India for quite a long time.
Affirmative actions in the form of Reservation in Education and Employment were taken after independence to provide them space in the mainstream and trigger self-sustaining growth of these groups. In recent years the issue has again come to centre-stage in view of the debate between pro- and anti-reservation lobbies. Whether such actions have been able to create greater mobility among the Excluded Castes (EC hereafter, comprising of SC, ST and
OBCs taken together) and bring in higher social fluidity in the nation as a whole, remains an important area to be explored.
The present study will try to fill in this void in existing literature by bringing out not only the educational attainment level and occupational structure among various castes in India, but
also the degree of educational and occupational mobility for them, disaggregated across gender wherever possible. The study is thus significant from the viewpoint of both assessing the current dispensation and understanding the temporal dynamics.
With this backdrop, the author tries to:
a) Determine levels of Educational Attainments & Occupational Structure separately
b) Determine Mobility across generations in terms of Educational Attainments &
Occupational Structure separately for these two classes;
c) Explore whether the Mobilities are different for the different groups, separately
for two gender groups wherever possible;
3 DATASOURCES AND METHODOLOGY
The methodology to be followed in the study can be outlined as follows. The study has used the NSSO database on employment and unemployment (Unit level records) for the 50th and the 61st Rounds, pertaining to the years 1993 and 2004. While the 1993 survey covered 115,409 households enumerating 564,740 persons, spread over 6983 villages and 4670 urban blocks, the 2004 survey was spread over 7,999 villages and 4,602 urban blocks covering 124,680 households and 602,833 persons.
The NSSO data provides a volume of information for each individual in the sample, of which
those of our interest are individual’s age, gender, educational levels, work status, occupational group if working, wages received, etc. along with household characteristics like social group (Caste), religion, location of residence, monthly per capita expenditure. Educational levels are provided as broad groups while Occupational groups follow National Occupational Classification (1968).1 For all individuals it also provides information on Relation with Head of Household. Based on this information we can identify three different
sets of Parents-Children from the dataset – Head of Household/their Spouse and their Children; Head of Household/their Brothers/Sisters and their Parents; Sons/Daughters of Head of Household/their Spouses and Grandchildren of Head of Household. Using household serial number and person serial number available in the dataset, comprehensive records with characteristics of two generations were prepared and family/household particulars were
superimposed on them.2 Thus our data provides us necessary information on education and occupation for two generations along with household characteristics and can be summarised separately for different castes, age groups, gender, and location. The first generation is called ‘Parents’ and are divided into Fathers and Mothers while the second generation is called
‘Children’ and are subdivided into Sons and Daughters. Only persons aged 20 or above have been included in our study to allow them to complete the full educational cycle. Moreover,
should be representative of the recent trends in the society. Since NSSO database also
provides multipliers to convert sample characteristics into population characteristics, we report population estimates in our study.
A note on the limitations of the database seems necessary at this point. Imposition of the age-restriction truncates the data and we are left with 264800 persons for 1993 and 222683 persons for 2004. Of these, numbers of individuals with information available on both parents are 57809 for 1993 and 73463 for 2004, while those with information available for any one
parent are 84651 and 108794 respectively. The sample therefore is much less than the actual NSSO coverage and such truncation may not be non-random.
Secondly, since the NSSO sample uses the household as sampling frame, and as we are using household level information to generate our dataset, we are including only those households with at least two generations living in the same household. This excludes a large number of
women who have been married and have left their parents’ household. The results for Girls therefore have to be taken with a bit of caution, though even after such elimination we are left with 19884 women in 1993 and 15229 women in 2004. However, since our main objective is to bring out the differences between different Castes, assuming that sample elimination is similarly distributed across castes, we can continue our analysis without much of a problem. Thirdly, NSSO data for 1993 distinguishes between STs, SCs, and Others (whom we call
General Caste or GEN) while the 2004 data provide information for OBCs separately from the GENs. Thus, there are some comparability problems in the data, which however is not insurmountable.
With this background, we now explore the situation.
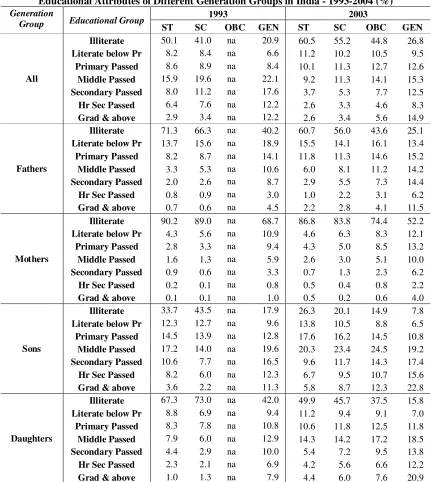
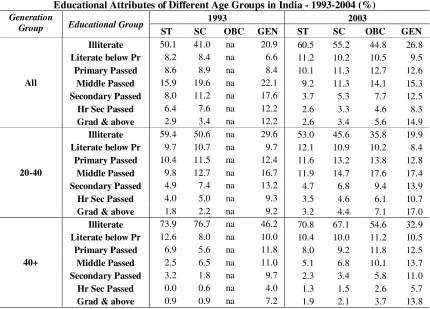
4 EDUCATIONAL ATTAINMENT
Educational attainment levels of the people are substantially lower by international standards. Even in 2004, more than 30 per cent of them are Illiterate, and only about 20 per cent have completed secondary schooling. Within such low standards, the situations of the Excluded Castes are still worse. 45 percent of OBCs, 60 per cent of STs, and 55 per cent of SCs are
illiterate, compared to only 27 per cent for the Advanced Castes (Table 1). Secondary schools have been completed by only about 8-11 per cent of the excluded class workers.
There is however disparities among different generations and age groups regarding
educational levels. Children and young people are having better educational levels than their parents and older age group persons. Also, standards have improved over the 1993-2004 period. Alarmingly, gender discrimination is pretty strong and illiteracy among Daughters is more than double compared to that among Sons. The upward mobility witnessed is more prominent among the advanced castes and marginal among the excluded castes, especially for the women. Whether this is because of intergenerational stickiness will be examined later.
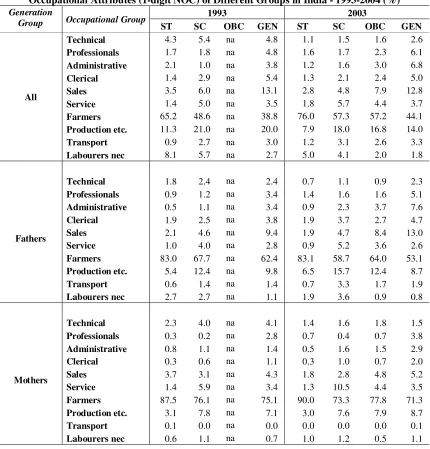
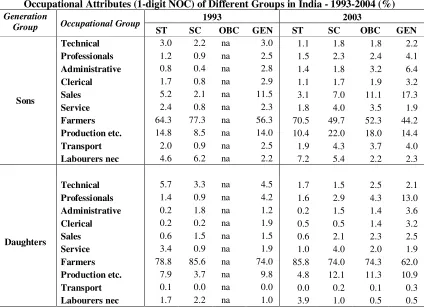
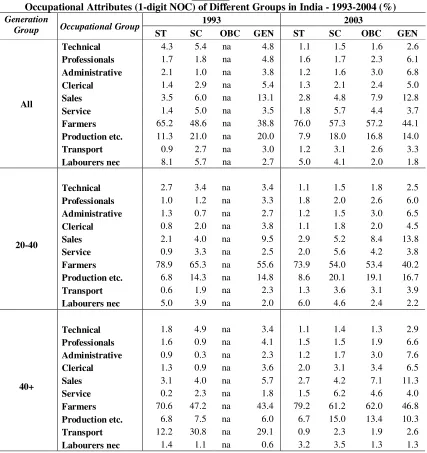
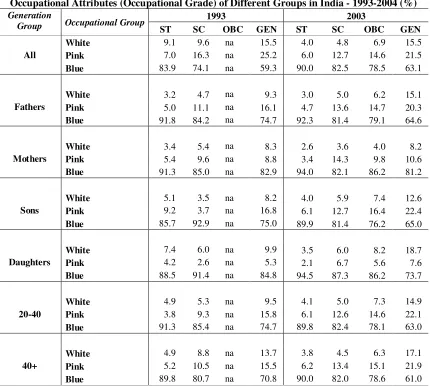
5 OCCUPATIONAL HIERARCHY
One of the major factors affecting income distribution is the hierarchical structure of different occupations and the occupational distribution of the workers. Occupational segregation leads to perpetuation and also accentuation of income inequality over generations. Therefore, examining the occupational distribution of workers becomes an important issue.
We have used the Indian NCO-1968 classification in our study and workers have been divided into 10 occupational classes. Arranged in descending order of hierarchy and prestige, these are – Technical & Scientific Personnel, Professionals, Administrative, Clerical, Sales, Service, Farmers, Production related, Transport, and Labourers not elsewhere classified. Occupational structure and mobility is discussed in terms of this structure. We have at the second level clubbed similar occupations to form 3 broad groups – Grade-I (White Collar
jobs - Technical & Scientific Personnel, Professionals, and Administrative); Grade-II (Pink Collar Jobs - Clerical, Sales, and Service); and Grade-III (Blue Collar jobs - Farmers, Production related, Transport, and Labourers not elsewhere classified). This hierarchical structure has also been used in our study.
It is observed that the workers of the Excluded Castes are much more concentrated in the
Grade-III jobs compared to the Advanced Castes, while the proportion of the latter in Grade-I jobs is unduly large (Table 2 & 3). Some improvements are observed over time and across generations whereby proportion of excluded caste workers in higher occupation classes are increasing. However, the rate of improvement is much more pronounced for the advanced
castes. Moreover, share of workers in the Grade-III jobs have increased for the Parents and the Daughters belonging to Scheduled Tribes. Thus occupational segregation and
occupational stickiness among excluded castes is very much a reality in India.
occupations. For the STs, there is a clear downward movement with proportion of Blue
Collar workers increasing.
6 INTERGENERATIONAL MOBILITY
We are more interested in examining how children’s education and occupation are related to parental standards. More specifically we want to quantify the degree of intergenerational upward mobility in education and occupation. In the literature this has been done using the Mobility Matrix or cross-tabulation of children’s parameters with parental parameters.
Thereafter, the percentage of children moving to a higher educational or occupational class compared to their parents will provide us a measure of intergenerational mobility. The following results are obtained.
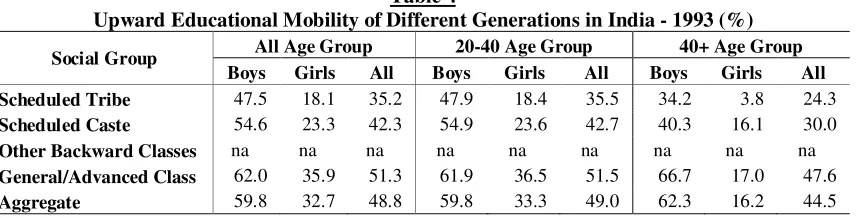
a) Educational Mobility
It is observed that a substantial upward mobility is present in terms of educational attainment levels. About 48 per cent of children in 1993 and about 56 per cent of children in 2004 have higher educational levels compared to their parents (Tables 4 & 5). Mobility is higher for the younger age group compared to the older, and for boys compared to girls. Mobility has also improved during 1993-2003, especially for the girls. However, social disparity in mobility
levels is quite evident. Upward mobility was quite lower for the excluded castes compared to the advanced castes in 1993. The gap has decreased in 2004, especially for the boys, but is still significant. It is also observed that for new male entrants, probability of reaching a higher educational standard than their parents is almost equal for the advanced and excluded castes. This is a welcome trend, though the gender bias is still a major issue.
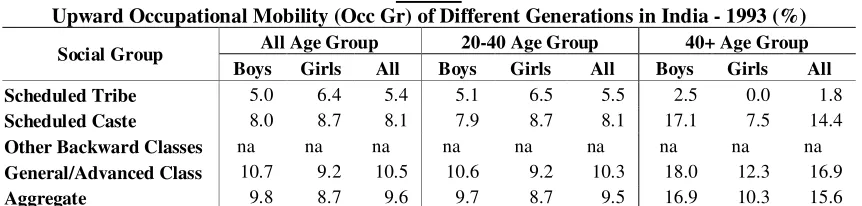
b) Occupational Mobility
Compared to Educational mobility, occupational attainment is much more sticky across generations with upward mobility being only about 15-19 per cent in 2004 (Table 7). Mobility has improved during 1993-2004 for all the sub-groups. At detailed occupational level, only about one-fifth of the boys and one-seventh of the girls are moving to higher level of jobs compared to their parents. For the advanced castes however, mobility among girls is
higher compared to boys, indicating wider acceptability of women employment in diversified occupational positions and also higher aspirations among present generation women of the advanced castes. However, much of this mobility is perceived to be at comparable hierarchical level and grade level stickiness is observed to be much higher when viewed at
Mobility among excluded castes is lower than that for advanced castes indicating greater
intergenerational stickiness for the former. This gap is higher at broad occupational levels compared to detailed occupational levels. Thus, it emerges that for the advanced castes, the mobility from Blue Collar to Pink Collar and from Pink Collar to White Collar jobs is substantial while for the excluded castes much of the mobility is lateral, i.e. from one occupation to other within the broad grades.
Quite surprisingly, mobility is higher among older age group people compared to the young.
This may be due to various reasons. First, this may be a reflection of lower initial or parental occupational levels of the current 40+ people compared to the current 20-40 age group people whose parents have already higher occupational levels. Hence upward mobility may be higher for the former compared to the latter. Second, this may also be because of tighter labour market situations in post-1990 era whereby chances of vertical mobility have become
much more sparse and most of the movements are horizontal among similar occupations.
7 INERTIA ACROSS GENERATIONS
In the previous section we have reported the proportion of current generation individuals achieving higher educational and occupational level compared to their parents, separately for different castes and gender in India. Such upward movement is observed to be lower for the excluded castes compared to the advanced castes. But is such stickiness really due to the
caste factor or are other factors responsible? To answer this, we have applied a Multivariate Regression Method where the Children’s characteristics have been regressed on Parental characteristics along with other explanatory variables specified as:
Ci = α + βFi + γMi + θ(Social Group Dummies) + ϕ (Poverty Status) + λ(Cohort Effects) +
error term --- (1) Ci is ith Child’s characteristic related to education / occupation;
Fi is ith child’s Father’s characteristic related to education / occupation;
Mi is ith child’s Mother’s characteristic related to education / occupation;
The coefficients β and γ relate the education/occupation level of children to that of their
parents. A higher value for these coefficients implies stronger parental effects on the children,
higher intergenerational stickiness, and therefore less mobility. θ denotes base level difference between social groups regarding educational/occupational achievements. Effect of
household income is captured by Poverty Status, which is a Dummy Variable taking value 1 if the MPCE of the household is less than the Poverty Line, and thus ϕ signifies how being
cohorts regarding educational/occupational achievements. To examine differences between
different castes or gender regarding parental influence two approaches can be taken. First, Equation (1) can be collapsed to:
Ci = α + βFi + γMi + ϕ (Poverty Status) +error term --- (2)
and estimated separately for different location/caste/gender/cohort groups and the values of
β and γ can be compared across those groups. Higher β and γ for Excluded Castes and
Females would indicate greater inertia and lower mobility for them. Second, Equation (1) can be expanded to:
Ci = α + βFi + γMi + ϕ (Poverty Status) + θ (Social Group Dummies) + θ′ (Interaction
Dummies of Social Groups with Parental characteristics) + error term --- (3)
whereby estimates of θ′ would provide us measures of differential parental impact for
different castes. Equation (3) may again be estimated separately for location, gender and cohort groups. A positive θ′ will indicate higher parental impact for Excluded Castes.
In addition to this regression technique, one can also use Partial Correlation method to measure the association between parental and child’s characteristic after controlling for
variables like Poverty status etc. A higher correlation coefficient would imply substantial intergenerational inertia.
We have used both the regression methods as well as the correlation method to examine the issue of intergenerational transmission of educational and occupational characteristics in India. However, this exercise has been done only for the most recent available dataset, i.e. for
the 2004 period.
a) Parental Impact on Education
To explore inertia in educational achievements, we have used Completed Years of Education as the characteristic variable. Since education of both parents and children are measured in numbers of years of schooling, the coefficients would measure how much difference in the
schooling of children is caused by a difference of one year in the father’s/mother’s schooling. Results indicate that for the Rural areas Parental educational levels have significant impact on the children’s educational level (Table 10a). Notably, for the Daughters, impact of maternal education is stronger than that of the father. Also, this maternal impact is stronger for daughters compared to that for sons. This indicates the importance of women’s education in
sending the girl child to school.
impacts are lower for the younger cohorts indicating decline in intergenerational inertia in
educational achievements over time.
Our main interest however is to examine whether parental impacts are systematically higher for Excluded Castes compared to others. This would be revealed by the difference among
castes regarding the values of coefficients β and γ in Equation (2) or by the value of the
coefficients of the slope dummies (θ′ ) of Equation (3). It is observed that the Father’s
education have significantly greater impact for all the three Excluded Castes compared to the upper castes – supporting our hypothesis that intergenerational mobility is lower for these
groups (Table10a). Impact of maternal education is also greater for these groups, though the coefficients are significant only at 20 per cent level. The results hold for both the functional forms used.
For the Urban areas, the broad trends of the results are similar, though now fewer coefficients
are significant (Table 10b). Another observation is that for the urban population cohort effects are much less pronounced.
As noted earlier, the coefficients of parental educational levels in Equation (2) and (3) are measures of intergenerational stickiness and therefore their inverse can be taken as a measure of intergenerational mobility. These Mobility Indices are reported in Table 11 for both the equations. It is observed that mobility is substantially lower for the Excluded Castes
compared to the upper castes, and also for the Daughters compared to the Sons. Thus, even after allowing for differences in income level (proxied by MPCE) mobility is lower for the excluded groups and if we consider the fact that poverty itself is much higher among the Excluded Castes, they are thus doubly disadvantaged.
b) Occupational Group and Parental Influence
Analysing Occupational Mobility in a Multivariate framework is much more complex since we can only have some ordinal ranking of the occupation groups, as mentioned earlier. In absence of any cardinal values associated with each occupation, we can advance in either of the following ways. First, and theoretically the best approach would have been to use Multinomial-Multivariate Logit models to regress occupational group of the individual as
of occupations and it would not be theoretically justified to use them in a regression analysis.
Hence we take the much rudimentary third option where after ranking the occupations we derive Rank Correlation coefficient between an individual’s occupation status and that of their parents, after controlling for effects of poverty status and cohorts. In addition, it is expected that an individual’s occupation would depend on her/his educational level. Since parental influence on education has already been established, we want to remove the effect of education from intergenerational occupational inertia. Hence education of the individual has
also been included as a control variable while calculating the partial correlation coefficients. These Partial Correlation Coefficients between Children’s and Parent’s occupational ranks were calculated separately for the different castes and gender. A high and positive association would indicate substantial influence of parental occupation on that of the children while a lower coefficient would indicate higher mobility. These coefficients and derived Mobility
Indices are reported in Tables 12 and 13.
It is observed that as with education, child’s occupational status is significantly influenced by parent’s occupation, both at 1-digit NOC and out Broad occupational grade level. As expected, the association is on an average stronger for the Excluded Castes compared to the Advanced Castes, and for broad occupational grades compared to 1-digit NOC, confirming our earlier finding that much of the intergenerational mobility is lateral and not vertical
[Driver (1962) also obtained similar results].
Two notable differences from educational mobility are that here associations are stringer for the urban population compared to rural population, and that both father’s and mother’s occupation have greater influence on son’s occupational status an not on the daughter’s, except for the upper caste girls. Consequently Mobility Indices are also higher for the
Advanced Castes compared to the Excluded Castes.
8 CONCLUSION
It is thus evident that upward mobility across generations in India is moderate for educational level and significantly low for occupational level. Within that, the condition of the excluded
classes is further lower. Though educational levels of the second generation is higher that their parents in 2004, this is not adequately reflected in occupational mobility matrix. People
mark against the tradition of reservation in educational institutions. Reason of such stickiness
is an area that merits further discussion and exploration. _____________________________________________
[This is part of a broader study on Intergenerational Mobility of Excluded Classes in India, sponsored by University Grants Commission, India. The author is grateful to an anonymous referee for comments on an earlier draft. The author also acknowledges academic inputs from Dipa Mukherjee and Jhilam Ray.]
Notes
1
From the NSSO data, individuals can be grouped into any of the following Educational categories – Illiterate, Literate but below Primary level education, Primary School (Class 5) Passed, Middle School (Class 8) Passed, Secondary School (Class 10) Passed, Higher Secondary (Class 12) Passed, Graduate & above. The Occupational categories used in NSSO and our study relates to the Indian NCO-1968 classification where workers have been divided into 10 occupational classes. Arranged in descending order of hierarchy and prestige, these are – Technical & Scientific Personnel, Professionals, Administrative, Clerical, Sales, Service, Farmers, Production related, Transport, and Labourers not elsewhere classified.
2
This required use of modern econometric and database software like SPSS (student version) and Visual Foxpro Version-9. Latter econometric exercises also took help of these programmes as also Microsoft Office suite. SPSS syntax may be available from the author on request.
References
Becker, G.S. and N. Tomes (1979), “An Equilibrium Theory of the Distribution of Income and
Intergenerational Mobility.” Journal of Political Economy, 87(6), 1153-1189.
Becker, G.S. and N. Tomes (1986), “Human Capital and the Rise and Fall of Families.” Journal of
Labor Economics, 4, S1-S39.
Behrman, J.R. and B.L. Wolfe (1984), “The Socioeconomic Impact of Schooling in a Developing
Country”, The Review of Economics and Statistics, Vol. 66, No. 2.
Behrman J.R., Alejandro Gaviria and Miguel Székely (2001) – “Intergenerational Mobility in Latin
America”, Working Paper Number 352, Inter-American Development Bank,
Research Department, Downloaded from
www.iadb.org/res/publications/pubfiles/pubWP-452.pdf on 26-10-2009.
Beller, Emily and Michael Hout (2006) – “Intergenerational Social Mobility: The United States in
Comparative Perspective”, The Future of Children, Vol. 16 / No. 2 / Fall 2006.
Biblarz, Timothy J., Vern L. Bengtson, and Alexander Bucur (1996) – “Social Mobility Across Three
Generations”, Journal of Marriage and the Family, Vol. 58, No. 1 (Feb., 1996), pp.
188-200.
Bjorklund, A. and M. Jantti (2000), “Intergenerational Mobility of Socio-economic Status in
Comparative Perspective.” Nordic Journal of Political Economy, 26(1), 3-33.
Black, Sandra E., Devereux, Paul J., and Salvanes, Kjell G., (2003), “Why the Apple Doesn’t Fall
Far: Understanding Intergenerational Transmission of Human Capital,” IZA
Bourguignon, François, F.H.G. Ferreira and Marta Menéndez (2003) – “Inequality of Outcomes and
Inequality of Opportunities in Brazil”, William Davidson Institute Working Paper
Number 630, November 2003, Downloaded from www.wdi.bus.umich.edu on
30-10-2009.
Bowles, Samuel and Herbert Gintis (2002) – “The Inheritance of Inequality”, The Journal of
Economic Perspectives, Vol. 16, No. 3 (Summer, 2002), pp. 3-30.
Brown, Sarah, Steven McIntosh and Karl Taylor (2009) – “Following in Your Parents’ Footsteps?
Empirical Analysis of Matched Parent-Offspring Test Scores”, IZA Discussion Paper
No. 3986, January 2009.
Checchi, D. (1997), “Education and intergenerational mobility in occupations”, American Journal of
Economics and Sociology, 56/3: 331-352
Checchi, D., C.V. Fiorio, and M. Leonardi (2008) – “Intergenerational Persistence in Educational
Attainment in Italy”, IZA Discussion Paper No. 3622, July 2008.
Cheng, Yuan and Jianzhong Dai (1995) – “Intergenerational Mobility in Modern China”, European
Sociological Review, Vol. 11, No. 1 (May, 1995), pp. 17-35.
Deshpande, R. and S. Palshikar (2008) – “Patterns of Occupational Mobility: How Much Does Caste
matter?”, Economic and Political Weekly, Vol. 43, No. 34, 23-29 August 2008, pp
61-70.
Driver, Edwin D. (1962) – “Caste and Occupational Structure in Central India”, Social Forces, Vol.
41, No. 1 (Oct., 1962), pp. 26-31
Erikson, R. and J.H. Goldthorpe (1992), The Constant Flux: A Study of Class Mobility in Industrial
Societies, Oxford: Clarendon Press.
Erikson, R. and J.H. Goldthorpe (2002), “Intergenerational Inequality: A Sociological Perspective”,
The Journal of Economic Perspectives, Vol. 16, No. 3 (Summer, 2002), pp. 31-44.
Gang, Ira N. & Zimmermann, Klaus F., (1999), “Is Child like Parent? Educational Attainment and
Ethnic Origin”, IZA Discussion Papers No. 57, 1999
Hertz, Tom, Tamara Jayasundera, Patrizio Piraino, Sibel Selcuk, Nicole Smith, and Alina
Verashchagina (2007), “The Inheritance of Educational Inequality: International
Comparisons and Fifty-Year Trends,” The B.E. Journal of Economic Analysis &
Policy, Vol. 7: Issue 2 (Advances), Article 10, Downloaded from
http://www.bepress.com/bejeap/vol7/iss2/art10 on 15-12-2008.
Jalan, J. and R. Murgai (2007) – “Intergenerational Mobility in Education in India”, Processed, World
Bank, Delhi.
Knight, F.H. (1935), “Professor Hayek and the Theory of Investment”, The Economic Journal, Vol.
45, No. 177, March.
Kumar, S., A. Heath, and O. Heath (2002), “Determinants of Social Mobility in India”, Economic and
Kumar, S., A. Heath, and O. Heath (2002a), “Changing Patterns of Social Mobility: Some Trends
over Time”, Economic and Political Weekly, Vol. 37, No. 40
Loury, G.C. (1981), “Intergenerational Transfers and the Distribution of Earnings.” Econometrica,
49(4), 843-867.
Louw, Megan, Servaas van Der Berg and Derek Yu (2006) – “Educational Attainment and
Intergenerational Social Mobility in South Africa”, Stellenbosch Economic Working
Papers Number 09/06, Downloaded from
www.ekon.sun.ac.za/wpapers/2006/wp092006/wp-09-2006.pdf on 26-10-2009
Mazumder, B. (2001), “Earnings Mobility in the US: A New Look at Intergenerational Inequality.”
Center for Labor Research, University of California, Berkeley, Working Paper No.
34, March.
Parsons, D.O. (1975), “Intergenerational Wealth Transfers and the Educational Decisions of Male
Youth.” Quarterly Journal of Economics, 89, 603-617.
Peters, H. Elizabeth (1992) – “Patterns of Intergenerational Mobility in Income and Earnings”,
Review of Economics and Statistics, Vol. 74, No. 3 (Aug., 1992), pp. 456-466.
Solon, G.R. (1992), “Intergenerational Income Mobility in the United States.” American Economic
Review, 82(3), 393-408.
Table 1a
Educational Attributes of Different Generation Groups in India - 1993-2004 (%)
Generation
Group Educational Group
1993 2003
ST SC OBC GEN ST SC OBC GEN
All
Illiterate 50.1 41.0 na 20.9 60.5 55.2 44.8 26.8
Literate below Pr 8.2 8.4 na 6.6 11.2 10.2 10.5 9.5
Primary Passed 8.6 8.9 na 8.4 10.1 11.3 12.7 12.6
Middle Passed 15.9 19.6 na 22.1 9.2 11.3 14.1 15.3
Secondary Passed 8.0 11.2 na 17.6 3.7 5.3 7.7 12.5
Hr Sec Passed 6.4 7.6 na 12.2 2.6 3.3 4.6 8.3
Grad & above 2.9 3.4 na 12.2 2.6 3.4 5.6 14.9
Fathers
Illiterate 71.3 66.3 na 40.2 60.7 56.0 43.6 25.1
Literate below Pr 13.7 15.6 na 18.9 15.5 14.1 16.1 13.4
Primary Passed 8.2 8.7 na 14.1 11.8 11.3 14.6 15.2
Middle Passed 3.3 5.3 na 10.6 6.0 8.1 11.2 14.2
Secondary Passed 2.0 2.6 na 8.7 2.9 5.5 7.3 14.4
Hr Sec Passed 0.8 0.9 na 3.0 1.0 2.2 3.1 6.2
Grad & above 0.7 0.6 na 4.5 2.2 2.8 4.1 11.5
Mothers
Illiterate 90.2 89.0 na 68.7 86.8 83.8 74.4 52.2
Literate below Pr 4.3 5.6 na 10.9 4.6 6.3 8.3 12.1
Primary Passed 2.8 3.3 na 9.4 4.3 5.0 8.5 13.2
Middle Passed 1.6 1.3 na 5.9 2.6 3.0 5.1 10.0
Secondary Passed 0.9 0.6 na 3.3 0.7 1.3 2.3 6.2
Hr Sec Passed 0.2 0.1 na 0.8 0.5 0.4 0.8 2.2
Grad & above 0.1 0.1 na 1.0 0.5 0.2 0.6 4.0
Sons
Illiterate 33.7 43.5 na 17.9 26.3 20.1 14.9 7.8
Literate below Pr 12.3 12.7 na 9.6 13.8 10.5 8.8 6.5
Primary Passed 14.5 13.9 na 12.8 17.6 16.2 14.5 10.8
Middle Passed 17.2 14.0 na 19.6 20.3 23.4 24.5 19.2
Secondary Passed 10.6 7.7 na 16.5 9.6 11.7 14.3 17.4
Hr Sec Passed 8.2 6.0 na 12.3 6.7 9.5 10.7 15.6
Grad & above 3.6 2.2 na 11.3 5.8 8.7 12.3 22.8
Daughters
Illiterate 67.3 73.0 na 42.0 49.9 45.7 37.5 15.8
Literate below Pr 8.8 6.9 na 9.4 11.2 9.4 9.1 7.0
Primary Passed 8.3 7.8 na 10.8 10.6 11.8 12.5 11.8
Middle Passed 7.9 6.0 na 12.9 14.3 14.2 17.2 18.5
Secondary Passed 4.4 2.9 na 10.0 5.4 7.2 9.5 13.8
Hr Sec Passed 2.3 2.1 na 6.9 4.2 5.6 6.6 12.2
Grad & above 1.0 1.3 na 7.9 4.4 6.0 7.6 20.9
Table 1b
Educational Attributes of Different Age Groups in India - 1993-2004 (%)
Generation
Group Educational Group
1993 2003
ST SC OBC GEN ST SC OBC GEN
All
Illiterate 50.1 41.0 na 20.9 60.5 55.2 44.8 26.8
Literate below Pr 8.2 8.4 na 6.6 11.2 10.2 10.5 9.5
Primary Passed 8.6 8.9 na 8.4 10.1 11.3 12.7 12.6
Middle Passed 15.9 19.6 na 22.1 9.2 11.3 14.1 15.3
Secondary Passed 8.0 11.2 na 17.6 3.7 5.3 7.7 12.5
Hr Sec Passed 6.4 7.6 na 12.2 2.6 3.3 4.6 8.3
Grad & above 2.9 3.4 na 12.2 2.6 3.4 5.6 14.9
20-40
Illiterate 59.4 50.6 na 29.6 53.0 45.6 35.8 19.9
Literate below Pr 9.7 10.7 na 9.7 12.1 10.9 10.2 8.4
Primary Passed 10.4 11.5 na 12.4 11.6 13.2 13.8 12.8
Middle Passed 9.8 12.7 na 16.7 11.9 14.7 17.6 17.4
Secondary Passed 4.9 7.4 na 13.2 4.7 6.8 9.4 13.9
Hr Sec Passed 4.0 5.0 na 9.3 3.5 4.6 6.1 10.7
Grad & above 1.8 2.2 na 9.2 3.2 4.4 7.1 17.0
40+
Illiterate 73.9 76.7 na 46.2 70.8 67.1 54.6 32.9
Literate below Pr 12.6 8.0 na 10.0 10.4 10.0 11.2 10.5
Primary Passed 6.9 5.6 na 11.8 8.0 9.2 11.8 12.5
Middle Passed 2.5 6.5 na 11.0 5.1 6.8 10.1 13.7
Secondary Passed 3.2 1.8 na 9.7 2.3 3.4 5.8 11.0
Hr Sec Passed 0.0 0.6 na 4.0 1.3 1.5 2.6 5.7
Grad & above 0.9 0.9 na 7.2 1.9 2.1 3.7 13.8
Table 2a
Occupational Attributes (1-digit NOC) of Different Groups in India - 1993-2004 (%)
Generation
Group Occupational Group
1993 2003
ST SC OBC GEN ST SC OBC GEN
All
Technical 4.3 5.4 na 4.8 1.1 1.5 1.6 2.6
Professionals 1.7 1.8 na 4.8 1.6 1.7 2.3 6.1
Administrative 2.1 1.0 na 3.8 1.2 1.6 3.0 6.8
Clerical 1.4 2.9 na 5.4 1.3 2.1 2.4 5.0
Sales 3.5 6.0 na 13.1 2.8 4.8 7.9 12.8
Service 1.4 5.0 na 3.5 1.8 5.7 4.4 3.7
Farmers 65.2 48.6 na 38.8 76.0 57.3 57.2 44.1
Production etc. 11.3 21.0 na 20.0 7.9 18.0 16.8 14.0
Transport 0.9 2.7 na 3.0 1.2 3.1 2.6 3.3
Labourers nec 8.1 5.7 na 2.7 5.0 4.1 2.0 1.8
Fathers
Technical 1.8 2.4 na 2.4 0.7 1.1 0.9 2.3
Professionals 0.9 1.2 na 3.4 1.4 1.6 1.6 5.1
Administrative 0.5 1.1 na 3.4 0.9 2.3 3.7 7.6
Clerical 1.9 2.5 na 3.8 1.9 3.7 2.7 4.7
Sales 2.1 4.6 na 9.4 1.9 4.7 8.4 13.0
Service 1.0 4.0 na 2.8 0.9 5.2 3.6 2.6
Farmers 83.0 67.7 na 62.4 83.1 58.7 64.0 53.1
Production etc. 5.4 12.4 na 9.8 6.5 15.7 12.4 8.7
Transport 0.6 1.4 na 1.4 0.7 3.3 1.7 1.9
Labourers nec 2.7 2.7 na 1.1 1.9 3.6 0.9 0.8
Mothers
Technical 2.3 4.0 na 4.1 1.4 1.6 1.8 1.5
Professionals 0.3 0.2 na 2.8 0.7 0.4 0.7 3.8
Administrative 0.8 1.1 na 1.4 0.5 1.6 1.5 2.9
Clerical 0.3 0.6 na 1.1 0.3 1.0 0.7 2.0
Sales 3.7 3.1 na 4.3 1.8 2.8 4.8 5.2
Service 1.4 5.9 na 3.4 1.3 10.5 4.4 3.5
Farmers 87.5 76.1 na 75.1 90.0 73.3 77.8 71.3
Production etc. 3.1 7.8 na 7.1 3.0 7.6 7.9 8.7
Transport 0.1 0.0 na 0.0 0.0 0.0 0.0 0.1
Table 2b
Occupational Attributes (1-digit NOC) of Different Groups in India - 1993-2004 (%)
Generation
Group Occupational Group
1993 2003
ST SC OBC GEN ST SC OBC GEN
Sons
Technical 3.0 2.2 na 3.0 1.1 1.8 1.8 2.2
Professionals 1.2 0.9 na 2.5 1.5 2.3 2.4 4.1
Administrative 0.8 0.4 na 2.8 1.4 1.8 3.2 6.4
Clerical 1.7 0.8 na 2.9 1.1 1.7 1.9 3.2
Sales 5.2 2.1 na 11.5 3.1 7.0 11.1 17.3
Service 2.4 0.8 na 2.3 1.8 4.0 3.5 1.9
Farmers 64.3 77.3 na 56.3 70.5 49.7 52.3 44.2
Production etc. 14.8 8.5 na 14.0 10.4 22.0 18.0 14.4
Transport 2.0 0.9 na 2.5 1.9 4.3 3.7 4.0
Labourers nec 4.6 6.2 na 2.2 7.2 5.4 2.2 2.3
Daughters
Technical 5.7 3.3 na 4.5 1.7 1.5 2.5 2.1
Professionals 1.4 0.9 na 4.2 1.6 2.9 4.3 13.0
Administrative 0.2 1.8 na 1.2 0.2 1.5 1.4 3.6
Clerical 0.2 0.2 na 1.9 0.5 0.5 1.4 3.2
Sales 0.6 1.5 na 1.5 0.6 2.1 2.3 2.5
Service 3.4 0.9 na 1.9 1.0 4.0 2.0 1.9
Farmers 78.8 85.6 na 74.0 85.8 74.0 74.3 62.0
Production etc. 7.9 3.7 na 9.8 4.8 12.1 11.3 10.9
Transport 0.1 0.0 na 0.0 0.0 0.2 0.1 0.3
Labourers nec 1.7 2.2 na 1.0 3.9 1.0 0.5 0.5
Table 2c
Occupational Attributes (1-digit NOC) of Different Groups in India - 1993-2004 (%)
Generation
Group Occupational Group
1993 2003
ST SC OBC GEN ST SC OBC GEN
All
Technical 4.3 5.4 na 4.8 1.1 1.5 1.6 2.6
Professionals 1.7 1.8 na 4.8 1.6 1.7 2.3 6.1
Administrative 2.1 1.0 na 3.8 1.2 1.6 3.0 6.8
Clerical 1.4 2.9 na 5.4 1.3 2.1 2.4 5.0
Sales 3.5 6.0 na 13.1 2.8 4.8 7.9 12.8
Service 1.4 5.0 na 3.5 1.8 5.7 4.4 3.7
Farmers 65.2 48.6 na 38.8 76.0 57.3 57.2 44.1
Production etc. 11.3 21.0 na 20.0 7.9 18.0 16.8 14.0
Transport 0.9 2.7 na 3.0 1.2 3.1 2.6 3.3
Labourers nec 8.1 5.7 na 2.7 5.0 4.1 2.0 1.8
20-40
Technical 2.7 3.4 na 3.4 1.1 1.5 1.8 2.5
Professionals 1.0 1.2 na 3.3 1.8 2.0 2.6 6.0
Administrative 1.3 0.7 na 2.7 1.2 1.5 3.0 6.5
Clerical 0.8 2.0 na 3.8 1.1 1.8 2.0 4.5
Sales 2.1 4.0 na 9.5 2.9 5.2 8.4 13.8
Service 0.9 3.3 na 2.5 2.0 5.6 4.2 3.8
Farmers 78.9 65.3 na 55.6 73.9 54.0 53.4 40.2
Production etc. 6.8 14.3 na 14.8 8.6 20.1 19.1 16.7
Transport 0.6 1.9 na 2.3 1.3 3.6 3.1 3.9
Labourers nec 5.0 3.9 na 2.0 6.0 4.6 2.4 2.2
40+
Technical 1.8 4.9 na 3.4 1.1 1.4 1.3 2.9
Professionals 1.6 0.9 na 4.1 1.5 1.5 1.9 6.6
Administrative 0.9 0.3 na 2.3 1.2 1.7 3.0 7.6
Clerical 1.3 0.9 na 3.6 2.0 3.1 3.4 6.5
Sales 3.1 4.0 na 5.7 2.7 4.2 7.1 11.3
Service 0.2 2.3 na 1.8 1.5 6.2 4.6 4.0
Farmers 70.6 47.2 na 43.4 79.2 61.2 62.0 46.8
Production etc. 6.8 7.5 na 6.0 6.7 15.0 13.4 10.3
Transport 12.2 30.8 na 29.1 0.9 2.3 1.9 2.6
Labourers nec 1.4 1.1 na 0.6 3.2 3.5 1.3 1.3
Table 3
Occupational Attributes (Occupational Grade) of Different Groups in India - 1993-2004 (%)
Generation
Group Occupational Group
1993 2003
ST SC OBC GEN ST SC OBC GEN
All
White 9.1 9.6 na 15.5 4.0 4.8 6.9 15.5
Pink 7.0 16.3 na 25.2 6.0 12.7 14.6 21.5
Blue 83.9 74.1 na 59.3 90.0 82.5 78.5 63.1
Fathers
White 3.2 4.7 na 9.3 3.0 5.0 6.2 15.1
Pink 5.0 11.1 na 16.1 4.7 13.6 14.7 20.3
Blue 91.8 84.2 na 74.7 92.3 81.4 79.1 64.6
Mothers
White 3.4 5.4 na 8.3 2.6 3.6 4.0 8.2
Pink 5.4 9.6 na 8.8 3.4 14.3 9.8 10.6
Blue 91.3 85.0 na 82.9 94.0 82.1 86.2 81.2
Sons
White 5.1 3.5 na 8.2 4.0 5.9 7.4 12.6
Pink 9.2 3.7 na 16.8 6.1 12.7 16.4 22.4
Blue 85.7 92.9 na 75.0 89.9 81.4 76.2 65.0
Daughters
White 7.4 6.0 na 9.9 3.5 6.0 8.2 18.7
Pink 4.2 2.6 na 5.3 2.1 6.7 5.6 7.6
Blue 88.5 91.4 na 84.8 94.5 87.3 86.2 73.7
20-40
White 4.9 5.3 na 9.5 4.1 5.0 7.3 14.9
Pink 3.8 9.3 na 15.8 6.1 12.6 14.6 22.1
Blue 91.3 85.4 na 74.7 89.8 82.4 78.1 63.0
40+
White 4.9 8.8 na 13.7 3.8 4.5 6.3 17.1
Pink 5.2 10.5 na 15.5 6.2 13.4 15.1 21.9
Blue 89.8 80.7 na 70.8 90.0 82.0 78.6 61.0
Source: Author’s calculations based on Data Sources mentioned in the text.
Table 4
Upward Educational Mobility of Different Generations in India - 1993 (%)
Social Group All Age Group 20-40 Age Group 40+ Age Group
Boys Girls All Boys Girls All Boys Girls All
Scheduled Tribe 47.5 18.1 35.2 47.9 18.4 35.5 34.2 3.8 24.3
Scheduled Caste 54.6 23.3 42.3 54.9 23.6 42.7 40.3 16.1 30.0
Other Backward Classes na na na na na na na na na
General/Advanced Class 62.0 35.9 51.3 61.9 36.5 51.5 66.7 17.0 47.6
Aggregate 59.8 32.7 48.8 59.8 33.3 49.0 62.3 16.2 44.5
Source: Author’s calculations based on Data Sources mentioned in the text.
Table 5
Upward Educational Mobility of Different Generations in India - 2004 (%)
Social Group All Age Group 20-40 Age Group 40+ Age Group
Boys Girls All Boys Girls All Boys Girls All
Scheduled Tribe 60.6 36.4 51.1 61.4 36.6 51.5 42.3 25.7 39.0
Scheduled Caste 64.2 37.7 54.0 64.5 38.2 54.2 57.2 13.6 47.7
Other Backward Classes 66.4 41.6 56.3 66.3 42.0 56.2 68.4 31.7 59.2
General/Advanced Class 63.1 50.4 58.0 62.8 50.6 57.8 69.2 45.9 63.1
Aggregate 64.4 43.7 56.1 64.4 44.0 56.1 65.7 35.5 58.2
Source: Author’s calculations based on Data Sources mentioned in the text.
Table 6
Upward Occupational Mobility (NOC1) of Different Generations in India - 1993 (%)
Social Group All Age Group 20-40 Age Group 40+ Age Group
Boys Girls All Boys Girls All Boys Girls All
Scheduled Tribe 7.0 9.0 7.6 7.0 9.1 7.7 2.5 0.0 1.8
Scheduled Caste 12.6 16.8 13.5 12.6 16.9 13.4 18.7 18.0 18.5
Other Backward Classes na na na na na na na na na
General/Advanced Class 13.7 13.2 13.6 13.6 13.2 13.5 19.1 14.8 18.3
Aggregate 12.9 13.1 13.0 12.9 13.1 12.9 18.0 13.8 17.1
Source: Author’s calculations based on Data Sources mentioned in the text.
Table 7
Upward Occupational Mobility (NOC1) of Different Generations in India - 2004 (%)
Social Group All Age Group 20-40 Age Group 40+ Age Group
Boys Girls All Boys Girls All Boys Girls All
Scheduled Tribe 16.6 8.7 9.7 10.1 8.8 9.7 14.3 2.3 11.2
Scheduled Caste 20.8 18.0 15.7 14.9 18.1 15.5 29.1 12.9 25.9
Other Backward Classes 18.1 12.6 14.7 15.2 12.8 14.7 18.1 3.4 15.3
General/Advanced Class 20.9 20.4 17.4 16.7 20.6 17.4 20.0 11.3 18.7
Aggregate 19.3 15.1 15.3 15.2 15.3 15.2 19.9 7.1 17.6
Table 8
Upward Occupational Mobility (Occ Gr) of Different Generations in India - 1993 (%)
Social Group All Age Group 20-40 Age Group 40+ Age Group
Boys Girls All Boys Girls All Boys Girls All
Scheduled Tribe 5.0 6.4 5.4 5.1 6.5 5.5 2.5 0.0 1.8
Scheduled Caste 8.0 8.7 8.1 7.9 8.7 8.1 17.1 7.5 14.4
Other Backward Classes na na na na na na na na na
General/Advanced Class 10.7 9.2 10.5 10.6 9.2 10.3 18.0 12.3 16.9
Aggregate 9.8 8.7 9.6 9.7 8.7 9.5 16.9 10.3 15.6
Source: Author’s calculations based on Data Sources mentioned in the text.
Table 9
Upward Occupational Mobility (Occ Gr) of Different Generations in India - 2004 (%)
Social Group All Age Group 20-40 Age Group 40+ Age Group
Boys Girls All Boys Girls All Boys Girls All
Scheduled Tribe 7.7 4.5 6.8 7.6 4.6 6.8 14.0 2.3 11.0
Scheduled Caste 10.2 7.2 9.7 10.0 7.1 9.4 27.7 11.7 24.5
Other Backward Classes 12.1 8.3 11.3 12.0 8.5 11.3 15.7 3.4 13.4
General/Advanced Class 13.5 15.6 13.9 13.4 15.9 13.8 16.7 5.8 15.0
Aggregate 11.9 9.6 11.4 11.7 9.7 11.3 17.3 5.1 15.1
Table 10a
Determinants of Years of Schooling in India – 2004 - RURAL
Equation (2): Dependent Variable - Completed Years of Schooling (Method: Separate Regressions)
Scheduled Tribe Scheduled Caste OBC General
Boys Girls Boys Girls Boys Girls Boys Girls
(Constant) 5.824 4.020 5.924 3.573 6.312 3.752 6.595 4.835 Father's Education 0.413 0.379 0.410 0.385 0.387 0.299 0.357 0.305 Mother's Education 0.120 0.410 0.176 0.408 0.168 0.540 0.140 0.383 Poverty Status -1.994 -2.362 -1.467 -1.694 -1.402 -1.617 -1.355 -1.670 Adjusted R Squared
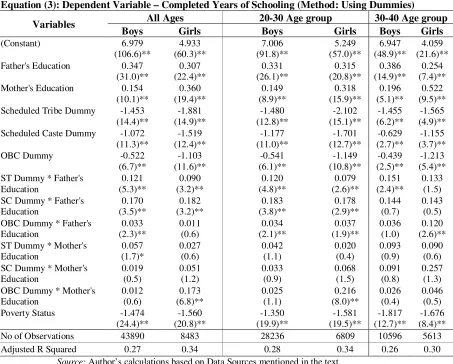
Equation (3): Dependent Variable – Completed Years of Schooling (Method: Using Dummies)
Variables All Ages 20-30 Age group 30-40 Age group
Boys Girls Boys Girls Boys Girls
(Constant) 6.979 (106.6)** 4.933 (60.3)** 7.006 (91.8)** 5.249 (57.0)** 6.947 (48.9)** 4.059 (21.6)** Father's Education 0.347
(31.0)** 0.307 (22.4)** 0.331 (26.1)** 0.315 (20.8)** 0.386 (14.9)** 0.254 (7.4)** Mother's Education 0.154
(10.1)** 0.360 (19.4)** 0.149 (8.9)** 0.318 (15.9)** 0.196 (5.1)** 0.522 (9.5)** Scheduled Tribe Dummy -1.453
(14.4)** -1.881 (14.9)** -1.480 (12.8)** -2.102 (15.1)** -1.455 (6.2)** -1.565 (4.9)** Scheduled Caste Dummy -1.072
(11.3)** -1.519 (12.4)** -1.177 (11.0)** -1.701 (12.7)** -0.629 (2.7)** -1.155 (3.7)** OBC Dummy -0.522
(6.7)** -1.103 (11.6)** -0.541 (6.1)** -1.149 (10.8)** -0.439 (2.5)** -1.213 (5.4)** ST Dummy * Father's
Education 0.121 (5.3)** 0.090 (3.2)** 0.120 (4.8)** 0.079 (2.6)** 0.151 (2.4)** 0.133 (1.5) SC Dummy * Father's
Education 0.170 (3.5)** 0.182 (3.2)** 0.183 (3.8)** 0.178 (2.9)** 0.144 (0.7) 0.143 (0.5) OBC Dummy * Father's
Education 0.033 (2.3)** 0.011 (0.6) 0.034 (2.1)** 0.037 (1.9)** 0.036 (1.0) 0.120 (2.6)** ST Dummy * Mother's
Education 0.057 (1.7)* 0.027 (0.6) 0.042 (1.1) 0.020 (0.4) 0.093 (0.9) 0.090 (0.6) SC Dummy * Mother's
Education 0.019 (0.5) 0.051 (1.2) 0.033 (0.9) 0.068 (1.5) 0.091 (0.8) 0.257 (1.3) OBC Dummy * Mother's
Education 0.012 (0.6) 0.173 (6.8)** 0.025 (1.1) 0.216 (8.0)** 0.026 (0.4) 0.046 (0.5) Poverty Status -1.474
(24.4)** -1.560 (20.8)** -1.350 (19.9)** -1.581 (19.5)** -1.817 (12.7)** -1.676 (8.4)** No of Observations 43890 8483 28236 6809 10596 5613 Adjusted R Squared 0.27 0.34 0.28 0.34 0.26 0.30
Source: Author’s calculations based on Data Sources mentioned in the text.
Table 10b
Determinants of Years of Schooling in India – 2004 – URBAN
Equation (2): Dependent Variable - Completed Years of Schooling (Method: Separate Regressions)
Scheduled Tribe Scheduled Caste OBC General
Boys Girls Boys Girls Boys Girls Boys Girls
(Constant) 7.275 6.057 6.892 5.472 7.144 6.106 7.568 7.172 Father's Education 0.342 0.369 0.340 0.366 0.349 0.299 0.348 0.291 Mother's Education 0.166 0.274 0.137 0.258 0.139 0.307 0.108 0.214 Poverty Status -1.673 -2.223 -1.773 -2.303 -1.473 -1.870 -2.025 -2.437 Adjusted R Squared
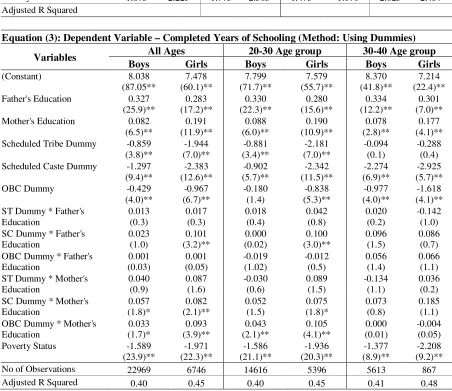
Equation (3): Dependent Variable – Completed Years of Schooling (Method: Using Dummies)
Variables All Ages 20-30 Age group 30-40 Age group
Boys Girls Boys Girls Boys Girls
(Constant) 8.038 (87.05** 7.478 (60.1)** 7.799 (71.7)** 7.579 (55.7)** 8.370 (41.8)** 7.214 (22.4)** Father's Education 0.327
(25.9)** 0.283 (17.2)** 0.330 (22.3)** 0.280 (15.6)** 0.334 (12.2)** 0.301 (7.0)** Mother's Education 0.082
(6.5)** 0.191 (11.9)** 0.088 (6.0)** 0.190 (10.9)** 0.078 (2.8)** 0.177 (4.1)** Scheduled Tribe Dummy -0.859
(3.8)** -1.944 (7.0)** -0.881 (3.4)** -2.181 (7.0)** -0.094 (0.1) -0.288 (0.4) Scheduled Caste Dummy -1.297
(9.4)** -2.383 (12.6)** -0.902 (5.7)** -2.342 (11.5)** -2.274 (6.9)** -2.925 (5.7)** OBC Dummy -0.429
(4.0)** -0.967 (6.7)** -0.180 (1.4) -0.838 (5.3)** -0.977 (4.0)** -1.618 (4.1)** ST Dummy * Father's
Education 0.013 (0.3) 0.017 (0.3) 0.018 (0.4) 0.042 (0.8) 0.020 (0.2) -0.142 (1.0) SC Dummy * Father's
Education 0.023 (1.0) 0.101 (3.2)** 0.000 (0.02) 0.100 (3.0)** 0.096 (1.5) 0.086 (0.7) OBC Dummy * Father's
Education 0.001 (0.03) 0.001 (0.05) -0.019 (1.02) -0.012 (0.5) 0.056 (1.4) 0.066 (1.1) ST Dummy * Mother's
Education 0.040 (0.9) 0.087 (1.6) -0.030 (0.6) 0.089 (1.5) -0.134 (1.1) 0.036 (0.2) SC Dummy * Mother's
Education 0.057 (1.8)* 0.082 (2.1)** 0.052 (1.5) 0.075 (1.8)* 0.073 (0.8) 0.185 (1.1) OBC Dummy * Mother's
Education 0.033 (1.7)* 0.093 (3.9)** 0.043 (2.1)** 0.105 (4.1)** 0.000 (0.01) -0.004 (0.05) Poverty Status -1.589
(23.9)** -1.971 (22.3)** -1.586 (21.1)** -1.936 (20.3)** -1.377 (8.9)** -2.208 (9.2)** No of Observations 22969 6746 14616 5396 5613 867 Adjusted R Squared 0.40 0.45 0.40 0.45 0.41 0.48
Source: Author’s calculations based on Data Sources mentioned in the text.
Table 11
Derived Mobility Indices of Schooling in India – 2004
Scheduled Tribe Scheduled Caste OBC General
Boys Girls Boys Girls Boys Girls Boys Girls
Equation 2 Rural 3.8 2.5 3.4 2.5 3.6 2.4 4.0 2.9 Urban 3.9 3.1 4.2 3.2 4.1 3.3 4.4 4.0 Equation 3 Rural 2.3 2.2 2.3 1.8 3.4 1.9 4.0 3.0 Urban 3.9 2.9 3.5 2.4 4.2 3.0 4.9 4.2
Source: Author’s calculations based on Data Sources mentioned in the text.
[image:27.612.92.522.230.446.2]Note: Mobility Indices are derived as inverse of the Average of the coefficients of Father’s and Mother’s educational level in Equation 2 and 3.
Table 12a
Determinants of Occupational Status in India – 2004 - RURAL
Partial Correlation of Child’s Occupation after controlling for Poverty Status
I digit NOC Scheduled Tribe Scheduled Caste OBC General
Boys Girls Boys Girls Boys Girls Boys Girls
All Ages Father’s Occupation 0.23** 0.19* 0.33** 0.14* 0.22** 0.11 0.17* 0.13 Mother’s Occupation 0.27** 0.33** 0.21** 0.46** 0.14* 0.45** 0.18* 0.22* 20-30 Age Father’s Occupation 0.37** 0.23** 0.36** 0.22* 0.26** 0.18* 0.22** 0.16
Mother’s Occupation 0.23** 0.35** 0.22* 0.46** 0.17 0.46** 0.13* 0.15 30-40 Age Father’s Occupation 0.21** 0.20* 0.29** 0.15 0.15 0.13 0.17* 0.13
Mother’s Occupation 0.14* 0.50** 0.14* 0.62** 0.17* 0.43** 0.10 0.37**
Broad Occupational Group
All Ages Father’s Occupation 0.24* 0.16* 0.27* 0.17* 0.26* 0.16 0.22* 0.13 Mother’s Occupation 0.28** 0.33** 0.23* 0.50** 0.19* 0.48** 0.20* 0.24* 20-30 Age Father’s Occupation 0.27* 0.32** 0.30** 0.25* 0.31** 0.21* 0.27** 0.17
Mother’s Occupation 0.24* 0.37** 0.24* 0.51** 0.21* 0.49** 0.16 0.27* 30-40 Age Father’s Occupation 0.24** 0.20* 0.25** 0.01 0.19* 0.06 0.18* 0.12
Mother’s Occupation 0.26** 0.44** 0.21* 0.62** 0.12 0.45** 0.07 0.30**
Source: Author’s calculations based on Data Sources mentioned in the text.
[image:27.612.93.519.488.695.2]Note: * and ** indicates significance at 1 per cent and 5 per cent levels respectively.
Table 12b
Determinants of Occupational Status in India – 2004 – URBAN
Partial Correlation of Child’s Occupation after controlling for Poverty Status
I digit NOC Scheduled Tribe Scheduled Caste OBC General
Boys Girls Boys Girls Boys Girls Boys Girls
All Ages Father’s Occupation 0.37** 0.38** 0.48** 0.28* 0.23* 0.27* 0.30* 0.21* Mother’s Occupation 0.28* 0.60** 0.34* 0.40** 0.26* 0.50** 0.13 0.25* 20-30 Age Father’s Occupation 0.35** 0.44** 0.48** 0.17 0.30** 0.24* 0.18 0.14
Mother’s Occupation 0.39** 0.67** 0.33* 0.31* 0.29** 0.53** 0.20 0.13 30-40 Age Father’s Occupation 0.12 0.42** 0.36** 0.92** 0.21* 0.87** 0.20* 0.25*
Mother’s Occupation 0.25* 0.32** 0.49** 0.62** 0.35** 0.53** 0.13 0.26*
Broad Occupational Group
All Ages Father’s Occupation 0.28** 0.41** 0.55** 0.41** 0.33* 0.39** 0.25* 0.29* Mother’s Occupation 0.41** 0.63** 0.42** 0.62** 0.36** 0.61** 0.16 0.25 20-30 Age Father’s Occupation 0.35** 0.52** 0.54** 0.31* 0.39** 0.35** 0.34** 0.10 Mother’s Occupation 0.49** 0.69** 0.39** 0.57** 0.35** 0.62** 0.31** 0.29* 30-40 Age Father’s Occupation 0.45** 0.44** 0.57** 0.92** 0.23* 0.94** 0.23* 0.36**
Mother’s Occupation 0.32** 0.65** 0.56** 0.64** 0.51** 0.74** 0.39** 0.45**
Source: Author’s calculations based on Data Sources mentioned in the text.
Table 13
Derived Mobility Indices of Occupational Status in India – 2004
Partial Correlation of Child’s Occupation after controlling for Poverty Status
I digit NOC Scheduled Tribe Scheduled Caste OBC General
Boys Girls Boys Girls Boys Girls Boys Girls
All Ages Rural 4.0 3.8 3.7 3.4 5.6 3.6 5.6 5.8 Urban 3.0 2.1 2.5 2.9 4.0 2.6 4.7 4.4 20-30 Age Rural 3.4 3.4 3.5 2.9 4.7 3.1 5.7 6.5 Urban 2.7 1.8 2.5 4.1 3.4 2.6 5.3 7.4 30-40 Age Rural 5.7 2.9 4.6 2.6 6.3 3.5 7.5 4.0 Urban 5.4 2.7 2.4 1.3 3.6 1.4 6.2 4.0
Broad Occupational Group
All Ages Rural 3.9 4.1 4.0 3.0 4.5 3.1 4.8 5.3 Urban 2.9 1.9 2.1 1.9 2.9 2.0 4.9 3.7 20-30 Age Rural 3.9 2.9 3.7 2.6 3.9 2.8 4.7 4.6 Urban 2.4 1.7 2.2 2.3 2.7 2.1 3.1 5.1 30-40 Age Rural 4.0 3.1 4.4 3.2 6.4 4.0 8.2 4.7 Urban 2.6 1.8 1.8 1.3 2.7 1.2 3.2 2.5
Source: Author’s calculations based on Data Sources mentioned in the text.