http://dx.doi.org/10.4236/cs.2016.76089
ART Based Reliable Method for
Prediction of Agricultural Land
Changes Using Remote Sensing
Muthu Pandian Malini
1, Madurai Chidambaram Sashi Kumar
2, N. Sakthieswaran
1 1Department of Civil Engineering, Anna University Regional Campus, Tirunelveli, India2Department of Civil Engineering, College of Anna University, Dindugal, India
Received 23 March 2016; accepted 24 May 2016; published 27 May 2016
Copyright © 2016 by authors and Scientific Research Publishing Inc.
This work is licensed under the Creative Commons Attribution International License (CC BY).
http://creativecommons.org/licenses/by/4.0/
Abstract
This paper focuses on prediction of change in agricultural lands by using ART2 algorithm. The ex-isting method used ENVI and ARCGIS software to predict the changes in land, which showed less accuracy due to human errors. To overcome this user friendly GUI based ART2 algorithm has been developed in java to obtain more accuracy in prediction of changes in land. The input is satellite temporal images of the years 1990 and 2014. By using the ART2 algorithm, the input images of the years 1990 and 2014 are classified, where the features are identified to form cluster. The clus-tered image is given as input and pixel to pixel comparison method in ART2 is implemented in ja-va, for detecting the changes in agricultural lands. The comparison results of ENVI and ARCGIS and GUI based ART2 with in situ data show that the prediction of changes in agricultural land is more accurate in the case of GUI based ART2 implementation.
Keywords
ART2 Classification, Land Cover, Multi Temporal Analysis, Land Change Detection, Remote Sensing
1. Introduction
1.1. General
pressure, land degradation results mainly lead to intense land use without proper management practices [1]-[3]. By the human activities, there is an increase of built up land area and decrease agricultural land. Recent func-tioning of the real estate people and property promoters are bringing a serious disaster to forest area and agri-cultural land. Changes of agriagri-cultural land detection are essential to understand the existing situation and plan for the future. The aim is to analyze the agricultural land use/land cover pattern of Tirunelveli city and estimate the change of agricultural land over the period 1990 to 2014 and then to develop the model for agricultural land use change detection using adaptive resonance theory.
Artificial neural networks have more general and flexible functional forms than the traditional statistical me-thods and can effectively deal with supervised and unsupervised learning meme-thods and address problems such as pattern recognition and prediction [4]. Adaptive resonance theory is used to process the human cognitive infor-mation [5]. ART can be used as a real time neural network model which performs supervised and unsupervised learning. It also performs pattern recognition and prediction [6] [7]. Most of the applications in ART, uses fast learning, for each input vector pattern, the updation of weights converge to equilibrium. Fast learning creates memories that depend upon the order of output presentation. ART applications exploit this feature to improve accuracy by voting across several trained networks, with voters providing a measure of confidence in each pre-diction. ART is a part of a growing family of self organizing network models that feature attentional feedback and stable code learning. ART systems can be used to classify the databases and produce validated classification results, and to focus attention upon those featural groupings. ART2 network extends between capabilities to support continuous inputs [(Grossberg and Carpenter, 1987].
ART1 was designed for clustering binary vectors. ART2 for clustering continuous or real valued vectors. The learning laws of ART2 are simple though the network is complicated. The F1 field in ART2 includes a combi-nation of normalization and noise suppression in addition to the comparison of the bottom up and top down signals needed for the reset mechanism. The orienting subsystem can also to accommodate real valued data [3] [8]-[13].
1.2. Related Study
Masroor Hussain, depicts that the there are two artificial neural network algorithms applied such as multi layer perceptron and maximum likelihood and then compared. These methods are implemented for classification and change detection processes. Here SOM produced high accurate results [1]. The author developed a automated land cover change detection system using back propagation network algorithm. This system is compared with maximum likelihood classification method. Using post classification method in ENVI, change detection process is done. The artificial neural method in change detection process produced high accuracy [2]. The author has in-troduced eleven change detection techniques the post classification and PCA, image differencing and image ra-tio methods were implemented and compared. Here PCA produced high accuracy results and at last artificial neural network was implemented which produced higher accuracy result than other techniques [3]. Nitton Cor-redia da Silva has developed automated system software for classification and change detection process in C++ language [4]. This author tells that the neural network based change detection system is implemented using back propagation neural network. It identified changed and non changed area [5]. [6], denotes that the classification of images is performed using multilayer peceptron which uses supervised learning method. The artificial neural network classification method is implemented in ENVI 4.7 software. The change detection process is done using post classification method which is a familiar method. [7], compares the result of artificial neural network tech-nique with maximum likelihood result in the classification process. It is proved that artificial neural network al-gorithm produced higher accuracy than maximum likelihood. Conventional alal-gorithms such as Hopfield, back propagation algorithms were used. In this paper, ART2 algorithm being used to give more stability and plasticity. Thus making this system fully automated [3] [8]-[13].
2. Study Area and Data Used
2.1. Study Area
Paddy, Cholam, Ragi, Cumbu Maize and other minor millets. The commercial crops are Cotton, Chillies, Su-garcane and Groundnut.
2.2. Data Used
For this research work, IRS P6 LISS III satellite images for the years of 1990 and 2014 were acquired with res-olution 23.6 m for determining agriculture changes between these years in Tirunelveli region, Tamiladu from NRSC, Hydrabad. The statistical data about population, rain fall data, area coverage of Crop, built-up, forest, waste land and water bodies for 1990 and 2014 were collected from statistical office, Tirunelveli for verification purpose.
2.3. Software Used
a) ARCGIS—This has been also used to compliment the display and processing of the data and subsequently for change detection analysis of the study area.
b) ENVI 4.7—This is used for the development of land use land cover classes and determine the statistics of change detection
c) JAVA AND APPLET—This is used for modeling of agricultural land change detection.
3. Methodology
3.1. General
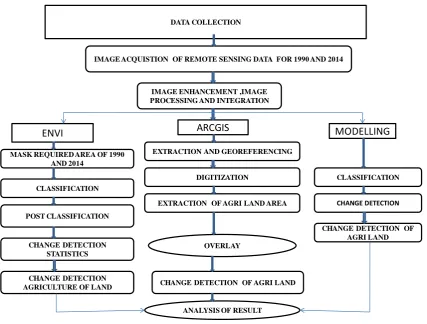
[image:3.595.102.530.381.705.2]The procedure adopted in this research work forms the basis for deriving statistics of agriculture land changes between the years of 1990 and 2014. The methodology has been developed and tested for detecting agricultural land changes in Tirunelveli city. The overview of the study is given inFigure 1.
Figure 1. Flow chart for change detection of agricultural land.
DATA COLLECTION
IMAGE ACQUISTION OF REMOTE SENSING DATA FOR 1990 AND 2014
IMAGE ENHANCEMENT ,IMAGE PROCESSING AND INTEGRATION
ENVI
ARCGIS
MODELLING
MASK REQUIRED AREA OF 1990 AND 2014 CLASSIFICATION POST CLASSIFICATION CHANGE DETECTION STATISTICS DIGITIZATION
EXTRACTION OF AGRI LAND AREA
CLASSIFICATION
CHANGE DETECTION
CHANGE DETECTION OF AGRI LAND OVERLAY
CHANGE DETECTION OF AGRI LAND EXTRACTION AND GEOREFERENCING
CHANGE DETECTION AGRICULTURE OF LAND
3.2. Methods of Data Analysis
The flowchart as shown inFigure 1,Image registration and Enhancement processes are implemented before the classification in ENVI. The required area is masked from the input images. The images are classified using maximum likelihood supervised classification. With help of post classification method, the change detection sta-tistics are determined and the accuracy of classification is obtained. In ARCGIS, first the study area from the images is extracted and digitized using tools. Through overlay operations, with help of SQL, the agriculture area is selected using select command. Using clip operation, agriculture area of 1990 and 2014 are given as input and the changed area is found. At last the result of all the software is analyzed.
3.3. Image Pre Processing
Two clear, cloud free IRS P6 LISS III images were selected to classify the study area for 1990 and 2014 years. The Tiunelveli city area is entirely contained within IRS P6 images path: 101 and Row 67, 68. The two images were geo referenced using well distributed ground control points and convolution resampling method. The nois-es of imagnois-es spatially and spectrally were rectified by using high and low pass filters. After preprocnois-essing, the root mean square errors were less than.25 pixels for each of the two images. Image processing was performed using ENVI 4.7. Land use/land cover mapping is achieved through interpretation of IRS P6 LISS III images of 1990 and 2014.
3.4. Image Classification
[image:4.595.90.535.527.713.2]Based on Anderson land use/ land cover classification system, the images are classified as forest land, water bo-dies, agriculture land, waste land and settlement area. Before implementing the classification, the region of in-terests is created using ground truth data. The field work was carried out to collect the ground truth data for training purpose in the input satellite images. After collecting the ground truth data, the points are inserted into images through software as shown in Figure 2. In order to create ROI, the set of points are selected randomly and then mapped. The image classification was carried out in ENVI 4.7 software. A supervised classification technique with Maximum Likelihood Algorithm was applied. The classification was done based on training samples for the images of 1990 and 2014.The classified images of 1990 and 2014 were produced by using su-pervised image classification technique based on the Maximum Likelihood Classifier(MLC). Based on Ander-son land use/land cover classification system, the images are classified as forest land, water bodies, agriculture land, waste land and settlement area. Before implementing the classification, the region of interests is created using ground truth data. The field work was carried out to collect the ground truth data for training purpose in the input satellite images. After collecting the ground truth data, the points are inserted into images through software. In order to create ROI, the set of points are selected randomly and then mapped. The image classifica-tion was carried out in ENVI 4.7 software. A supervised classificaclassifica-tion technique with Maximum Likelihood
Algorithm was applied. The classification was done based on training samples for the images of 1990 and 2014. The classified images of 1990 and 2014 were produced by using supervised image classification technique based on the Maximum Likelihood Classifier (MLC).
3.5. Testing
The accuracy of classification is assessed using ENVI 4.7 software. The confusion matrix in post classification is selected as error matrix. Error matrix is mapped between class and reference class (ROI) to assess accuracy. In the assessment, overall accuracy, users, producer’s accuracies and Kappa coefficient were derived from error matrices. Here overall accuracy is calculated from diagonal elements and off diagonal elements of matrix.
3.6. Change Detection
The classified images of 1990 and 2014 were given as input to the change detection statistics. Following the classification of imagery from the individual years, a multi date post-classification comparison change detection statistics was used to determine changes in land cover in intervals, 1990-2014. The post classification approach provides information about the changes and land transformations occurred which can be easily calculated and mapped.
3.7. Methodology in ARCGIS
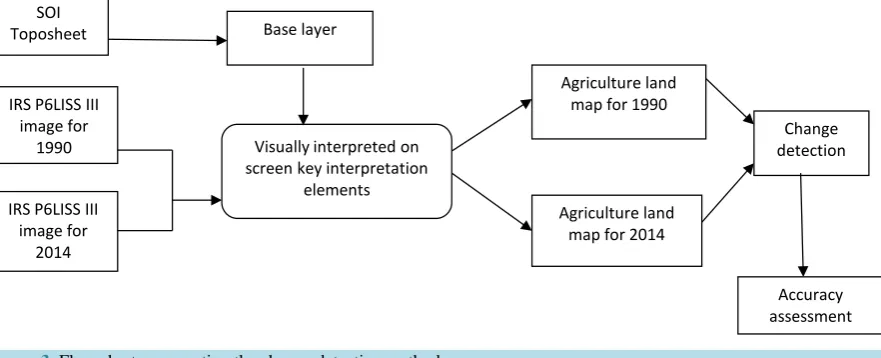
The overall process involved in methodology of ARGGIS software as shownFigure 3. In preprocessing, the images of 1990 and 2014 are enhanced by using contrast manipulation, edge enhancement, and spatial filter techniques. The first stage of process is to collect the toposheet from survey of India at 1:50,000. The toposheet is scanned and digitized and this is used as base map. With this base map, the study area of tirunelveli is ex-tracted from the input image. The second stage is to classify the images in different category of land use. The input images of Tirunelveli region are classified into 7 classes such as paddy, vegetation, water, forest, barren and urban. From classified images of 1990 and 2014, with the help of key interpretation, the agriculture land area is digitized. Many polygons are created and it shows the shape of the area in the attribute table. Then sum of shape area is calculated for year of 1990 and 2014 separately. The difference is calculated between years of agriculture land maps. This gives the details of the changes of agriculture land value.
3.8. Modeling in Artificial Neural Network
3.8.1. Adaptive Resonance Theory [image:5.595.94.535.532.711.2]Images of 1990 and 2014 are classified using artificial neural network. In this paper, the images are classified using adaptive resonance theory. ART is an unsupervised classification algorithm which accepts number of bands present in the input images. ART differs from conventional artificial neural network. It solves the problem
Figure 3. Flow chart representing the change detection method. Agriculture land
map for 2014 SOI
Toposheet Base layer
IRS P6LISS III image for
1990
IRS P6LISS III image for
2014
Visually interpreted on screen key interpretation
elements
Agriculture land map for 1990
Change detection
of stability-plasticity dilemma which means ART maintains stored pattern whenever new patterns are created. ART is an evolving self organizing model. There are two types network available in ART family namely ART1 and ART2. For the classification, pixels are clustered based on the band values. In change detection, the classi-fied image pixels are stored into databases separately for the year of images 1990 and 2014 then the pixel com-parison is done using ART algorithm.
3.8.2. Image Classification
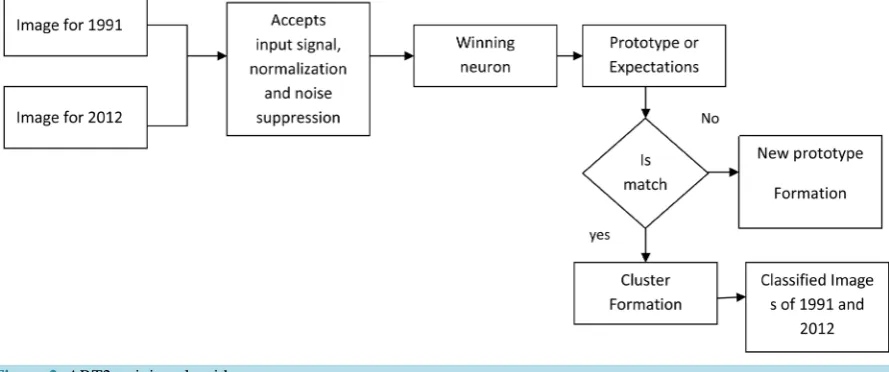
The enhanced images of 1990 and 2014 are the inputs to ART algorithm. Here the bands are accepted as inputs. Each band value is one neuron. For this study 3 bands of the IRS P6 LISS III satellite images of 1990 and 2014 are chosen as input images. So there are 3 neurons as input for ART neural network. The process of classifica-tion is performed in two layers (F1, F2) of ART. The F1 layer accepts the band values and normalizaclassifica-tion process is done for suppressing the noise. The product of sum is calculated between input values and weights which produce high value neuron and this neuron is considered as winning neuron. In F2 layer, the winning neuron is matched with stored pattern or prototype and if it is matches, the cluster is to be formed as separate one other-wise winning neuron is created as new pattern. Then the cluster is formed separately. The coding has imple-mented in java language.
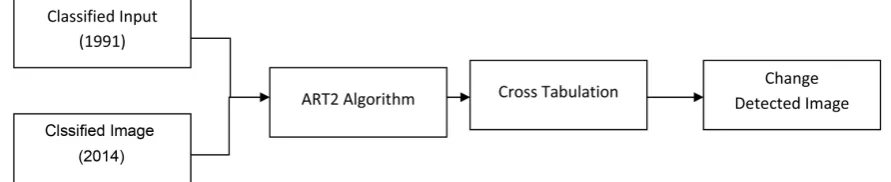
3.8.3. Change Detection
The classified images of 1990 and 2014 are the input images for change detection process. Using ART algo-rithm, pixels of the classified images 1990 and 2014 are stored into data bases. With the help of cross tabulation method, the change detected image is determined. The change detection process is implemented in java lan-guage.
4. Results and Discussions
4.1. Base Maps
The base map for Tirunelveli district was obtained from IRS P6 LISS III satellite images by using ARCGIS software. The image is geo referenced and digitized by using ARCGIS tools. Finally the layout of the base map is created. The base map as shown in Figure 4 consists of important location, tourist places, and railway lines, national and state highways.
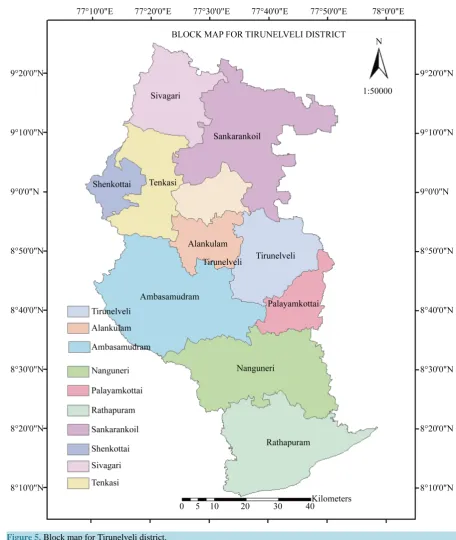
The block map represents area of taluks in Tirunelveli district as shown inFigure 5. Based upon geo refe-renced map, the boundary of Tirunelveli district and boundary of the all taluks in Tirunelveli district is digitized. From this the layout of the block map is obtained. All the process is done by using ARCGIS software. The Fig-ure 5 shows location of all taluks in Tirunelveli district.
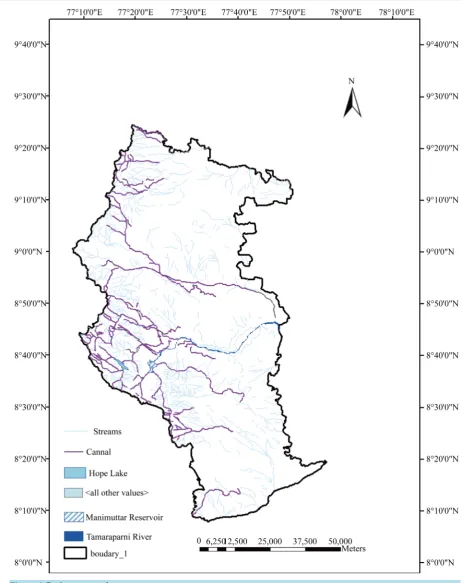
Figure 6 represents drainage network map which shows canals, streams, thamirabarani river, Manimuthar re-servoir. All the draining networks are digitized by using ARCGIS software.
4.2. Results in ENVI 4.7
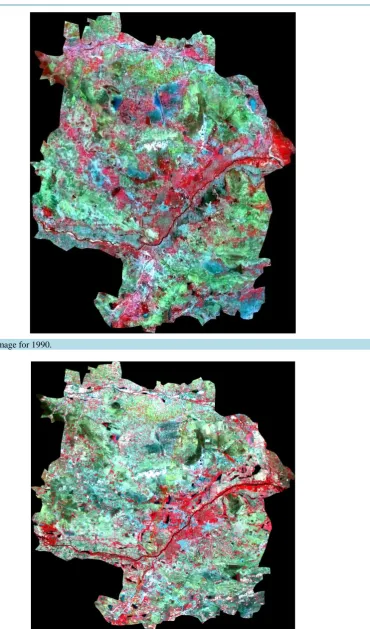
The input images for 1990 and 2014 are obtained from IRS P6 LISS III satellite images as shownFigure 7and Figure 8. By using ARCGIS software, the Tirunelveli taluk area is extracted with help of geo referenced data.
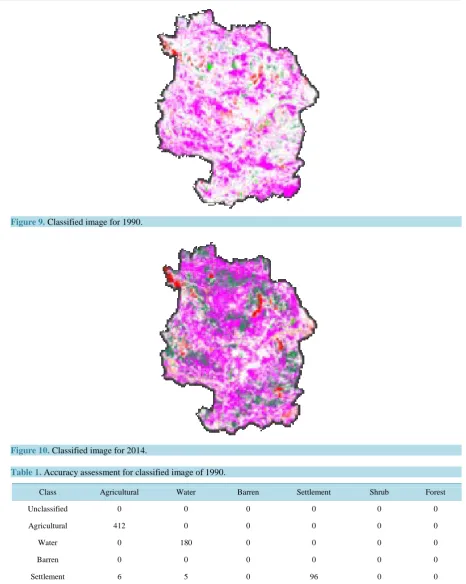
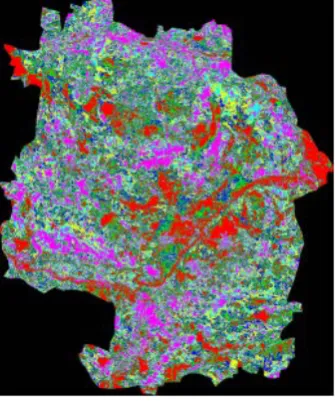
[image:6.595.91.537.609.700.2]The classified images of 1990 and 2014 are segmented into agriculture, water, barren, settlement, shrub and forest lands as shown in Figure 9andFigure 10. The white pixels represent agriculture area, magenta pixels
Figure 5. Block map for Tirunelveli district.
represent settlement area, green pixels denote water bodies, Sea green pixels show shrub, coral pixels indicate forest and red pixel represents barren land.
The accuracy assessment for the classified image of 1990 is 93.6054% and Kappa coefficient is 0.8884. All of the pixels are classified fully in the agriculture area and the pixels are misclassified only in the settlement area as shownTable 1. This method has produced high accuracy result in classification.
Figure 6. Drainage network map.
Figure 7. Input image for 1990.
Figure 9. Classified image for 1990.
[image:10.595.87.539.561.716.2]Figure 10. Classified image for 2014.
Table 1. Accuracy assessment for classified image of 1990.
Class Agricultural Water Barren Settlement Shrub Forest
Unclassified 0 0 0 0 0 0
Agricultural 412 0 0 0 0 0
Water 0 180 0 0 0 0
Barren 0 0 0 0 0 0
Settlement 6 5 0 96 0 0
Shrub 36 0 0 0 0 0
Forest 0 0 0 0 0 0
Table 2. Accuracy assessment for classified image of 2014.
Class Agricultural Water Barren Settlement Shrub Forest
Unclassified 0 0 0 0 0 0
Agricultural 310 7 0 2 0 0
Water 0 145 0 0 0 0
Barren 0 0 0 0 0 0
Settlement 5 30 0 382 0 0
Shrub 0 0 0 0 0 0
Forest 62 1 0 0 0 0
Total 377 183 0 384 0 0
Table 3. Statistics of change detection in ENVI 4.7.
Features Agriculture Barren Settlement Water Shrub Barren
Agriculture 0 0 0 0.0 0.0 0
Water 0 10 0.60 4.83 314.63 0
Settlement 0 0 0.81 0.04 5.91 0
Shrub 0 4 2.81 3.13 338.45 0
Forest 0 1 0.27 8.55 156.9 0
Barren 0 0 0.40 0.03 10.88 0
Change Difference −266.95 110.85 139 10.87 0.0 0.0
4.3. Results in ARCGIS
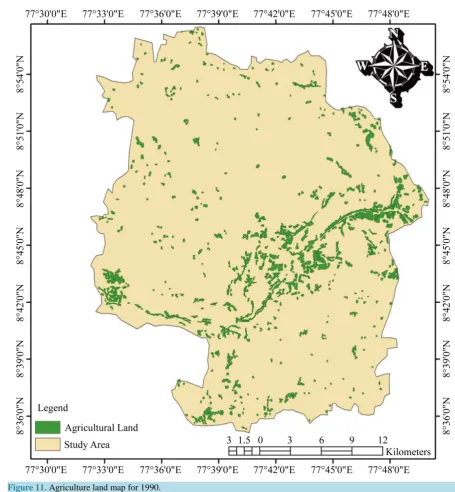
Figure 11and Figure 12depict agricultural land use maps for the year of 1990 and 2014. The extracted IRS P6 LISS III images of 1990 and 2014 for Tirunelveli taluk as input for creation ofagriculture land use map. First Tirunelveli taluk boundary is obtained by digitization then also agriculture areas are digitized thus generating the agriculture land use map. Here red color represents the agriculture area as shown inFigure 10 and Figure 11. Then calculated the change detected rate between the years of 1990 and 2014. The change detected rate is ob-tained from difference between sum of shape area in 1990 and 2014 agriculture land use maps. The calculated change detection between the years is 42,340 sq·m.
4.4. Results in Modeling
The input images are obtained from the satellite images of IRS P6 LISS III for 1990 and 2014. By using GUI based software model, the classified images, graph1 and graph2 are created automatically for both years sepa-rately. The classified images of 1990 and 2014 represents paddy, vegetation, water bodies, urban and unclassi-fied features as shownFigure 13andFigure 14. Here red color pixels indicates paddy and vegetation areas in both classified images.
Figure 15 depicts change detected image between 1990 and 2014. The image shows the changes of the land with different features such as urban, barren, vegetation, paddy, forest, water and classified. It depicts change detected image between 1990 and 2014.
Figure 11. Agriculture land map for 1990.
Figure 17shows that first bar has 1100 pixels with paddy feature, the second bar shows that there are 1000 pixels with vegetation feature, the third bar shows that there are 3000 pixels with water feature, the fourth bar shows that there are 3700 pixels forest feature, the fifth bar shows that there are 2100 pixels barren feature, the sixth bar shows that there are 2700 pixels with urban feature.
Figure 18denotes the paddy area has decreased up to 58,750 sq·m. and the vegetation has decreased up to 16,450 sq·m. There is no change in the water catchment area but changes occurred in forest and barren lands.
Figure 12. Agriculture land map for 2014.
Figure 14. Classified image of 2014.
[image:14.595.122.538.80.704.2]Number of features
Figure 16. Change detected graph 1.
[image:15.595.203.499.399.695.2]Number of features
Number of features
Figure 18. Change detected graph.
5. Conclusion
This research work demonstrates the ability of GIS and Remote Sensing in capturing spatial-temporal data. The agricultural land changes are found by implementing 3 techniques. Remote sensing and GIS are providing many tools for analysis of the satellite images. Using the tools, change detection is found in 3 ways. First the statistics value of agriculture land change between the year 1990 to 2014 is found using ENVI 4.7 software. The statistics shows that the agricultural land has decreased to 26,695 sq·m. The second way was done using ARCGIS soft-ware. The calculated change detection between the years is 42,340 sq·m. In this research, the automatic software is developed by using adaptive resonance theory algorithm. This is a fully automatic ad unsupervised learning method. This software is worked similar to ENVI 4.7 and ARCGIS software but produce high accuracy level and also the graphs are differently created for the year of 1990 and 2014. The software has focused that the sta-tistics value of agriculture land change is 58,750 sq·m. The value is compared with field data for the verification. Approximately the software has produced high accurate results. If the changes are continued in future, 70% people may be affected and pulled down to poverty level. This software can be used in future to predict the changes that have occurred due to the urbanization and reduction of ground water level.
References
[1] Hussain, M. (2013) Change Detection from Remotely Sensed Images: From Pixel-Based to Object-Based Approaches. ISPRS Journal of Photogrammetry and Remote Sensing, 80, 91-106. http://dx.doi.org/10.1016/j.isprsjprs.2013.03.006
[2] Fkirin, M.A. (2009) Change Detection Using Neural Network with Improvement Factor in Satellite Images. American Journal of Environmental Sciences, 5, 706-713.
[3] Haykin, S. (1994) Neural Networks, Comprehensive Foundation. College Publishing Company, New York.
[4] da Silva, N.C. (2012) Change Detection Software Using Self-Organizing Feature Maps. Brazilian Journal of Geophys-ics, 30, 505-518.
[5] Heerman, P.D. (1991) Classification of Multi-Spectral Remote Sensing Data Using Back-Propagation Neural Network. IEEE Transactions on Geoscience and Remote Sensing, 30, 81-88. http://dx.doi.org/10.1109/36.124218
[6] Ahmadizadeh, S. (2014) Land Use Change Detection Using Remote Sensing and Artificial Neural Network: Applica-tion to Birjand, Iran. Computational Ecology and Software, 4, 276-288.
[7] Deilmai, B.R. (2014) Comparison of Pixel-Based and Artificial Neural Networks Classification Methods for Detecting Forest Cover Changes in Malaysia, Earth and Environmental Science. 8th International Symposium of the Digital Earth (ISDE8).
[8] Pijanowski (2002) Using Neural Networks and GIS to Forecast Land Use Changes: A Land Transformation Model. Computers, Environment and Urban Systems, 26, 553-575.
[9] Abdullah, F. (2013) Investigating the Use of Remote Sensing and GIS Techniques to Detect Land Use and Land Cover Change: A Review. Advances in Remote Sensing, 193-204.
[10] Dam, H. (2008) Neural-Based Learning Classifier Systems. IEEE Transactions on Knowledge and Data Engineering,
20, 26-39. http://dx.doi.org/10.1109/TKDE.2007.190671
[11] Long Dal, X. (1999) Remotely Sensed Change Detection Based on Artificial Neural Networks. Photogrammetric En-gineering & Remote Sensing, 65, 1187-1194.
[12] Mas, J.F. (2008) The Application of Artificial Neural Networks to the Analysis of Remotely Sensed Data. Internation-al JournInternation-al of Remote Sensing, 29, 617-663. http://dx.doi.org/10.1080/01431160701352154
[13] Pajares, G. (2012) A Hopfield Neural Network for Image Change Detection. IEEE Transactions on Neural Networks,