Munich Personal RePEc Archive
Saving Unique Ecosystems by the Use of
Economic Methods and Instruments : Is
this possible?
Koundouri, Phoebe and Kountouris, Yiannis
2009
Saving Unique Ecosystems by the Use of Economic Methods and Instruments: Is
this possible?
Phoebe Koundouri2 and Yiannis Kountouris2
1 Senior Lecturer, Department of International and European Economic Studies, Athens University of Economics and Business, 76, Patission Street, Athens 104 34, Greece.
Em
2 PhD Candidate, Department of International and European Economic Studies, Athens University of Economics and Business, 76, Patission Street, Athens 104 34, Greece.
Em; Fax: +30 210 8214122.
1. Introduction
Since the 1990s flood risk and the effects of flooding episodes have reemerged as an
important natural hazard concern in central and northern Europe. These concerns have
also been exacerbated as a result of widespread and increasing awareness of global
climate change, and significant wetland loss due to rising sea levels. Global climate
change and wetland loss are expected to increase the frequency and extent of floods in
the future (Nichols et al., 1999). These floods are expected to cause significant
changes in the current land use and population patterns. Contrary to floods of the past
centuries, recent European floods have milder effects in terms of loss of human life.
Nevertheless the economic costs of flooding are rapidly increasing as a result of
increased costs of damages to infrastructure and production in primary, secondary and
tertiary sectors, and disruptions to transport. The estimated costs of the damages of
the floods of 1997 and 2001 are in the region of one billion USD for Poland, and 250
consequence of the increasing economic and social costs of floods, European
governments have taken a more involved approach in flood risk reduction.
With these effects in mind and given the special circumstances in the Brobrek
catchment, the central questions we seek to answer in this chapter are the following:
What are the benefits for the general public from reducing flood risk, improving
biodiversity and improving recreational river access? From which of the above
characteristics does the Polish public derive the greatest improvement in welfare?
Which are the necessary conditions for economically efficient policy making
regarding the management of the aforementioned characteristics? In order to answer
the aforementioned questions we apply economic and econometric techniques that
constitute the state of the art among the existing valuation techniques. Specifically in
this chapter we report the results of an economic valuation technique known as the
Choice Experiment Method.
Economic valuation techniques are widely applied to inform policy making
regarding decisions that involve environmental costs and benefits. These applications
of economic theory are extremely useful since they can capture and estimate the
benefits derived from the proposed policy changes. In our case, capturing the welfare
effects of flood risk reduction, biodiversity increase and recreational river access is
crucial for carrying out the appropriate cost benefit analyses to inform those projects
and policies that maximise economic efficiency. Even though the costs of policies
aimed to the aforementioned goals are relatively easy to calculate given specialized
knowledge, the estimation of their economic benefits is a challenging task. This is due
to the public good nature of improving these characteristics, since there are no
markets or market prices that could be used for the estimation of the economic
techniques, therefore, could be applied in order to estimate the economic benefits of
flood risk reduction.
In the existing literature on the valuation of flood risk reduction, a number of
non-market valuation techniques have been employed. These include the contingent
valuation method, the hedonic pricing method and the aversive behaviour method.
Shabman and Stephenson (1996) compare the results of these methods, applied to the
valuation of a flood risk reduction project in Roanoke, Virginia, USA. Brouwer and
van Ek (2004) and Brouwer et al. (2007) employ integrated impact assessment
methods to estimate the benefits of flood risk reduction in the Netherlands and
Bangladesh respectively, and conduct cost benefit analyses for various flood
alleviation projects. Ragkos et al. (2006) employ the contingent valuation method to
estimate the value of flood control for the Zazari-Cheimaditida Wetland in Greece.
This chapter is organized as follows: in section 2 we discuss the case study
area. In section 3 we briefly present the a non-market valuation method, namely the
choice experiment method that was applied in this case study. In section 4 we
describe the survey used while sections 5 and 6 report the results. Section 7 concludes
the paper with the policy implications.
2. The case study area
The case study reported in this chapter presents the results of a choice
experiment carried out in the city of Sosnowiec with the purpose of estimating the
benefits to be gained from flood risk reduction, biodiversity increase and
improvement of recreational river access. The city of Sosnowiec is located in the
industrial center located within the Upper Silesian Coal Basin. There are five rivers
(Biala, Brynica, Jaworznik, Wielonka and Rawa) running through the wider area,
making the region susceptible to flooding episodes
Among the main economic activities in the area are heavy industry and mining
with some of the world’s largest bituminous coalmines located in the region. The
mines are concentrated close to the rivers, changing and eroding the riverbanks.
Mining activities have been taking place in this area for over two centuries. Scientific
evidence from Central Mining Institute, Silesian University, AGH University of
Science and Technology, and Krakow University of Technology claim that mining
industry has significantly deformed the local landscape and the riverbed, thereby
rendering the region extremely vulnerable to floods even after light rainfalls. Given
the size of the local communities, it is estimated that approximately 50,000
individuals may suffer the effects of a flood episode.
In 1992 the Polish government facilitated the construction of concrete barriers
on the rivers’ banks in order to minimize the risk of flooding in the region. Mining
industries were deemed responsible for protecting their mines by constructing spoil
hips on the rivers’ banks. This strategy, however, was not successful since it increased
the speed of flowing water, thereby generating negative externalities for downstream
communities. Moreover, recreational activities in the catchment became limited as a
result of the blocking of the river access by the concrete barriers. Furthermore this
policy was not successful in providing flood control as the extensive floods of 1997
and 2002 can attest.
The high economic and social costs of flooding episodes are borne mainly by
the local residents, but also by the overall national economy, as well as by the nearby
led to the creation of new wetland habitats that harbor important biodiversity riches in
both flora and fauna species. Ecologists from Silesian University recognise these
biodiversity riches and assert that they should be conserved.In addition, these habitats
created by the overflown rivers are now of high recreational value and could
potentially serve as attractive tourism location. A second aim of this choice
experiment is therefore to investigate the local residents’ valuation of the conservation
of the biodiversity found in these habitats and also accessibility to the riverbanks to
enjoy recreational activities in the area.
3. The Choice Experiment Method
In this section we briefly describe the theory underlying the choice experiment
method and its applications. The choice experiment method has its theoretical
grounding in Lancaster’s model of consumer choice (Lancaster, 1966), and its
econometric basis in random utility theory (Luce, 1959; McFadden, 1974).
Lancaster’s model of consumer choice proposed that consumers derive satisfaction
not from goods themselves but from the attributes they provide. That is, a consumer
that wants to buy a coat does not derive utility directly form the coat itself but from its
constituent characteristics or attributes (like fabric, colour etc). Furthermore, when
choosing among coats, the consumer will actually compare these characteristics in
order to make a choice. In our case then the benefits from a river management
strategy are derived by flood risk levels, biodiversity levels and river access levels. In
the same fashion, when the consumer is called to choose among different river
management strategies, he will compare among these attributes in order to choose his
tax level, tax rate) then the researcher can estimate the Willingness to Pay (WTP) of
the individual for the other attributes. The WTP is the measure of value used for the
attributes in question.
The random utility theory is the theoretical basis for integrating behaviour
with economic valuation in the choice experiment method. According to random
utility theory, the utility of a choice is comprised of a deterministic component and a
random component which is independent of the deterministic part and follows a
predetermined statistical distribution. According to the theory, the deterministic
component can be observed by the researcher and depends on the characteristics of
the good. However, the random component implies that predictions cannot be made
with certainty. Choices made between alternatives will be a function of the probability
that the utility associated with a particular wetland management optionis higher than
those for other options.
As already mentioned, the choice experiment method is a non-market
valuation method. That is, the choice experiment method tries to circumvent the
absence of markets and market prices for the goods to be valued by creating a
hypothetical market in which it asks individuals to participate. The hypothetical
market is created in the context of a carefully worded scenario which describes the
market and its workings in the respondents. The choice experiment method is also a
stated-preference method. In practice this amounts to asking individuals to make
choices among different management strategies in a specially designed survey. The
data collected by the method can then be analyzed using appropriate econometric
techniques to estimate the effects of attributes on individual choice and the WTP for
4. Survey Design and Administration
As indicated earlier, the choice experiment method is a stated preference method.
That is, the choice experiment method derives the data for the estimation of the
economic benefits from specifically designed surveys. In this section we describe the
design of the survey as well as the procedure undertaken for the data collection.
The first step in choice experiment design is to define the environmental good
to be valued in terms of its attributes and their levels. It is essential to identify the
attributes that the public considers important regarding the proposed policy change, as
well as those levels that are achievable with and without the proposed policy change.
The good to be valued in this choice experiment study is the river management
strategy. Following discussions with scientists from the Central Mining Institute, the
Silesian University, the AGH University of Science and Technology and the Krakow
University of Technology, and drawing on the results of focus group discussions with
the local population, three attributes were chosen: surface and underground flooding
risk, biodiversity found in the habitats and access to the river. All three of these
attributes were specified to have two levels. The payment vehicle was a percentage
change in the local taxes paid by the households. Percentage change on the
household’s present level of tax level was preferred over fixed changes in the tax
levels, since the former allows for a continuous monetary variable. Furthermore,
higher and lower tax levels than the status quo level were considered in order to
understand whether the households are willing to pay to have higher/lower levels of
these attributes or willing to accept compensation to let go higher/lower levels of
since households may have the incentive to free-ride with the latter (Whitehead,
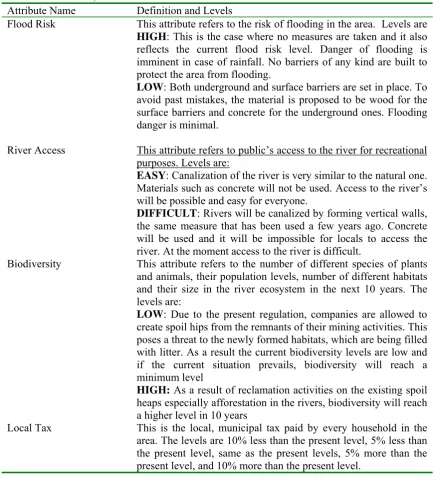
2006). Table 1 defines the attributes, their levels and the status quo.
Table [1] Here
A large number of unique river management strategies can be constructed using these
attributes and their levels. Using experimental design techniques (Louviere et al.,
2000) an orthogonalization procedure was used that resulted in 32 pairwise
comparisons of river management strategies. These were randomly blocked into four
versions, each containing eight choice sets consisting of two river management
strategies and an opt-out alternative, which represented the status quo. Inclusion of the
status quo or another baseline scenario is important for the welfare interpretation of
the estimates and for their consistency with demand theory (Louviere et al., 2000;
Bennett and Blamey, 2001; Bateman et al., 2003).
The choice experiment survey started with the enumerators reading a
statement identifying the current issues in the area regarding flood risk, biodiversity
conservation and use of the river for recreational activities. Subsequently the
households were presented with a description of the attributes used in the experiment
and were asked to state their preferred river management strategy among three such
strategies through eight choice sets. Figure 1 presents an example of a choice set.
Figure [1] Here
The choice experiment survey was implemented in March and April 2007 in
the city of Sosnowiec, located in the Bobrek catchment, with in house face-to-face
interviews. Time and budget constraints allowed for a sample of 200 households from
the local population. A quota sample was collected and the survey was administered
distribution (i.e., distance from the river). Those household members who took part
in the survey were by and large those who were main household decision makers
and/or heads of the households. In total 96 percent of those approached, i.e., 192
households were interviewed, resulting in1536 choices.
In addition to the choice experiment, the survey also collected social,
demographic and economic data, including the respondents’ age, gender, education,
household income and local tax paid by the household, as well as information on
whether the household uses the river for recreational activities and flooding episodes
that have effected the household in the past decade. Descriptive statistics for the key
variables are presented in Table 2.
Table [2] Here
The average respondent is 46 years old while 51.5% of the sample is female. 46.3% of
the respondents are in full time employment. Regarding the educational level, 26%
have university or higher education. The average household consists of 2.8 persons
while it is located at 462 meters from the river bank. 70.8% of the households have at
least one child. Among the households that were interviewed, 13% were flooded in
the past decade while these households were flooded on average of 2.52 times over
the last decade,
5. Results
The data for econometric analysis were coded according to the levels of the attributes.
Attributes with two levels (i.e., flood risk, biodiversity level, river access) entered the
utility function as binary variables, effects coded as 1 to indicate low level of flood
flood risk, low level of biodiversity and difficult river access (Adamowicz et al.,
1994; Louviere et al., 2000). The attribute with five levels (i.e., percentage increase in
local tax) was entered in cardinal-linear form, and then multiplied by the households’
actual level of local tax, in order to calculate the level of this attribute for each
household. Since this choice experiment involves generic instead of labelled options,
the alternative specific constants (ASC) were set equal to 1 when either river
management strategy A or B was chosen and to 0 when the households chose the
status quo (Louviere et al., 2000). A relatively more positive and significant ASC
indicates a higher propensity for households to take no action to manage the river.
Retaining the assumption that observable utility function follows a strictly
additive form, a conditional logit model for the choice of river management strategy
was estimated using LIMDEP 8.0 NLOGIT 3.0. The model was specified so that household choice was only affected by the ASC and the four attributes of the choice
experiment. The results of the conditional logit model for the pool of 192 households
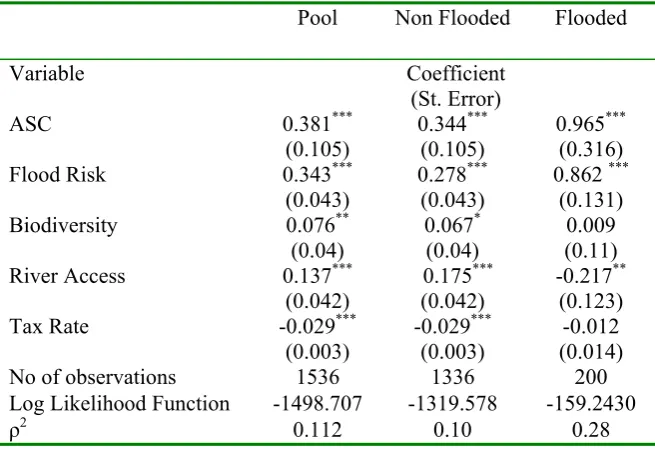
are reported in first column of Table 3.
Table [3] Here
The results in Table 3 indicate that all attributes are highly significant
determinants of river management strategy choice for the pooled sample.
Furthermore, the estimated coefficients have the expected signs. These indicate that
households prefer low flood risk, high biodiversity and easy river access. Consistent
with demand theory, the coefficient of the monetary attribute is negative indicating
that households choose alternatives with lower tax rates to alternatives with higher tax
rates. The positive and significant alternative specific constant captures other factors
affecting choice that are not included in the model and can also be interpreted as an
In order to further examine the behaviour of different groups of households
and subsequently to estimate their valuation of each one of the attributes, split sample
conditional logit models were estimated for the following two household types: (i)
non-flooded in the past ten years and (ii) flooded in the past ten years. These are
reported in columns 2 to 3 of Table 3.
Statistical tests indicate that the impacts of attributes on the choices of flooded
and non-flooded households are different. Hence flooded and non-flooded households
have distinct preferences for river management attributes. For those households
whose houses have not been flooded all of the river management attributes are
significant determinants of river management strategy choice. They prefer those river
management strategies, which provide low flood risk, high levels of biodiversity and
easy access to the river. The sign on the coefficient on the monetary attribute is
negative as expected a priori. Coefficient on the flood risk attribute is the largest in
magnitude, implying that this is the most important determinant of choice for the
household. This is followed by river access and biodiversity. For those households
whose houses were flooded at least once in the past ten years, flood risk reduction and
water access are significant determinants of river management strategy choice. These
households prefer those river management strategies with low flood risk, however
with difficult river access. Their valuation of the biodiversity attribute as well as the
coefficient of the monetary attribute are statistically insignificant, the latter possibly
due to the small size of this sub sample.
6. WTP Estimates
Using the estimates reported earlier we can calculate the increase in welfare derived
WTP which is the measure of welfare applied by economists when valuing
non-marketed goods.
Table 4 reports the estimated marginal WTP for each river management
strategy attribute for the pool and for the two household types introduced in the
previous section.
Table 4 Here
As revealed by the WTP estimates for the pooled sample, on average
households are WTP significant positive amounts for improving all attributes. They
are WTP the highest in order to reduce the risk of flooding to a low level, their WTP
for easy river access is less than half of their WTP for low flood risk, whereas their
WTP for high levels of biodiversity is less than quarter of their WTP for low flood
risk. Across the household types, ranking of the attributes, as well as households’
valuation of these differ significantly. Flooded households are WTP highest for low
flood risk, however their valuation is insignificant. These households are followed by
non-flooded households. High biodiversity levels and easy access to the river are
valued most highly by non-flooded households, whereas for flooded households’
WTP are insignificant. This indicates that the ecological and recreational aspects of
the problem are valued more by households that have not been flooded in the past.
This is intuitive since for households that have been flooded in the past may be
relatively more concerned with avoiding further floods.
5. Policy implications
Following the flooding episodes of 1997 and 2004 the Polish authorities embarked on
choice experiment method introduced in this chapter focused on the estimation of the
benefits that the local population derives from the reductions of flood risk in the area.
Furthermore, we explored the welfare implications of improving biodiversity and
recreational river access.
The results presented reveal that there are significant welfare improvements
from flood risk reduction, which dominate welfare improvements from both
improving river accessibility for recreational reasons and conserving high levels of
biodiversity. This can be translated as the locals’ preferences for use values derived
from flood reduction relative to use and non-use values from recreation or
biodiversity conservation. Aggregation over the population of Sosnowiec shows that
local residents are willing to incur an increase in local taxation of 2,693,416 zloty per
year to reduce flood risk.
In order to evaluate whether reducing flood risk and improving the other
attributes is an economically efficient option, it is important to appropriately compare
between the costs and benefits of the proposed policy measures. The economic
literature has developed an important instrument for this purpose, the Cost Benefit
Analysis. In broad terms, under a Cost Benefit Analysis the aggregate increase in
welfare is compared with the overall increase in costs through time. If the aggregated
benefits over time exceed the aggregated costs over time then the project is
considered to be economically meaningful. Thus, in order to fully evaluate the net
benefit of improving river management, it is necessary in a latter stage to perform a
References
Bateman, I.J., Carson, R.T., Day, B., Hanemann, W.M., Hanley, N., Hett, T.,
Jones-Lee, M., Loomes, G., Mourato, S., Ozdemiroglu, E., Pearce, D.W., Sugden,
R., Swanson, S., 2003. Guidelines for the Use of Stated Preference
Techniques for the Valuation of Preferences for Non-market Goods, Edward
Elgar, Cheltenham.
Bennett, J.J., Blamey, R.K., 2001. The Choice of Modelling Approach to
Environmental Valuation, Edward Elgar Publishing Limited, Cheltenham.
Brakenridge, G.R., Anderson, E., Caquard, S., 1997, Flood Archive table 1997,
Dartmouth Flood Observatory, Hanover, USA, digital media,
Brakenridge, G.R., Anderson, E., Caquard, S., 2001, Flood Archive table 2001,
Dartmouth Flood Observatory, Hanover, USA, digital media,
Brouwer, R., van Ek, R. 2004. Integrated ecological, economic and social impact
assessment of alternative flood control policies in the Netherlands.
Ecological Economics 50:1-21
Brouwer, R., Akter, S., Brander, L., Haque, E. 2007. Socioeconomic Vulnerability
and Adaptation to Environmental Risk: A Case Study of Climate Change and
Flooding in Bangladesh. Risk Analysis, 27: 313-326
Carlsson, F., Frykblom, P., Liljenstolpe, C., 2003. Valuing wetland attributes: an
application of choice experiments. Ecological Economics 47: 95-103.
Greene, W.H., 1997. Econometric Analysis. Fourth Edition, Prentice Hall.
Hanley, N., Wright, R., Adamowicz, W., 1998. Using Choice Experiments to Value
the Environment. Environmental and Resource Economics. 11(3-4),
413-428.
Hensher, D., Rose, J., Greene, W., 2005. Applied Choice Analysis: A Primer.
Cambridge University Press
Lancaster, K., 1966. A new approach to consumer theory. Journal of Political
Economics 74, 217–231.
Louviere, J.J., Hensher, D. Swait, J., Adamowicz, W., 2000. Stated Choice Methods:
Analysis and Applications. Cambridge University Press, Cambridge.
Luce, D. 1959. Individual Choice Behaviour, John Wiley, New York, NY.
Maddala, G.S., 1999. Limited Dependent and Qualitative Variables in Econometrics,
McFadden, D., 1974. Conditional logit analysis of qualitative choice behavior. In: P.
Zarembka, Editor, Frontiers in Econometrics, Academic Press, New York.
Nicholls, R.,J., Hoozemans F., Marchand, M. 1999. Increasing flood risks and
wetland losses due to global sea-level rise: regional and global analyses. Global
Environmental Change 9: S69-S87
Whitehead, J.C., 2006. A practitioner's primer on contingent valuation. In: Alberini,
A., Kahn, J. (Eds.), Contingent Valuation Handbook. Edward Elgar Publishing,
Cheltenham, U.K.
Tables and figures
Figure 1. Example choice set
one would you prefer? Management strategy Characteristics Management strategy A Management strategy B Neither Management strategy: Status Quo
Flood risk Low Low High
Biodiversity Low High Low
River access Difficult Easy Difficult
Council tax 5% decrease 5% decrease Same as now
I prefer
(Please tick as appropriate)
[image:18.595.93.546.74.189.2]Management strategy A Management strategy B Neither management strategy
Table 1: Attributes, Levels and their Definitions
Attribute Name Definition and Levels
Flood Risk This attribute refers to the risk of flooding in the area. Levels are HIGH: This is the case where no measures are taken and it also reflects the current flood risk level. Danger of flooding is imminent in case of rainfall. No barriers of any kind are built to protect the area from flooding.
LOW: Both underground and surface barriers are set in place. To avoid past mistakes, the material is proposed to be wood for the surface barriers and concrete for the underground ones. Flooding danger is minimal.
River Access This attribute refers to public’s access to the river for recreational purposes. Levels are:
EASY: Canalization of the river is very similar to the natural one. Materials such as concrete will not be used. Access to the river’s will be possible and easy for everyone.
DIFFICULT: Rivers will be canalized by forming vertical walls, the same measure that has been used a few years ago. Concrete will be used and it will be impossible for locals to access the river. At the moment access to the river is difficult.
Biodiversity This attribute refers to the number of different species of plants
and animals, their population levels, number of different habitats and their size in the river ecosystem in the next 10 years. The levels are:
LOW: Due to the present regulation, companies are allowed to create spoil hips from the remnants of their mining activities. This poses a threat to the newly formed habitats, which are being filled with litter. As a result the current biodiversity levels are low and if the current situation prevails, biodiversity will reach a minimum level
HIGH: As a result of reclamation activities on the existing spoil heaps especially afforestation in the rivers, biodiversity will reach a higher level in 10 years
Local Tax This is the local, municipal tax paid by every household in the
[image:18.595.80.517.254.739.2]Socioeconomic Variables Sample Mean Population Average Respondent characteristics
Age (in years) 46 37.3**
% in full time employment 46.3
% of female 51.5 51.5*
% with a University degree 26
Household characteristics
Household size 2.8
Distance from the river in meters 462 -
Local tax (in zloty) paid by the household 183.9
Monthly gross household income (in zloty) 2478.1 1175
% of Households with at least one Child 70.8
Number of children living in households with children 0.9
% own a car 64.5
% visited the wetland 54.6 -
% houses flooded 13
% flooded households that were compensated by the government, insurance company or mining industry
28 Number of flood episodes flooded households suffered in
the last decade
2.52 Total damages to the household from floods in the last
decade (in zloty)
7115.8
[image:19.595.93.512.85.373.2]*World bank gender Statistics ** CIA World Factbook
Table 3. Conditional Logit Model Results for pool, non-flooded, flooded, user and non-user households
Pool Non Flooded Flooded
Variable Coefficient (St. Error)
ASC 0.381***
(0.105)
0.344*** (0.105)
0.965*** (0.316)
Flood Risk 0.343***
(0.043)
0.278*** (0.043)
0.862 *** (0.131)
Biodiversity 0.076**
(0.04)
0.067* (0.04)
0.009 (0.11)
River Access 0.137***
(0.042)
0.175*** (0.042)
-0.217** (0.123)
Tax Rate -0.029***
(0.003)
-0.029*** (0.003)
-0.012 (0.014)
No of observations 1536 1336 200
Log Likelihood Function -1498.707 -1319.578 -159.2430
ρ2 0.112 0.10 0.28
***
1% significance level; ** ; 5% significance level, and * 10% significance level with two-tailed tests.
[image:19.595.134.462.430.655.2]Attribute Pool Non-Flooded Flooded
Flood Risk 23.9***
(20.6-27.4)
19.6*** (15.9-22.4)
140 (-16-296)
Biodiversity 5.3***
(2.8-7.8)
4.8** (2.1-7.5)
0.8 (-15.82-19.02)
River Access 9.6***
(7.1-12.1)
12.1*** (9.4-14.7)
-34.2 (-85.4--16.9) ***