Journal of Chemical and Pharmaceutical Research, 2017, 9(4):82-91
Research Article
CODEN(USA) : JCPRC5
ISSN : 0975-7384
82
Development of Fast Dissolving Sublingual Wafers by Using Film Former:
Optimization and Characterization
Upendra C Galgatte
*, Pooja P Patil and Pravin D Chaudhari
Department of Pharmaceutics, P. E. Society’s, Modern College of Pharmacy, Sector no.21, Yamunanagar, Nigdi, Pune, Maharashtra, India
_____________________________________________________________________________
ABSTRACT
The aim of the present research work was to develop, optimize and evaluate fast dissolving sublingual wafer of Tamsulosin hydrochloride using film former by solvent casting technique to treat benign prostatic hyperplasia. The xanthan gum, a natural polymer along with cross carmellose sodium as a super disintegrant and polyethylene glycol 400 as a plasticizer were used for forming sublingual wafer. The prepared film was evaluated for mechanical properties like percent elongation and tensile strength, weight variation, thickness, disintegration time, drug content, pH, folding endurance and in vitro drug release. Formulations were optimized by 32 factorial design. Drug loaded sublingual wafers of size 2 cm 1.5 cm exhibited folding endurance of 210 ± 0.547, disintegration time 20 ± 0.577 seconds, tensile strength 27.33 ± 0.325 dyne/cm2and drug release of 101.88% at the end of 20 seconds. The optimized formulation of film was characterized by DSC and PXRD. Multicrystalline nature of drug was observed in pure drug sample whereas crystalline nature was observed in optimized formulation. Drug release was observed to follow Korsmeyer peppas model of kinetics with R2 value 0.996 and fickian diffusion. Surface and contour plots were also studied for dependent variables. In the accelerated stability study of one month no significant difference in disintegration time, tensile strength and drug release was found.
Keywords: Film former; Solvent casting technique; Tamsulosin hydrochloride; Xanthan gum
_____________________________________________________________________________
INTRODUCTION
83
MATERIALS AND METHODS
Materials
Tamsulosin hydrochloride was obtained as a gift sample from Wockhart Pvt Ltd, Aurangabad, India. Xanthan gum was purchased from Balaji Drugs, Gujarat, India. Fast dissolving oral sublingual wafers were prepared by using film former with polyethylene glycol 400 as plasticizer. All other chemicals were of analytical grade.
Methods
Characterization of drug and excipient:
Fourier-transform infrared spectroscopy (FT-IR): Drug sample was characterized by FTIR spectroscopy. The spectrum was recorded using potassium bromide (KBr) with Tamsulosin hydrochloride-KBr mixture triturated in ratio 1:300 respectively by using FTIR spectrophotometer (Jasco MV 4100). The scanning range was 4000 to 600 cm-1. The spectrum was compared with the reported functional group of drug structure [10]. The same was done for xanthan gum.
Differential scanning colorimetry (DSC): The DSC thermogram of Tamsulosin hydrochloride was recorded using differential scanning colorimeter (DSC 1, Mettler Toledo, Japan). Approximately 2-5 mg of sample was heated in a pierced aluminium pan (Al-Crucible, 40 Al) from 30-300°C at a heating rate of 10°C/min under a stream of nitrogen at flow rate of 50 ml/min. Thermal data analysis of the DSC thermogram was conducted using STARe Software (version 5.21).
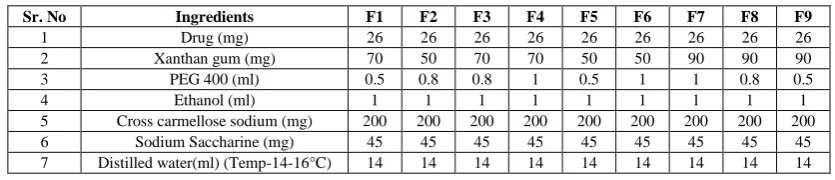
[image:2.595.88.506.438.528.2]Preparation of sublingual wafers by solvent casting technique: A 14 ml solution of xanthan gum, polyethylene glycol 400 (PEG 400), cross carmellose sodium as super disintegrant, ethanol and sodium saccharine was made by solvent casting technique with ice cold distilled water and sublingual wafers were prepared. Drug solution was sonicated for 30-45 min to solubilize the drug completely in the solvent. Drug solution was poured into polymeric solution and ethanol was added for alkaline hydrolysis. Both solutions are uniformly mixed to get a homogeneous solution on magnetic stirrer at 250-320 rpm. Then this solution was spread on film former by adjusting the desired temperature. Once the wafer sheet was ready, it was cut into desired size of 1.5 cm 2 cm was dried and was removed with help of spatula and dried in oven if required. The composition of sublingual wafers is given in Table 1.
Table 1:Composition of fast dissolving sublingual wafers of tamsulosin hydrochloride
Sr. No Ingredients F1 F2 F3 F4 F5 F6 F7 F8 F9
1 Drug (mg) 26 26 26 26 26 26 26 26 26 2 Xanthan gum (mg) 70 50 70 70 50 50 90 90 90 3 PEG 400 (ml) 0.5 0.8 0.8 1 0.5 1 1 0.8 0.5
4 Ethanol (ml) 1 1 1 1 1 1 1 1 1
5 Cross carmellose sodium (mg) 200 200 200 200 200 200 200 200 200 6 Sodium Saccharine (mg) 45 45 45 45 45 45 45 45 45 7 Distilled water(ml) (Temp-14-16°C) 14 14 14 14 14 14 14 14 14
Evaluation Parameters for Oral Sublingual Wafers Mechanical properties:
Mechanical properties of the films were evaluated using tinius olsen tensile tester (model-T-138B).
Tensile strength:
It is the maximum stress applied to a point at which the sublingual wafer specimen breaks. It is calculated by the applied load at rupture and then divided by the cross‐sectional area of the strip as given in the equation below: [11]
Tensile strength = Load at Failure × 100/ (wafer thickness × wafer Width)
Percent elongation:
When the stress is applied, a wafer sample stretches and this is referred to as strain. Strain is basically the deformation of wafer divided by original dimension of the sample. Generally elongation of strip increases as the plasticizer content increases [12].
% Elongation = Increase in length of strip × 100/ Initial length of strip
Thickness of the film:
84
Weight variation of the film:
To determine weight of each sublingual wafer of an area of 1.5 cm 2 cm was cut from different locations of sublingual wafer and was weighed on electronic pan balance. Average of 20 wafers was calculated.
Folding endurance:
The folding endurance was determined by repeatedly folding one sublingual wafer at the same place till it broke. The number of times the wafer could be folded at the same place without breaking gives the value of the folding endurance [14].
pH of wafer:
The wafer to be tested was placed in a Petri dish and was moistened with 0.5 ml of distilled water. The pH was noted after bringing the electrode of the pH meter in contact with the surface of the formulation and kept for 1 min to allow equilibrium condition and the reading on the pH meter was noted [15,16].
In vitro disintegration time:
Disintegration time is the time when a wafer breaks or starts to disintegrate. A wafer of 1.5 cm 2 cm was cut and was put in the beaker containing 50 ml distilled water. The time when sublingual wafer was completely disintegrated noted as disintegration time. The standard value for disintegration time is within 1 min for fast mouth dissolving wafer [17,18].
Drug content:
A wafer of 1.5 cm 2 cm was cut and put into 100 ml phosphate buffer of pH 6.8 and was continuously stirred at rpm 400-500 for about an hour. After an hour stirring was stopped and content was transferred to 10 ml volumetric flask and absorbance was measured in UV-Visible spectrophotometer [19]. The absorbance was noted above 1 µg/ml it was further diluted with phosphate buffer pH 6.8 at 224 nm and reading was noted.
In-vitro drug release:
In vitro dissolution study was done using phosphate buffer pH 6.8 of 900 ml using paddle apparatus II. Film of size 1.5 cm 2 cm was cut and put into the dissolution chamber and rotations per minute was set to 50 and temperature of 37 ± 2ºC. Sampling was done for 5 minutes at interval of 0, 10, 15, 20, 25, 30, 45 seconds. The solution so withdrawn was filtered. Absorbance was measured on UV spectrophotometer at 224 nm [20-22].
Differential scanning colorimetry (DSC):
The DSC thermogram of optimized formulation was recorded using Differential scanning colorimeter (DSC 1, Mettler Toledo, Japan). Approximately 2-5 mg of sample (i.e., optimized formulation) was heated in a pierced aluminium pan (Al-Crucible, 40 Al) from 30-300°C at a heating rate of 10°C/min under a stream of nitrogen at flow rate of 50 ml/min. Thermal data analysis of the DSC thermogram were conducted using STARe Software (version 5.21).
Powder X-ray diffraction analysis (XRD):
For XRD drug sample and optimized formulation was studied using X-ray diffractometer. The optimized formulation was subjected to powder XRD. To study X-Ray diffraction pattern, the sample was placed into aluminium holder and the instrument was operated between initial and final 2θ angle of 3-80°respectively in an increment of 2θ.
RESULTS AND DISCUSSION
Characterization of Drug and Excipients Fourier transform infrared spectroscopy:
85
Figure 1: FT-IR of tamsulosin hydrochloride
Figure 2: FT-IR of xanthan gum
Figure 3: FT-IR of physical mixture
Pure tamsulosin hydrochloride spectrum showed sharp characteristic peaks at 2981 cm-1 (-C-H stretching), at 2025 cm-1 (C=C), 3307 cm-1 (S-N) and 1337 cm-1 (-SO2 group). FTIR spectra of tamsulosin hydrochloride and its physical mixture (Figure 3) with excipients showed the same characteristic bands of the drug in the same regions and at the same ranges, indicating that there was no interaction between the drug and excipients used [23]. DSC thermo gram of Tamsulosin hydrochloride as shown in Figure 4 indicates sharp endothermic peak Tp (temperature of peak) at 233ºC (Actual melting point 228ºC) corresponds to the melting point of Tamsulosin hydrochloride [24,25].
Evaluation of Sublingual Wafers Mechanical properties:
86
Figure 4: DSC of tamsulosin hydrochloride
Figure 5: Average tensile strength of different formulations (F1-F9)
[image:5.595.146.454.434.564.2]Percent elongation: The wafer of area 2 cm 1.5 cmwas taken for carrying out percent elongation. It was seen that as concentration of plasticizer PEG 400 increases the value of percent elongation aslo increases. Formulation F8 has 19.80 ± 0.304 value of percent elongation whereas formulation F5 has lowest value which is 7.57 ± 0.678. Percent elongation of all formulations is shown in Figure 6.
Figure 6: Average percent elongation of different formulation (F1-F9)
Thickness: The thickness of the drug loaded sublingual wafers from F1 to F9 formulations were measured with the help of vernier caliper at different strategic locations like four corners and centre of the each wafers. Mean SD was calculated. Thickness should be controlled within a ± 5% variation of standard value. The thickness of wafer varies from formulation F1 0.08 ± 0.0130 mm to formulation F9 0.128 ± 0.027 mm as statesd in Table 2. Formulation F8 was having the thickness of 0.146 ± 0.013 mm which was good. From above data it was concluded that thickness of wafer increases as concentration of xanthan gum increases.
87
[image:6.595.73.536.140.248.2]Folding endurance: The wafer of size 1.5 cm 2 cm was repeatedly folded at the same place until it breaks and the number of time the sublingual wafer could be folded without breaking was noted as folding endurance of the wafer. The value of folding endurance from 189±0.816 for formulation F1 to 212±0.547 for formulation F9 as mentioned in Table 2.
Table 2: Apperance, weight veriation, thickness and folding endurance of factorial batches ( mean ± S.D)
Formulation Code Appearance(n=3) Thickness (n=5) (mm) Weight Variation (n=5) Folding endurance (n=5)
F1 Semitransparent, smooth, thin 0.08 ± 0.0130 16.314 ± 0.163 189 ± 0.816 F2 Thin, smooth, semitransparent 0.078 ± 0.016 13.184 ± 0.129 158 ± 0.836 F3 Semitransparent, thin, smooth 0.076 ± 0.020 15.546 ± 0.101 183 ± 1.303 F4 Smooth, thin,Semintransparent 0.113 ± 0.0130 14.360 ± 0.108 190 ± 0.894 F5 Thin, smooth, semitransparent 0.027 ± 0.083 13.394 ± 0.101 165 ± 0.707 F6 Smooth, thin, Semintransparent 0.06 ± 0.0158 12.584 ± 0.149 168 ± 0.836 F7 Semitransparent, thin, smooth 0.116 ± 0.013 18.344 ± 0.080 198 ± 1.30 F8 Smooth, thin, Semintransparent 0.146 ± 0.013 22.402 ± 0.2959 210 ± 0.547 F9 Thin, smooth, Semitransparent 0.128 ± 0.027 20.448 ± 0.216 212 ± 0.547
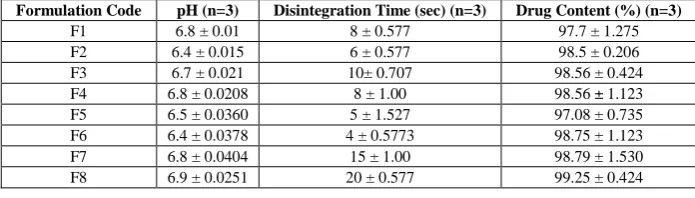
pH of the wafer: As shown in Table 3 pH value lies betweenformulation F1 6.8 ± 0.01 to formulation F9 6.8 ± 0.0264. The pH value for formulation F8 batch is 6.9 ± 0.0251 which was in the pH range of saliva 6.5 to 7.5 which is suitable for sublingual wafer to dissolve and release medicament.
[image:6.595.151.445.412.538.2]In vitro disintegration time: Disintegration time was calculated by dropping the wafer in 25 ml beaker containing distilled water and time when the wafer was completely disintegrated was noted. The faster is disintegration of wafer faster will be the release which may help to achive faster onset of action. The disintegration time for formulation F1 was 8 ± 0.577 seconds to formulation F9 17 ± 0.573 seconds as performed and presented in Figure 7. The F8 batch has disintegration time of 20 ± 0.577 sec which is feasible. These values are mentioned in Table 3. From all results below it can be conlcluded that as the polymer concentration increases the disintegration time of the sublingual wafer also increases. The decrease in disintegration time was due to swelling of polymer as ice cold solution distilled water was used while preparing homogeneous solution for peparing sublingual wafers.
Figure 7: Average disintegration time(sec) of formulations (F1-F9)
Drug content: Drug content of factorial batches was calculated by using wafer containing 26 mg of Tamsulosin hydrochloride. Three trials from each formulation were analyzed spectrophotometrically. The mean value and standard deviation of all the formulations were calculated. Drug content of all batches, F1 to F9, was found in the range of 97.7 ± 1.275% - 99.25 ± 0.424%. The limit for specification is within the range 98.5%-101.5%. Formulation F1 and F5 are not within the limit. But Formulation F1 has drug content of 97.7 ± 1.275 and formulation F5 has 97.08 ± 0.735 as shown in Table 3. It shows that higest amount of drug is incorporated in F8 formulation. Hence, only formulation F1 and F5 do not comply with the standard drug content and rest all formulations are in the range [10,24].
Table 3: pH, disinteragation time and drug content of factorial batches(mean ± S.D)
Formulation Code pH (n=3) Disintegration Time (sec) (n=3) Drug Content (%) (n=3)
[image:6.595.123.471.669.768.2]88
F9 6.8 ± 0.0264 17 ± 0.573 98.78 ± 0.849
[image:7.595.157.438.153.293.2]In-vitro drug release: In vitro dissolution studies were performed using phosphate buffer pH 6.8 as dissolution medium and dissolution apparatus USP Type-II (Paddle type) at 75 rpm and temperature of 37.5 ± 2ºC, to compare the release of drug from different formulations (F1-F9). By comparing all the formulations, it was concluded that formulation F8 showed the highest drug release and hence was selected as the best formulation (Figure 8). Formulation F8 showed maximum drug release of 101.88% at 20 seconds which was within the range [25,26]. In vitro drug release of all formulations is shown in Table 4.
[image:7.595.106.492.324.444.2]Figure 8: Graph of % cummulative drug release Vs time in seconds
Table 4: Percent cummulative drug release of factorial batches (mean ± S.D)
Formulation code Time
5 seconds 10 seconds 15 seconds 20 seconds 25 seconds 30 seconds
F1 19.85 ± 0.01 26.47 ± 0.01 59.55 ± 0.02 86.02 ± 0.35 105.8 ± 0.09 79.41 ± 0.08 F2 6.61 ± 0.09 33.08 ± 0.07 52.94 ± 0.05 72.79 ± 0.01 92.64 ± 0.03 39.70 ± 0.05 F3 26.47 ± 0.02 52.94 ± 0.07 79.41 ± 0.04 92.64 ± 0.01 125.7 ± 0.08 86.02 ± 0.09 F4 26.47 ± 0.02 52.94 ± 0.07 86.02 ± 0.04 92.64 ± 0.06 112.5 ± 0.09 46.32 ± 0.02 F5 19.85 ± 0.06 26.47 ± 0.09 39.70 ± 0.03 79.41 ± 0.06 92.64 ± 0.02 112.5 ±0.02 F6 13.23 ± 0.02 39.70 ± 0.03 52.94 ± 0.01 79.41 ± 0.01 92.64 ± 0.08 99.26 ± 0.02 F7 19.85 ± 0.09 33.08 ±0.06 52.94 ± 0.08 79.41 ± 0.07 92.6 ± 0.04 105.8 ± 0.05 F8 46.23 ± 0.01 66.17 ± 0.08 86.02 ± 0.03 101.8 ±0.04 119.1 ± 0.03 45.66 ± 0.03 F9 6.61 ± 0.07 46.32 ± 0.08 79.45 ± 0.01 99.26 ± 0.09 52.94 ± 0.05 26.47 ± 0.06
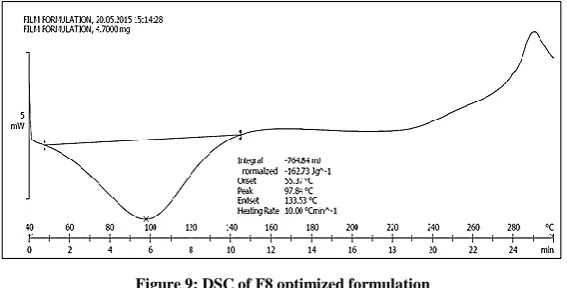
DSC: Differential scanning colorimetric Spectra allows us to check the incompatibilities and shift in endotherm and exothermic peaks. DSC Spectra of optimized batch F8 is shown in the Figure 9 with peak at 97.84ºC. There was decrease in melting point of the final formulation these may be due to presence of other excipients in the solution of final formulation.
Figure 9: DSC of F8 optimized formulation
[image:7.595.156.440.502.646.2]89
Figure 10: XRD of tamsulosin hydrochloride
Figure 11: XRD of F8 optimized batch
Generation of Statistical Models
A statistical model, Y = b0 + b 1X 1 + b 2X2 + b 12X1X2 + b 1 2 X12+ b2 2 X2 2 incorporating interactive and polynomial terms was used to evaluate the responses. The data clearly indicates that the disintegration time, % drug release and folding endurance values are strongly dependent on the selected independent variables. The fitted full equations relating the responses disintegration time, % drug release and folding endurance values to the transformed factors are as:
Disintegration time = -8.42544+0.308X1-3.6842X2 % Drug Release = +28.88-0.12917X1+1.3596X2 Folding endurance = 115.144+1.0750X1-5.87719X2
Contour Plots and Response Surface Plots for Dependent Variables
If the contour plot shows the curve line it may indicate that there may be interaction in two dependant variables and if there is straight line it may indicate that there is no possible interaction between these two variables. Below Figures 12-14 shows the straight line in contour plot it may conclude that there is no interaction between these two dependant variables [24].
[image:8.595.161.438.573.702.2]From the response surface plot for disintegration time in Figure 12 it is concluded that both polymer and plasticizer are directly proportional to the disintegration time. Therefore as the concentration of polymer and plasticizer increases there will be an increase in disintegration time.
Figure 12: Response surface graph and contour plot for disintegration time
90
The concentration of polymer is mainly responsible for increase in folding endurance as seen from the surface plot in Figure 14. Also a slight variation is shown by gradually increasing the plasticizer concentration.
Figure13: Response surface graph and contour plot for drug release
Figure14: Response surface graph and contour plot for folding endurance
Statistical Analysis of Data and Interpretation
To find out which model best fitted the formulations all the models i.e. zero order kinetics, Korsmeyer peppas model, first order kinetics and Higuchi model were applied to the formulations and value of regression coefficient was obtained. From the R2 value the value which was almost near to 1 was selected as the best suitable model among the nine formulations. The value of release exponent (n) also helps to determine the drug release mechanism [27]. The R2 value for all formulations (F1-F9) for zero order kinetics, korsmeyer peppas model, first order kinetics and Higuchi model was calculated. The R2 value for korsmeyer peppas model for formulation F7 was 0.991 was found to be minimum and formulation F8 was 0.996 which was maximum. Also n value for formulation F8 following korsmeyer peppas model was calculated and it showed that it follows fickian diffusion. After applying data to the models Formulation F8 was found to be the best optimized formulation with correlation coefficient value of 0.996 and n value 1.025. Correlation of coefficient value should be almost near to 1 and if n (release exponent) <1 it follows fickian diffusion. And if n>0.5 it follows non-fickian diffusion. It is clear from above data that F8 follows Fickian diffusion and Korsmeyer peppas model is best suited for this formulation as the value of R2 is 0.996 which is approx 1. Hence release of drug from the fast dissolving oral wafer follows fickian diffusion.
Accelerated Stability Study
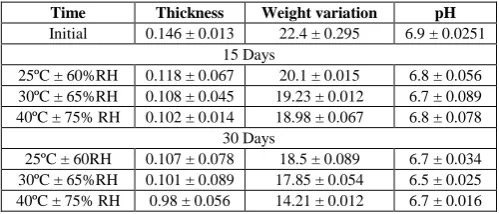
[image:9.595.173.423.657.764.2]Accelerated stability study was carried out for the optimized formulation. Sublingual wafers in triplicate forms were kept in the stability chambers at different conditions. Sublingual wafers were kept at following temperature 25ºC ± 60% RH, 30°C ± 65% RH and 40ºC ± 75% RH for one month to access their stability. At first the wafers were wrapped in aluminum foils and kept in stability chamber but they soften after 7 days. So in order to avoid the softening these wafers were wrapped in butter paper and kept in the stability chamber [28]. The results for accelerated stability study are shown in Tables 5 and 6.
Table 5: Accelerated stability study showing thickness, weight variation and pH (mean ±S.D) (n=3)
Time Thickness Weight variation pH
Initial 0.146 ± 0.013 22.4 ± 0.295 6.9 ± 0.0251 15 Days
25ºC ± 60%RH 0.118 ± 0.067 20.1 ± 0.015 6.8 ± 0.056 30ºC ± 65%RH 0.108 ± 0.045 19.23 ± 0.012 6.7 ± 0.089 40ºC ± 75% RH 0.102 ± 0.014 18.98 ± 0.067 6.8 ± 0.078
30 Days
91
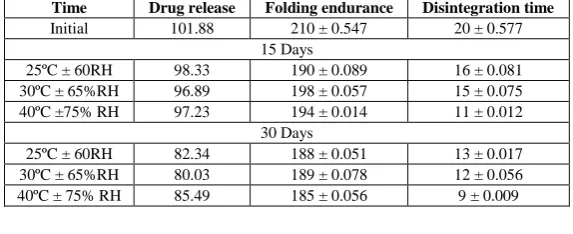
Table 6: Accelerated stability study showing drug release, folding endurance and disintegration (mean ±S.D) (n=3)
Time Drug release Folding endurance Disintegration time
Initial 101.88 210 ± 0.547 20 ± 0.577 15 Days
25ºC ± 60RH 98.33 190 ± 0.089 16 ± 0.081 30ºC ± 65%RH 96.89 198 ± 0.057 15 ± 0.075 40ºC ±75% RH 97.23 194 ± 0.014 11 ± 0.012
30 Days
25ºC ± 60RH 82.34 188 ± 0.051 13 ± 0.017 30ºC ± 65%RH 80.03 189 ± 0.078 12 ± 0.056 40ºC ± 75% RH 85.49 185 ± 0.056 9 ± 0.009
CONCLUSION
Fast dissolving sublingual wafers containing Tamsulosin hydrochloride for treatment of benign prostatic hyperplasia were developed by using film former with xanthan gum as polymer. The main hurdle to make a mouth dissolving wafers by using natural gum as polymer was tackled by adjusting the temperature of solvent to 14-16°C i.e. distilled water which helped the polymer to swell thereby the quantity of polymer required for forming sublingual wafer. It was possible to prepare sublingual wafer successfully by 32 factorial design. Therefore, the formulation F8 was found potential to develop sublingual wafers.
ACKNOWLEDGEMENT
Authors are grateful to Wockhart Pvt Ltd, India for providing tamsulosin hydrochloride as gift sample and Savitribai Phule Pune University for providing facility of X-ray diffraction study.
REFERENCES
[1] S Kalyan; M Bansal. Int J Pharm Tech Res. 2012, 4(2), 725-733.
[2] S Malke; S Shidhaye; VJ Kadam. Indian J Pharm Sci. 2007, 69(2), 211-214.
[3] N Thakur; M Bansal; S Sharma; G Yadav; P Khare. Advan Biol Res. 2013, 7(2), 50-58. [4] AR Patel; DS Prajapati; JA Raval. Int J Drug Dev Res. 2010, 2(2), 242-246.
[5] A Arya; A Chandra; V Sharma; K Pathak. Int J Chem Tech Res. 2010, 2(1), 576-583. [6] A Kumar; PK Sharma; A Ali. Int J Drug Deliv. 2013, 5(2), 344-352.
[7] MP Ratnaparkhi; AS Kadam. Eur J Biomed Pharm Sci. 2014, 1(1), 60-79. [8] R Saurabh; R Malviya; PK Sharma. Eur J Appl Sci. 2011, 3(3), 93-101. [9] P Saini; A Kumar; P Sharma; S Visht. Int J Drug Dev Res. 2012, 4(4), 80-94.
[10] Indian Pharmacopoeia, The Indian Pharmacopoeia Commission Ghaziabad, 2007, 3, 1378-1379. [11] R Bala; P Pawar; S Khanna; S Arora. Int J Pharm Invest. 2013, 3(2), 67-76.
[12] BP Panda; NS Dey; MEB Rao. Int J Pharm Sci Nanotech. 2012, 5(2), 1666-1674. [13] N Narang; S Sharma. Int JPharm Pharm Sci. 2011, 3(2), 18-22.
[14] B Bhyan; S Jangra; M Kaur; H Singh. Int J Pharm Sci Rev Res. 2011, 9(2), 50-57. [15] GC Shalini; P Karwa; A Khanum; V Pandit. Drug Deliv Lett. 2014, 4(1), 49-61. [16] N Shastri; A Mahesh; M Sadanandam. Curr Drug Deliv. 2010, 7(1), 21-27.
[17] A Abdelbery; ER Bendas; AA Ramadan; DA Mostafa. AAPS Pharm Sci Tech. 2014, 15(6), 1603-1604. [18] YS Pathare; VK Hastak; AN Bajaj. Int J Pharm Sci Rev Res. 2013, 21(1), 169-178.
[19] S Effat; A Massoud; AG Moghadam; MB Tehrani. Iran J Pharm Res. 2014, 13(1), 81-86.
[20] S Chengying; S Baode; X He; B Jinxia; D Ling; LV Qingyuan; H Jin; Y Hailong. Drug Dev Ind Pharm. 2014, 40(5), 649-656.
[21] KK Peh; KB Liew; YTF Tan.Int J Pharm Pharm Sci. 2013, 5(4), 4-8. [22] KB Liew; YTF Tan; KK Peh. AAPS Pharm Sci Tech.2012, 13(1), 134-142.
[23] Y Murata; T Isobe; K Kofuji; N Nishida; R Kamaguchi. Pharmacol Pharm. 2013, 4, 325-330. [24] SB Bari; AR Bakshi; PS Jain; SJ Surana. Pharm Anal Acta. 2011, 2 (2), 120.
[25] L Xiao; T Yi; Y Liu; D Huan; JK He. Acta Pharm Sin. 2011, 46(5), 586-591.
[26] F Ciluroz; IE Cupone; P Minghetti; S Buratti; GM Chiara; L Montanari. Drug Dev Ind Pharm. 2011, 37(3), 252-259.