Study on Influence of Effective Parameters on Wear
Behavior of Wheel and Rails through
ADAMS-RAIL Software
Majid Elyasi
*, Milad Hadinezhad, Mohammad Rajabi, Majid Abbasi
Faculty of Mechanical Engineering, Babol University of Technology, Iran
Copyright © 2015 by authors, all rights reserved. Authors agree that this article remains permanently open access under the terms of the Creative Commons Attribution License 4.0 International License
Abstract
The present paper focuses on study of parameters such as lateral force, wagon weight, rail path curvature, train speed and path slop those have greatest effects on wear mechanism of wheel and rail. ADAMS-RAIL simulation software was used for dynamical modeling of train while moving via railway. Some experimental tests were carried out to evaluate the wear loss obtained from these parameters. Results indicated that in railway with high path curvature higher lateral force affects on wheelsets. Moreover, high train speed resulting lower derailing probability. Furthermore, cant has a significant effect on critical rates like derailing. And also, it is influential on wheel and rail lateral force and decreases the wear between rail and wheel. By increasing in lateral force from 46N to 64N, the wear rate increases about 66% and by increase in slip velocity the wear rate also increases.Keywords
Railway, Wear, ADAMS-RAIL Software, Lateral Force, Velocity, Radius of Curvature1. Introduction
Wear phenomenon extensively affects in life of parts those are used in industry and damages their safety. Also, it is one of major challenges in the case of rail transportation industry. Wear phenomenon between rail and wheel is a complex type of wear phenomena in which many parameters are contributed. Values and types of wear are relatively different while train moves through straight path or one moves through path with curvature. Subway transpirations systems suffer higher values of wear due to their due to higher path curvature while compared with suburban transportations [1, 2].
High amount of published papers in this area implies the importance of wear behavior in railway industry. Designing of optimal wheel profile based on wear behavior [3], numerical index as comparison tool [4] and estimation of
wheels and rails life through simulation [3] are types of the works in the case of wear analyzing of railway industries [5]. In a poor lubricant condition, the wear can cause plastic deformation in interface of rail and wheel due to slipping-rolling interface [6, 7]
The distribution of contact area and contact force can be served as main reasons of wear phenomenon in railway industries. The adhesive is known as a main mechanism of wear. Archard [8] introduces the adhesive wear mechanism as follows:
Wad = VL = K FHn (1)
Where Wad is wear rate (the volume of rail and wheel mass
loss during slip distance), K is wear coefficient, V is Velocity, L is slip distance, Fn is normal force and H is hardness of
softer material.
The main weakness of Archard model was considering to hardness as main component of his equation. Hence, in further study Hornbogen [9] modified the Archard's model as following Eq. (2).
𝑊𝑊ad= N2 PyE Fn
1.5
KIC2 H1.3 (2)
Where KIc is the material's fracture toughness, Py is yield
stress of softer surface, E is combinational modulus of elasticity for both surfaces, H is hardness of softer material, Fn is normal force and N is work hardening factor.
As it is observed at equations 1 and 2, the effect of normal force on wear rate is one of major factor of wear mechanism. The normal and lateral forces are generated when the wheel moves on railway. The normal force is highly affected by wagon weight at straight path while the lateral force is highly affected by wagon weight at curve path. The lateral force in curvature path is calculated by using of following Eq. (3).
∑L = MVR2cosα − Mg sinα (3)
2. Simulation by ADAMS-RAIL
In order to simulate the wear behavior between wheel and rail the ADAMS-RAIL commercial software has been utilized. In this software, the principle of contact between wheel and rail has been designed based on Kalker theory [10]. The main inputs for modeling of wear by ADAMS-RAIL are geometric model of train, mechanical behavior parameters such as springs and dampers, properties of rigid bodies, and shape characteristics of wheels and rails in contact places. The dynamical characteristics of train movement such as displacement, velocities and accelerates are obtained through dynamical analysis of train movement on railways. In the present work the ADAMS-RAIL software has been used to simulate wear phenomenon between wheels and rails. Table 1, presents the input parameters which were entered in ADAMS-RAIL for simulation.
Table 1. Input parameters for simulation
Input parameters Value
Modulus of elasticity (GPa) 210
Radius of path curvature (m) 250
rolling radius (m) 0.46
Wheelset base (m) 2.56
Wagon length (m) 24
Poisson’s ratio 0.3
Cant(rad) 0
Wagon total weight (ton) 42
Axle length (m) 2
Wagon height (m) 3
3. Experiments
According to our laboratory experiences and reviewed papers, it was decided to select lateral force, velocity, slip distance and surface roughness as the main parameters. The corresponding ranges for these parameters were determined according to simulation in Adams Rail 2005 finite element software. In this simulation the lateral force was determined by moving the train in a curved path with zero inclined angles. The simulation was performed under two weights and three velocities to obtain the lateral force. The forces then applied in pin-on-disk test experiments under dry lubricant condition. Table 1 presents the forces obtained under various velocities form simulation. Also, Table 2 presents the process factors and their corresponding levels.
Table 2. Input velocity and force for pin-on-disk machine test
Test No. Force (N) Velocity (m/s)
1 46 0.6
2 55 0.6
3 64 0.6
4 46 0.9
5 55 0.9
6 64 0.9
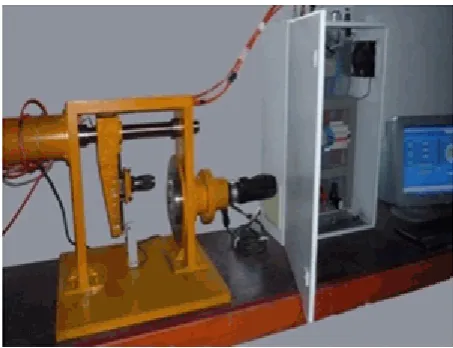
[image:2.595.315.550.252.428.2]In order to perform pin-on-disk test, the wheels and rails were prepared from R7 and 900A standards, respectively. Table 3 present the chemical compositions and mechanical properties of specimens. The pin had same material with rail, and the disk was prepared based on the wheel material [13]. Both pin and disk were prepared by means of universal turning machine, as shown in Fig. 1. During the test, the surface roughness of both pin and disk was equal. The pin was polished with the paper by grade of 600. Also, the disk surface was ground by means of magnetic grinding machine. After finishing the surface roughness of both pin and disk were equal to 3µm.
Table 3. Chemical composition of rail and wheel used in this research
Material strength Tensile (MPa)
Hardness
(HV) %C %Si %Mn %Cr
Wheel 880 260 0.55 0.4 0.8 0.3
Rail 950 267 0.7 0.3 1 0.3
[image:2.595.312.550.455.535.2]Figure 1. The used type of rail and wheel in this research
Figure 2. The prepared pin and disk for test
[image:2.595.318.545.562.736.2] [image:2.595.57.298.660.756.2]Figure 3 pin on disk horizontal testing with its equipment show. The device is equipped with a pneumatic system that controls the vertical force. It also had two load cells. Vertical force by force meter embedded inside the cylinder and the frictional force was measured by load cell. Pin specimen by a three-disk system is automatic and torque on the motor shaft, which is responsible for the rotation of the disk was placed.
All variables tested by the computer unit connected to the device, be controlled. Through device software, variables such as vertical load, linear speed, disc diameter and the number of times the disk was adjusted to distance the input system. The output variable as well as variables such as temperature and friction of software was visible.
The pin-on-disk test is a standard test to analyze wear strength or wear rate of contacts. The tests were carried out with in a disk and different pins. After performing experiments the specimens were weighed by means of a digital balance with 0.0001 g resolution. Then their mass reductions were recorded to calculate the wear rate using Eq. (4).
(W1-W2)/S =Wear rate (4)
Where, W1 is the specimen's weight before experiment and
W2 is the specimen's weight after experiment. Also, S is the slip distance. The S is equal to 1500 m in all experiments.
In order to find effects of slip distance and surface roughness n wear rate, these factors varied over their available ranges while the other parameters were kept constant. Tables 4 and 5 present the experiments which were designed to analyze effects of slip distance and surface roughness respectively.
Table 4. Tests which were designed to analyze the effects of slip distance Test
No. machine test (m/s) Velocity of wear machine test (N) Force of wear Slip distance
1 0.6 46 1500
2 0.6 46 3000
3 0.6 46 4500
4 0.6 46 6000
5 0.9 64 1500
6 0.9 64 3000
7 0.9 64 4500
8 0.9 64 6000
Table 5. Tests which were designed to analyze the effects of surface roughness
Test
No. machine test (m/s) Velocity of wear machine test (N) Force of wear roughness (Surface µm)
1 0.6 46 1
2 0.6 46 3
3 0.6 46 7
4 0.9 64 1
5 0.9 64 3
6 0.9 64 7
To analyze effects of process parameter on plastic deformation and wear mechanism a stereo microscope along with scanning electron microscope were utilized. The taken images provide beneficial information about worn surface topography and wear mechanism during motion.
4. Results and Discussions
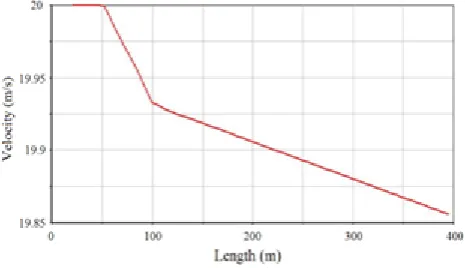
Effect of curve shape during moving of trainFig. 4 illustrates effect of displacement versus velocity for both straight and curvature paths. For simulating of curve effect on moving of train, it was decided firstly the train moves through a straight path with initial velocity of 20 m/s from the place of 0 to 50 m. Then the curvature was formed slightly from 50 to 100m. Finally a curvature with radius of 250 m was considered for final step 100 to 400 m. As it is shown form Fig. 1, although the curvature radius of 50 t0 100 m is less than that radius of 100 to 400 m, but the sloe of velocity reduction in 50 to 100 m is relatively higher than with that in 100 to 400 m. This is due to the fact that in 50 to 100 m the curvature was formed slightly but in 100 to 400 m the constant curvature existed.
[image:3.595.316.549.373.507.2]
Figure 4. Effect of curve shape during moving of train
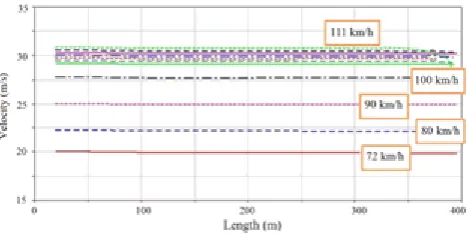
Effect of velocity on train derailing from railway
[image:3.595.59.297.468.588.2] [image:3.595.57.303.616.710.2]Figure 5. Train moving with different velocities
Effect of lateral force on wheelset in curvature path
The wheelset tends to roll in the path directions. While train reaches to a curve, the front wheels tend to roll to outside of curvature while the rear wheels tends to roll to inside of curvature. Due to conical shape of crown wheel in contact point when the wheels move toward outside of curvature, the radius of the outer wheel is relatively higher that it's neighbor wheel, and this difference in radius leads to creep and higher lateral force. Hence, based on the contact theory of Hertz by reducing of wheel radius or reducing of lateral forces, stresses are increased and may lead to high value of wear between rail and wheels [7]. According to Fig. 6, it can be inferred that the dash type graph with curvature radius of 200 m leads to this result is verified according to Eq. 3.
Fig. 7 demonstrates effect of distance between two axles in a bogie. According to dash type graph with wheelset base of 3m, it can be inferred that the lateral force is relatively higher while compared stretch type graph with wheelset base of 2.56 m. In another word, by reducing of wheel base the lateral force is decreased accordingly higher lateral force while compared with solid line graph with curvature radius of 250 m.
Figure 6. Comparison lateral force onto wheelset in tow different curves
Figure 7. Comparison lateral force onto wheelset in tow different wheel set base
Effect of increasing of wagon weight on lateral
[image:4.595.315.550.80.197.2]The wagon weight including its parts and passengers may lead to variation in the lateral force. In order to determine effect of wagon weight on lateral force, the wagons with weights of 1, 10, 32 and 50 tons were simulated. The simulation was conducted under curvature radius of 250 m and cantof 0 rad. According to Fig. 8, it can be inferred that by increasing of wagon weight, the lateral force increases accordingly.
Figure 8. Lateral force of front wheelset in a bogie in four different weights
[image:4.595.315.550.353.465.2]Effects of lateral force on wear rate
Fig. 9 presents effect of lateral force on the pin and disk wear rate. It is seen from this figure that the wear rate increases by increase in lateral force under 0.6 m/s and 0.9 m/s velocity. From metallurgical point of view, when the lateral force increases, a hard oxidation layer which act as a protective role on the interface decreases gradually and wear rate increases [14]. According to this phenomenon, by an increase in lateral force from 46N to 64N the wear rate increases about 66%.
[image:4.595.59.297.525.642.2]Figure 9. Variation of wear rate according to lateral force Effects of slip velocity
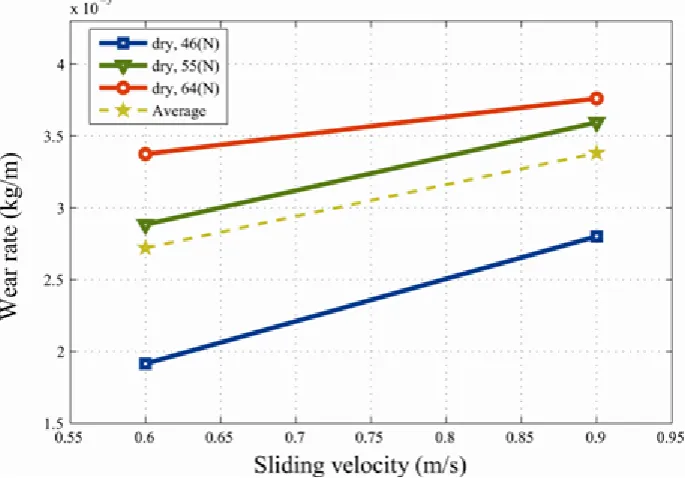
[image:5.595.132.478.86.325.2]Fig. 10 demonstrates effect of slip velocity under different lateral force. From this figure, it is seen that the wear rate increase by increase in the slip velocity. This trend is attributed to this reason that by increase in slip velocity, regardless to removing the protective layer, the temperature rises to a critical value and plastic deformation increases, subsequently. Hence, in such a condition, the wear rate increases, correspondingly. However, it is seen that at higher lateral force (i.e. 64N) there is not a highlight difference between the wear rates of 0.6 m/s and 0.9 m/s velocities.
Figure 10. Variation of wear rate according to sliding velocity
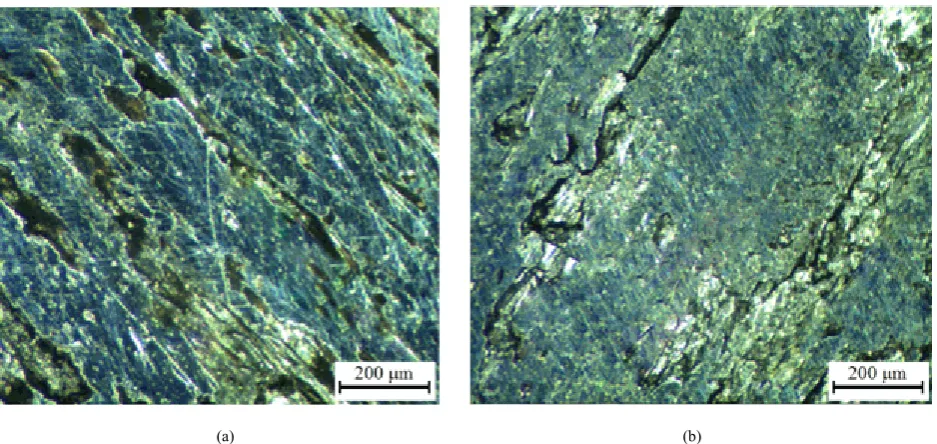
Microscopic analysis on effects of lateral force and slip velocity on plastic deformation and wear
[image:5.595.134.477.435.674.2](a) (b)
Figure 11. Optical microscopy image of worn surface at 46 N with velocity (a) 0.6 m/s, (b) 0.9 m/s
At higher lateral force (Fig. 12), when the slip goes beyond critical value, the pin and disk surfaces are welded together and then ruptured continuously. Such a condition causes adhesion wear mechanism. Therefore, in the interface surfaces cracks and voids are observed that implies high amount of wear.
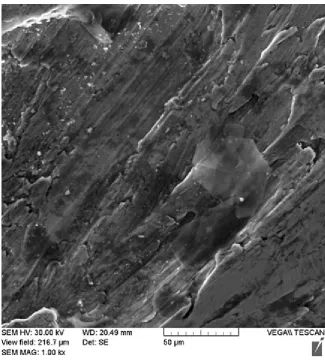
Fig. 13 (a) depicts worn surface of the specimens under 64N lateral force and 0.6m/s slip velocity. As it is seen, by increase in lateral force in 0.6m/s velocity the plastic deformation increases, consequently. Also, from Fig. 13(b) and 14, it is seen that by increase in slip velocity from 0.6m/s to 0.9m/s under 64N force, the plastic deformation increases and causes the interface materials to be plowed. Therefore, the wear rate increases, subsequently [11].
(a) (b)
[image:6.595.66.545.411.624.2]
(a) (b)
Figure 13. Optical microscopy image of worn surface at 64N with velocity (a) 0.6 m/s, (b) 0.9 m/s
[image:7.595.64.545.79.300.2] [image:7.595.141.467.333.697.2]5. Conclusions
In the present work effect of parameters such as lateral force, wagon weight, velocity, path curvature and cant was studied on wear behavior of wheel and rail. The obtained results can be summarized as follows:
1. Higher curvature radius leads to higher lateral force and resulting higher wear between wheel and rail
2. By increasing in train velocity the derailing probability increases accordingly.
3. Cant has a great influence on critical rates such as derailing rate and it may also lead to decreasing of wear between wheel and rail
4. Lower curvature radius or higher axle distance the wheel has to turn with higher curvature angle and it may lead to higher lateral force.
5. The wear under dry condition by increase in lateral force from 46N to 64N, the wear rate increases about 66%.
6. By increase in slip velocity the wear rate also increases. But effect of the velocity wasn’t as significant as lateral force.
Acknowledgements
We would like to express our sincere thanks to respectable managers of Tehran subway and WM Company in particular Mr. Payam and Mr. Majedi for their cooperation in presenting experimental data to the authors.
REFERENCES
[1] A. Falahati, A. Hosainabadi, Study of the effect of process parameters on wear, International Conference on Recent Advances in Rail way Engineering, (2009), in Persian. [2] Y. Salimi, R. Serajian, Study of contact stress between rail and
wheel with FEM software, (2010).
[3] I.Y. Shevtsov, V.L. Markine, C. Esveld, Optimal design of wheel profile for railway vehicles Wear 258 (2005) 1022-1030.
[4] T
.
Jendel, Prediction of wheel profilewear-comparisons with field measurements, Wear, 253, 89-99, 2002.[5] K.L. Johnson, Contact Mechanics, Cambridge University Press, Cambridge, UK, 1985
.
[6] O. Arias, Z. Li, R. Lewis, Rolling–sliding laboratory tests of friction modifiers in dry and wet wheel–rail contacts, Wear, 268, 543–551, 2010.
[7] J. Sundh, U. Olofsson, Relating contact temperature and wear transitions in a wheel–rail contact, Wear, 271, 78-85, 2011. [8] J.F. Archard, Contact and rubbing of flat surfaces, Journal of
applied physics, 24 98-104, 1953.
[9] B. Bhushan, Tribology and mechanics of magnetic storage devices, Springer Verlag, New York, 1990.
[10] M. Abbasi, S. Kheirandish, Y. Kharrazi, J. Hejazi, On the comparison of the abrasive wear behavior of aluminum alloyed and standard Hadfield steels, Wear, 268, 202-207, 2010.