Recognition of Handwritten Marathi Vowels using Zone
based Symmetric Density Features
C. H. Patil
Research Scholar
Department of Computer Science Yashwantrao Mohite College,
Bharati Vidyapeeth Deemed University, Pune
ABSTRACT
In this paper, a zone based symmetric density feature is proposed to recognize Handwritten Marathi Vowels. Recognition of handwritten Marathi vowels is a challenging task due to their interclass structural similarities. This paper describes a method for recognition of handwritten Marathi vowels. Since a standard database does not exist for handwritten Marathi vowels, as a part of this work database of 2294 handwritten Marathi vowels was created. Pre-processing techniques are applied to remove noise and there zone based symmetric density features are extracted. According to the fivefold cross validation technique a maximum of 92.91% recognition rate was achieved. The recognition rates were compared with those achieved by KNN and SVM classifiers.
Keywords
Handwritten Marathi Vowel Recognition; OCR; Zoning; symmetric density; Five fold
1.
INTRODUCTION
Marathi is an official language of Maharashtra and Marathi is written in devanagari script [2-8, 13, 19, 27]. Marathi is 15th most spoken language in the world. Marathi language consists of 12 vowels and 36 consonants making a total of 48 characters [1, 11, 16, 24]. Recognizing handwritten Marathi characters is important because of its application in various fields like bank cheque automation, postal automation, form processing, historical document preservation, etc [1-5, 16]. Recognition of Handwritten Marathi vowel is a difficult and challenging task due to interclass and intra class similarities. Vowels are used as characters in the formation of Marathi words as well as are combined with consonants as modifiers. Modifier comes above header line, or at the bottom of character or in line [1, 24].
Data collection, Pre-processing, Feature Extraction and Classification which are the major steps [20] in OCR are shown in Fig. 1.
2.
DATA COLLECTION
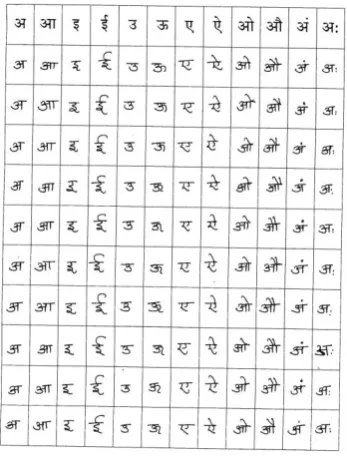
[image:1.595.351.515.202.400.2]Since a standard database does not exist for handwritten Marathi vowels, an attempt was made to create a database of isolated Marathi handwritten vowels to enable experiments to be carried out [1, 11, 16, 24]. Specially designed A4 sheets are used for data collection. Twenty writers from different professions include students, clerks, teachers were chosen to write the Marathi vowels on the datasheets provided. No constraints were imposed on the use of ink or pen except that they have to write the characters in the boxes of the sheets provided. A sample sheet of handwritten Marathi vowels is shown in Fig. 2.
Fig 1: Steps in isolated handwritten character recognition
[image:1.595.349.523.479.710.2]The data sheets were scanned using a flat bed scanner at a resolution of 1200 dpi and stored as gray scale images. From the scanned gray scale image, the character images were cropped manually and stored in respective class folders. Fig. 3 shows some characters cropped from the scanned image of a datasheet in gray scale.
Fig 2: Sample Sheet for Handwritten vowel
InputImage
Pre-processing
Feature Extraction
Classification
Fig 3: Handwritten Marathi Vowels
3.
PRE-PROCESSING
Pre-processing commonly involves normalizing the intensity of the individual particles images by removing low frequency background noise reflections and masking portions of the images [1-4, 7, 13, 19, 27]. Pre-processing enhances recognition rate of the images prior to feature extraction.
3.1
Noise Removal
The raw input of the digitizer typically contains noise due to erratic hand movements and inaccuracies in digitization of the actual input. In order to reduce the blurring of character edges and suppress noise, the median filter is used. In median filtering, the idea is to replace the current point in the image by the median of the brightness in its neighborhood. A 3×3 square neighborhood is used to remove noise from the gray scale images [2, 7, 13, 16, 19, 27].
3.2
Binarization
Image binarization is performed on input image. Histogram-shape based image thresholding suggested by Otsu is used for converting gray scale image to binary image. The algorithm assumes that the image contains two classes of pixels (foreground and background) prior to thresholding and it calculates the optimum threshold separating those two classes so that their combined spread (intra-class variance) is minimal.
3.3
Normalization
The binarized character image is mapped onto a standard plane (with predefined size) so as to give a representation of fixed dimensionality for classification. The goal of character normalization is to reduce the inter-class variation of the shapes of the characters in order to facilitate feature extraction process and improve their classification accuracy. Linear normalization method was used to standardize the character images. A square of size 60 x 60 is considered as the standard plane. The width and height ratio of the character image is not disturbed due to normalization.
3.4
Thinning
The goal of character thinning is to remove pixels so that an object without holes shrinks to a minimally connected stroke, and an object with holes shrinks to a ring halfway between the hold and outer boundary.
4.
FEATURE EXTRACTION
4.1
Density Symmetric
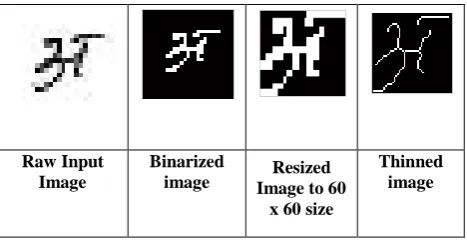
In the proposed method, the binary image representing the handwritten character is pre-processed in order to identify the important features as shown in the Section 3 and is normalized to a size of 60 x 60 pixels. The size-normalized image is divided into n equal zones. Recognition rates were computed for n=4, 9, 16, 25, 36, 49 and 100. It is observed that a no significant improvement in recognition rate where n=49. Therefore only features identified for n=4, 9, 16, 25, 36 were considered.
Raw Input Image
Binarized
image Image to 60 Resized x 60 size
[image:2.595.313.547.70.192.2]Thinned image
Fig 4: Pre-processed Handwritten Marathi Vowels
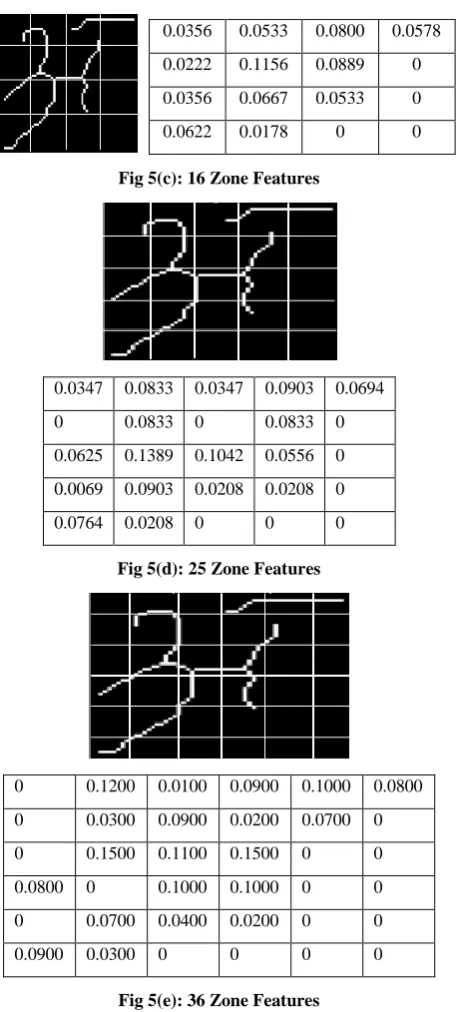
The density of each zone is computed by taking the ratio of total number of object pixels to total number of pixels in that zone. This is carried out for every zone in the image. Finally, 90 features are extracted from the image and feature vector stores there 90 features. Density features calculated where n=4, 9, 16, 25, 36 are shown in fig. 5(a) - 5(e).
DensityZ =number of object pixels in the zone Z
total number of pixels in this zone Z --- (1)
4.2
Algorithm to Calculate Feature vector:
The steps for calculation of feature vector are given below 1. Pre-process the input Image and resize to 60 x 60. 2. Divide the input image into four equal zones; calculate density of each zone that will give four features.
3. Divide the input image into nine equal zones; calculate density of each zone that will give nine additional features. 4. Divide the input image into 16 equal zones; calculate density of each zone that will give 16 more features.
5. Divide the input image into 25 equal zones; calculate density of each zone that will give 25 extra features.
6. Divide the input image into 36 equal zones; calculate density of each zone that will give 36 additional features. 7. Feature vector of total 90 features is prepared for individual image.
Fig 5 (a): Four Zone Features
Fig 5 (b): Nine Zone Features
0.0567 0.0567 0.0456 0.0133
Fig 5(c): 16 Zone Features
0.0347 0.0833 0.0347 0.0903 0.0694
0 0.0833 0 0.0833 0
0.0625 0.1389 0.1042 0.0556 0
0.0069 0.0903 0.0208 0.0208 0
0.0764 0.0208 0 0 0
Fig 5(d): 25 Zone Features
0 0.1200 0.0100 0.0900 0.1000 0.0800 0 0.0300 0.0900 0.0200 0.0700 0 0 0.1500 0.1100 0.1500 0 0 0.0800 0 0.1000 0.1000 0 0 0 0.0700 0.0400 0.0200 0 0
0.0900 0.0300 0 0 0 0
Fig 5(e): 36 Zone Features
5.
CLASSIFICATION
As explained in section 4 feature vectors are created for every image. Using KNN and SVM Classifiers experiments are carried out and class labels are assigned to images.
5.1
K-NN
The k-Nearest Neighbor (k-NN) classifies an unknown sample based on the known classification of its neighbors [13, 16, 20, 24]. Suppose that a set of samples with known classification is available, the so-called training set. Intuitively, each sample should be classified similarly to its surrounding samples. Therefore, if the classification of a sample is unknown, then it could be predicted by considering the classification of its nearest neighbor samples. Given an unknown sample and a training set, all the distances between the unknown sample and all the samples in the training set can be computed. The distance with the smallest value corresponds to the sample in
unknown sample may be classified based on the classification of this nearest neighbor. k- NN is an instance-based learning type classifier, or lazy learning where the function is only approximated locally and all computation is deferred until classification. Euclidean distance is used.
5.2
SVM
Support vector machines (SVM) are supervised learning models with associated learning algorithms that analyze data and recognize patterns, used for classification [3, 4, 3]. SVM training algorithm builds a model that assigns new examples into one category or the other, making it a non-probabilistic binary linear classifier.
6.
RESULTS
Database of 2294 samples is used to carry out experiments 80% of the samples are used for training and the remaining for testing purpose. Fivefold cross validation technique is used to test recognition rate. Every fold contains different test samples to experiment deviation in recognition rate.
SVM classifier is used for classification as shown in Table 1 recognition rate for four features, 13 features, 29 features, 54 features, 90 features, 190 features and 500 features. It is observed that Recognition rate for Fold I to Fold V is increasing from 4 features to 90 features. Deterioration observed in recognition rate when additional extra 100 and 400 features added to feature vector.
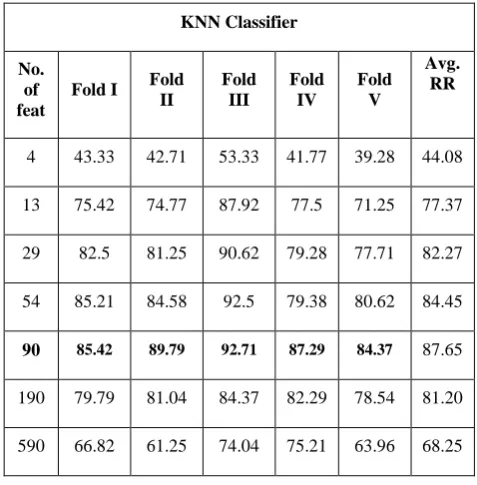
KNN classifier is used for classification for Fold I to Fold V as shown in Table 2.
Recognition rate for 90 features by using SVM classifier for every vowel for every fold is shown in Table 3. Average recognition rate using SVM is 86%.
Recognition rate for 90 features by using KNN classifier for every vowel for every fold is shown in Table 4. Average recognition rate using KNN is 87.92%.
[image:3.595.57.286.67.574.2]Table 5 and Table 6 shows confusion matrix for fold 3 using SVM and KNN Classifier respectively.
Table 1. Classification Result using SVM Classifier
SVM Classifier
No. of feat
Fold I Fold
II
Fold III
Fold IV
Fold V
Avg. RR
4 36.25 42.98 46.77 35 35 39.2 13 63.12 71.46 78.96 68.96 67.5 70 29 72.08 76.25 82.71 72.98 71.46 75.09 54 81.46 80.83 87.29 72.98 75.83 79.67
90 83.75 87.92 92.91 88.54 77.08 83.41
190 85.83 82.04 91.04 86.87 80.21 85.19 590 80.62 83.75 88.33 81.88 76.46 82.20 0.0356 0.0533 0.0800 0.0578
0.0222 0.1156 0.0889 0 0.0356 0.0667 0.0533 0
[image:3.595.312.544.504.740.2]Table 2. Classification Result using KNN Classifier
KNN Classifier
No. of feat
Fold I Fold
II
Fold III
Fold IV
Fold V
Avg. RR
4 43.33 42.71 53.33 41.77 39.28 44.08
13 75.42 74.77 87.92 77.5 71.25 77.37 29 82.5 81.25 90.62 79.28 77.71 82.27 54 85.21 84.58 92.5 79.38 80.62 84.45
90 85.42 89.79 92.71 87.29 84.37 87.65
190 79.79 81.04 84.37 82.29 78.54 81.20
[image:4.595.308.548.93.459.2]590 66.82 61.25 74.04 75.21 63.96 68.25
Table 3. Classification Result using 90 Features SVM Classifier
SVM Classifier 90 features for 4,9,16,25 and 36 zones
Vow els
Sam ples
Fold I
Fold II
Fold III
Fold IV
Fold
V RR
191 82.5 80 75 92.5 45 75
191 87.5 92.5 97.5 97.5 80 91.5
191 75 75 100 100 67.5 83.5
191 80 75 97.5 92.5 85 86
191 90 90 97.5 85 80 89
198 90 97.5 92.5 80 77.5 86.5
185 97.5 100 82.5 72.5 82.5 88.5
190 82.5 100 97.5 90 85 90.5
192 65 87.5 97.5 87.5 90 86
192 92.5 82.5 90 82.5 82.5 86.5
191 85 85 95 85 70 84
191 77.5 90 92.5 97.5 80 85
Total 2294 83.75 87.92 92.91 88.54 77.08 86
Table 4. Classification Result using 90 Features KNN Classifier
KNN Classifier 90 features for 4,9,16,25 and 36 zones
Vow els
Samp les
Fold I
Fold II
Fold III
Fold IV
Fold
V RR
191 75 75 75 90 45 72
191 87.5 95 100 95 92.5 94
191 77.5 75 100 100 80 86.5
191 85 90 97.5 97.5 92.5 92.5
191 92.5 92.5 100 87.5 92.5 93
198 80 87.5 87.5 77.5 87.5 84
185 97.5 100 90 82.5 97.5 93.5
190 95 100 95 75 87.5 90.5
192 75 87.5 100 82.5 92.5 87.5
192 92.5 85 92.5 77.5 80 85.5
191 90 100 95 92.5 87.5 93
191 77.5 90 80 90 77.5 83
Total 2294 85.42 89.79 92.71 87.29 84.37 87.92
7.
CONCLUSION
This paper describes a simple and efficient method to extract zone based symmetric density features. Also pre-processing techniques are used to improved recognition rate. From experimental results it is evident that 90 features give satisfactory recognition rates. Additional extra 100 and 400 features deteriorating recognition rate. Recognition rate for different fold using KNN and SVM classifier are different. Proposed algorithm is insensitive to writing style, ink, size, noise and character slant. KNN classifier gives good recognition rate than SVM classifier. Average recognition rate for all folds using KNN is 87.65% and using SVM is 83.41%. As shown in Table 3 and Table 4 maximum recognition rate achieved for Fold III is 92.91% and 92.71% using SVM and KNN classifier respectively. Reason for recognition errors are due to abnormal handwriting and inter class similarities. Future work need to be focused on reducing the pre-processing and the number of features used for recognition.
8.
ACKNOWLEDGMENTS
[image:4.595.51.286.383.723.2]Table 5. Confusion Matrix for Fold III using SVM
CM Test Samples
40 30 1 2 0 1 0 0 0 0 0 2 4
40 1 39 0 0 0 0 0 0 0 0 0 0
40 0 0 40 0 0 0 0 0 0 0 0 0
40 0 0 0 39 0 0 0 0 0 1 0 0
40 1 0 0 0 39 0 0 0 0 0 0 0
40 0 0 1 0 2 37 0 0 0 0 0 0
40 0 0 0 0 7 0 33 0 0 0 0 0
40 1 0 0 0 0 0 0 39 0 0 0 0
40 0 1 0 0 0 0 0 0 39 0 0 0
40 0 0 0 0 0 0 0 0 4 36 0 0
40 0 1 0 0 0 0 0 0 1 0 38 0
40 0 0 0 0 0 0 1 1 0 0 1 37
Table 6. Confusion Matrix for fold III using KNN
CM Test
Samples
40 30 0 1 0 2 0 0 0 0 0 1 6
40 0 40 0 0 0 0 0 0 0 0 0 0
40 0 0 40 0 0 0 0 0 0 0 0 0
40 0 0 0 39 0 0 0 1 0 0 0 0
40 0 0 0 0 40 0 0 0 0 0 0 0
40 1 0 1 0 3 35 0 0 0 0 0 0
40 0 0 0 0 4 0 36 0 0 0 0 0
40 1 0 0 0 1 0 0 38 0 0 0 0
40 0 0 0 0 0 0 0 0 40 0 0 0
40 0 0 0 0 0 0 0 0 3 37 0 0
40 0 0 0 0 0 0 0 0 2 0 38 0
40 5 1 0 0 0 0 1 0 0 0 1 32
9.
REFERENCES
[1] Ajmire P.E. And Warkhede S.E. Handwritten Marathi Character (Vowel) Recognition. Advances In Information Mining, Issn: 0975–3265, Volume 2, Issue 2, 2010, Pp-11-13.
[2] Anilkumar N. Holambe And Dr.Ravinder.C.Thool. Comparative Study Of Different Classifiers For Devanagari Handwritten Character Recognition. International Journal Of Engineering Science And Technology Vol. 2 (7), 2010, 2681-2689.
[3] G. G. Rajput and S. M. Mali. Isolated Handwritten Marathi Numerals Recognition Based upon Fourier
Descriptors and Freeman Chain Code. International Journal of Computational Intelligence Research ISSN 0973-1873 Volume 6, Number 2 (2010), pp. 289–298. [4] G. G. Rajput, S. M. Mali. Fourier Descriptor based
Isolated Marathi Handwritten Numeral Recognition. International Journal of Computer Applications (0975 – 8887). Volume 3 – No.4, June 2010.
[6] Jyotsna Vaid And Ashum Gupta. Exploring Word Recognition In A Semi-Alphabetic Script: The Case Of Devanagari. 2002 Elsevier Science (USA) 0093-934x/02 [7] Latesh Malik And Dr. P.S. Deshpande. Recognition Of
Printed And Handwritten Devanagari Characters With Regular Expression In Finite State Models. V. Sn_A_Sel (Ed.): Digital Technology Journal 2009, Vol. 2, Pp. 1{7}. [8] M C Padma And P A Vijaya. Identification Of Telugu, Devanagari And English Scripts Using Discriminating Features. International Journal Of Computer Science & Information Technology (IJCSIT), Vol 1, No 2, November 2009.
[9] M. Hanmandlu, O.V. Ramana Murthy And Vamsi Krishna Madasu. Fuzzy Model Based Recognition Of Handwritten Hindi Characters. Digital Image Computing Techniques And Applications. IEEE Computer Society0-76954-3067-2/07-2007.
[10] Mohit Mehta, Member, Iacsit, Rupesh Sanchati And Ajay Marchya. Automatic Cheque Processing System. International Journal Of Computer And Electrical Engineering, Vol. 2, No. 4, August, 2010
[11] Mrs.Vinaya. S. Tapkir And Mrs.Sushma.D.Shelke. Ocr For Handwritten Marathi Script. International Journal Of Scientific & Engineering Research Volume 3, Issue 8, August-2012 ISSN 2229-5518.
[12] Naresh Kumar Garg, Lakhwinder Kaur And M. K. Jindal. Segmentation Of Handwritten Hindi Text. 2010 International Journal Of Computer Applications (0975 – 8887) Volume 1 – No. 4
[13] P. B. Khanale And S.D. Chitnis. Handwritten Devanagari Character Recognition Using Artificial Neural Network. Journal Of Artificial Intelligence 4(1):55-62, 2011
[14] P. S. Deshpande, Latesh Malik And Sandhya Arora. Fine Classification & Recognition Of Hand Written Devnagari Characters With Regular Expressions & Minimum Edit Distance Method. Journal Of Computers, Vol. 3, No. 5, May 2008
[15] P. S. Deshpande, Mrs. Latesh Malik And Mrs. Sandhya Arora. Recognition Of Hand Written Devnagari Characters With Percentage Component Regular Expression Matching And Classification Tree. I-4244-1272-2/07 2007 IEEE
[16] P.B. Khanale. Recognition Of Marathi Numerals Using Artificial Neural Network. Journal Of Arificial Intelligence 3(3): 135-140, 2010
[17] Prachi Mukherji And Priti P. Rege. Fuzzy Stroke Analysis Of Devnagari Handwritten Characters. WSEAS Transactions On Computers Issue 5, Volume 7, May 2008
[18] Prachi Mukherji And Priti P. Rege. Shape Feature And Fuzzy Logic Based Offline Devnagari Handwritten
Optical Character Recognition. Journal Of Pattern Recognition Research 4 (2009) 52-68
[19] R. J. Ramteke. Invariant Moments Based Feature Extraction For Handwritten Devanagari Vowels Recognition. 2010 International Journal Of Computer Applications (0975 - 8887) Volume 1 – No. 18
[20] Raghuraj Singh, C. S. Yadav, Prabhat Verma And Vibhash Yadav. Optical Character Recognition (OCR) For Printed Devnagari Script Using Artificial Neural Network. International Journal Of Computer Science & Communicationvol. 1, No. 1, January-June 2010, Pp. 91-95
[21] S. Arora, D. Bhattacharjee, M. Nasipuri , D.K. Basu, M.Kundu, L.Malik. Study Of Different Features On Handwritten Devnagari Character. Second International Conference On Emerging Trends In Engineering And Technology, ICETET-09
[22] Sandhya Arora, Debotosh Bhattacharjee, Mita Nasipuri, Dipak Kumar Basu And Mahantapas Kundu. Combining Multiple Feature Extraction Techniques For Handwritten Devnagari Character Recognition. 2008 IEEE Region 10 Colloquium And The Third ICIIS, Kharagpur, India December 8-10
[23] Sandhya Arora. Debotosh Bhattacharjee, Mita Nasipuri, L. Malik , M. Kundu And D. K. Basu. Performance Comparison Of SVM.
[24] And ANN For Handwritten Devnagari Character Recognition. IJCSI International Journal Of Computer Science Issues, Vol. 7, Issue 3, No 6, May 2010
[25] Sushama Shelke And Shaila Apte. A Multistage Handwritten Marathi Compound Character Recognition Scheme Using Neural Networks And Wavelet Features. International Journal Of Signal Processing, Image Processing And Pattern Recognition Vol. 4, No. 1, March 2011
[26] U. Pal, T. Wakabayashi And F. Kimura. Comparative Study Of Devnagari Handwritten Character Recognition Using Different Feature And Classifiers. 2009 10th International Conference On Document Analysis And Recognition
[27] Vandana M. Ladwani And Mrs. Latesh Malik. Survey Of Various Approaches Towards Handwritten Devnagari Word Recognition. International Journal On Computer Engineering And Information Technology 2010
[28] Veena Bansal And R. M. K. Sinha. Integrating Knowledge Sources In Devanagari Text Recognition System. IEEE Transactions On Systems, Man, And Cybernetics—Part A: Systems And Humans, Vol. 30, No. 4, July 2000