Munich Personal RePEc Archive
A Simple Approach for Identifying
Underperforming Schools
Moore, Winston and Iyare, Osaretin
Department of Economics, University of the West Indies, Cave Hill
Campus
8 June 2007
Online at
https://mpra.ub.uni-muenchen.de/21471/
A Simple Approach for Identifying Underperforming Schools
by
Osaretin Iyare
Department of Economics, University of the West Indies, Cave Hill Campus
and
Winston Moore1
Department of Economics, University of the West Indies, Cave Hill Campus
1
A Simple Approach for Identifying Underperforming Schools
Abstract
This paper outlines a purely statistical approach for evaluating school performance within a district. Three performance criteria are detailed: absolute performance, relative performance and conditional performance. The criteria are applied to the Barbadian secondary school system. The study finds that when the three criteria are used in conjunction they can identify schools that are consistently good or poor performers. In the case of Barbados, there was a general improvement in secondary school performance over the period, with no single school appearing consistently on the list of underperformers.
1. Introduction
Interest in improving school performance is intimately linked to the potential impact that a
quality education system can have on a nation‟s GDP growth rate. In endogenous growth
models, education impacts on growth since it lead to the accumulation of human capital, which is
employed in the production of goods and services (Lucas, 1988; Romer 1990). Using a database
of 86 countries averaged over 10 year intervals, Barro and Sala-i-Martin (2004) find a significant
relationship between economic growth and the average years of male secondary and higher
schooling. Moreover, once the quality of education is taken into account the marginal impact of
education on the rate of economic growth rises. Sala-i-Martin, Doppelhofer and Miller (2003)
also show that schooling is one of the few variables that are strongly or robustly related to
growth.
Given the importance of the education, or the educational system, in terms of stimulating growth,
a number of countries have implemented frameworks to identify and assist those schools that are
underperforming. An underperforming school is one that is not performing up to the standards
set by education officials. In England, the government sets annual performance targets for
secondary schools, known as the DfES School and College Achievement and Attainment Tables,
while the United States (under the No Child Left Behind Act of 2001) requires the Secretary of
Education to transmit to the Committee on Education and the Workforce of the House of
Representatives and the Committee on Health, Education, Labour, and Pensions schools that in
The traditional approach employed to identify underperforming schools is to specify some
minimum level of achievement and use this as the benchmark. Therefore, any school falling
below this benchmark is immediately red flagged as one that is under performing. This is the
approach currently employed in the US. Each state establishes adequate yearly progress for each
public primary and secondary school and district in state administered annual assessments.
Those schools that do not meet the adequate yearly progress are identified as underperforming
schools (US Department of Education, 2005). England employs a somewhat different approach,
known as contextual value added (CVA), or more generally referred to as a composite indicator
approach. The Department for Education and Skills (2006) uses a measure that adjusts predicted
achievement to take account of not only prior attainment, but also a number of other factors
outside of the school‟s control. Each students‟ performance is predicted based gender, special
education needs, ethnicity, eligibility for free school meals, first language, mobility, age, in care
and a post-code based deprivation measure. The difference between the students‟ predicted and
actual attainment provides the CVA. The CVA scores for all the school‟s students is averaged
and deflated based on the number of pupils. The CVA score is then employed to identify
underperforming schools.
Both the benchmark and composite indicator approaches have their limitations. The main
shortcoming of the benchmark approach is that they are usually based on subjective indicators of
performance. Therefore, what is considered poor performance in one state or district might be
considered average performance in another state or district. On the other hand, the composite
indicator approach may be distorted by the impact of one indicator and more importantly does not
This study attempts to outline a relatively simple statistical approach to identify those schools
that can be described as poor performers. The paper employs data on the Barbadian secondary
school system performance in English, Maths and all other subjects (Overall) over the period
1993-2006 to illustrate the utility of the approach.
This paper is structured as follows. After the introduction, the authors outline the methodological
approach for evaluating school performance. Section 3 applies the approach to data from
Barbados, which has a relatively successful high school programme. Section 4 summaries the
main findings and presents some recommendations for implementing the approach.
2. Methodological Approach for Identifying Underperforming Schools
The approach presented in this paper is similar to that used by Anderson and Morrissey (2006) to
identifying poorly performing countries. Assume that a school district has observations on
indicators of performance for each school, for example average grades on Mathematics and
English assessment examinations. One can employ three criteria to identify poorly performing
schools: (1) absolute underperformance; (2) relative underperformance, and; conditional
underperformance.
An absolute underperformer can be identified as any school that experienced a decline in average
grades in assessment examinations. Conversely, good performers, would be those that obtained
an improvement in the indicator over the period. This concept does not take into account the
difficulty with assessment exams. In such an instance all schools would report lower average
scores.
Alternatively, one can therefore use the concept of relative underperformance. A school is
considered to be underperforming if the average level of performance in assessment exams is
more than one standard deviation below the mean level of performance for all schools. Such an
approach is similar to the benchmark approach identified in the previous section. However,
rather than using arbitrarily chosen benchmarks, one employs the mean as the benchmark. By
employing the mean, one is basically using a time-varying benchmark which changes based on
the performance of other schools in the district.
The relative underperformance indicator does not take into account differences in initial
endowments of some schools. In Barbados and the UK, for example, top students tend to cluster
into „grammar‟ schools. As a result, these schools tend to have better average performance. The
conditional indicator of underperformance takes this into account by identifying a poor
performing school as one where performance was one standard deviation below that expected
given the initial level of the performance of the school. This can be done by estimating a
regression of the form:
it it
it y
y
(1)
where is a first difference operator, y is the performance indicator employed and is a well
behave error term for each school i in period t. Poor performance is identified based on the
The approaches identified earlier bear some similarity to the benchmark and the composite
indicators approach. However, rather than basing underperformance on some arbitrary
benchmarks or a vast array of indicators, one instead allows the data to identify those schools that
show up on all three lists. One can then investigate the situations of these schools to identifying
the challenges they encounter while trying to keep up with their peers.
3. An Application of the Approach to Barbados
3.1 Barbados’ Secondary School System
Barbados is one of the few countries in the world where all citizens can access free education
from primary to tertiary level. The educational system has historically been fairly successful in
training students to enter the work force. Evidence of this success can be gleaned from the large
number of Barbadians now working abroad and consequently repatriating foreign exchange to the
country. Torres (1988) estimates the out-migration rate for Barbados at about 1.24 percent of the
population annually. Although more recent estimates (2005) from the United Nation‟s Statistic
Division suggest that this estimate has declined slightly to approximately 1 percent.
One of the most important components of Barbados‟ educational landscape is its secondary
schools. Secondary schools are charged with the important responsibility of ensuring that all
students obtain the knowledge, skills and attitudes necessary for their future careers. Most
children of school age attend public schools or government-assisted private schools. There are 23
public secondary schools, most (21) of which co-educational institutions, and 6
Admission to the secondary school level is determined by three main criteria: (1) the student‟s
performance in the Barbados Secondary Schools Entrance Examination (BSSEE); (2) parents‟
choice, and; (3) zones where the students live. The BSSEE is taken by all primary school
students that have completed the national primary school curriculum (between 9 and 12 years)
and tests students‟ ability in Mathematics, English and Essay writing. Before the BSSEE is done,
the student‟s parent or guardian communicates their list of preferred schools to the Ministry of
Education. If the student obtains the necessary grades, he/she can gain admission into one of the
top three schools in the island, Harrisons College, Queen‟s College and Combermere, on
academic merit alone. The remaining spots in these three schools (if any) and the other
secondary schools are filled based on the list of preferred schools provided by the parent as well
as the proximity of a given secondary school to the student (known as zoning).
The present system should, obviously, create a skewed distribution of secondary school
performance. Added to this, prior to 2000, the BSSEE was the primary means of allocating
students to various secondary schools. Under this system, those students obtaining similar grades
were all sent to the same school. As a result, less that 6 of 23 secondary schools tended to obtain
the best academic results in the secondary school leaving exams, currently known as the
Caribbean Secondary Education Certificate (CSEC). The CSEC is administered by the
Caribbean Examinations Council (CXC) and covers ten basic subject areas: agriculture; business
education; home economics; humanities; industrial arts; industrial technology; information
technology; modern languages; science and math, and; expressive arts. CXC employs a six-point
In addition to the introduction of partial-zoning to allocate students to secondary schools, one of
the most important changes occurring in the systems was the introduction of the Education Sector
Enhancement Programme, referred to as Edutech 2000. The programme, costing over US$200
million has the objectives of upgrading the physical infrastructure of all schools, upgrading (or
installing) information technology infrastructure at all schools; human resource development and
curriculum reform.
3.2 Data
The data used in this study is obtained from the Ministry of Education, Youth Affairs and Sports
in Barbados. The key advantage of using observations on the Barbados secondary school system
is that all secondary school students are required to take the same exams every year. As a result,
this facilitates comparisons between schools. The raw files contained obtained observations on
individual student performance on CSEC examinations in Barbados for various years. As
indicated earlier, grades on CSEC take numerical values ranging from 1 to 6. The average
student performance for each school is therefore calculated as mean CSEC grades in English,
Mathematics and the average in all other CSEC courses taken. For expositional purposes, the
average CSEC grades are inverted so that a higher value indicates better performance. The
lowest possible value for this performance indicator is 0.167, where all students in the school
received the lowest grade possible on CSEC examinations, while the highest possible value is 1,
suggesting that all the students in the school received the maximum possible grade in all of their
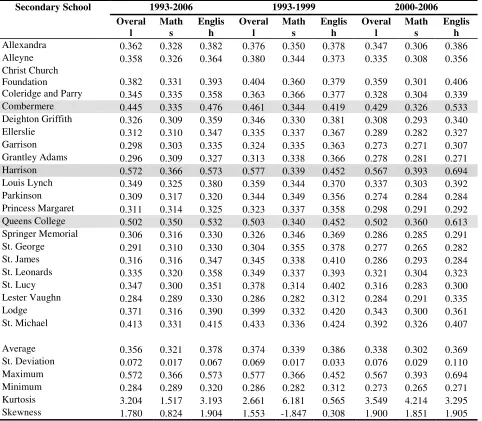
Descriptive statistics for each school‟s performance is provided in Table 1. As expected,
Combermere, Harrison College and Queens College, the top three grammar schools in the island,
had the highest average overall performance over the sample. The superior performance of these
three schools was primarily due to above average performances in English. Average grades in
English for these three schools were approximately 36 greater than the mean for the other
secondary schools. In the case of Mathematics, however, the difference between secondary
schools was not very significant. The standard deviation of average school performance in
Mathematics was 0.017 compared to 0.072 and 0.067 for Overall and English, respectively.
The table also calculates descriptive statistics for two seven-year intervals, 1993-1999 and
2000-2006, to identify any change in performance over time. Average performance of secondary
school students declined somewhat during the 2000-2006 period. Only three schools recorded an
improvement in average performance in Mathematics while seven schools had better average
performance in English examinations. The difference between schools, particularly in English
seems to be rising over time. While the standard deviation of average performance in English
between 1993-1998 was 0.033, by the 2000-2006 period it had risen to 0.110. Evidence of this
divergence of performances in English can also be gleaned by examining the differences between
the average performance of the best and worst schools. The difference between the performance
3.3 Classification
The statistics presented in the previous section provide only a snapshot of secondary school
performance in Barbados. As mentioned earlier, the quality of students admitted to each school
can impact on the evaluation of the performance of secondary schools. Obviously, if
Combermere, Harrison College and Queens College are obtaining the best primary school
students, the average performance of their student rolls in secondary school examinations should
be better on average than other secondary schools. To account for these differences, this study
employs three different criteria to rank schools: (1) absolute performance, (2) relative
performance, and; (3) conditional performance.
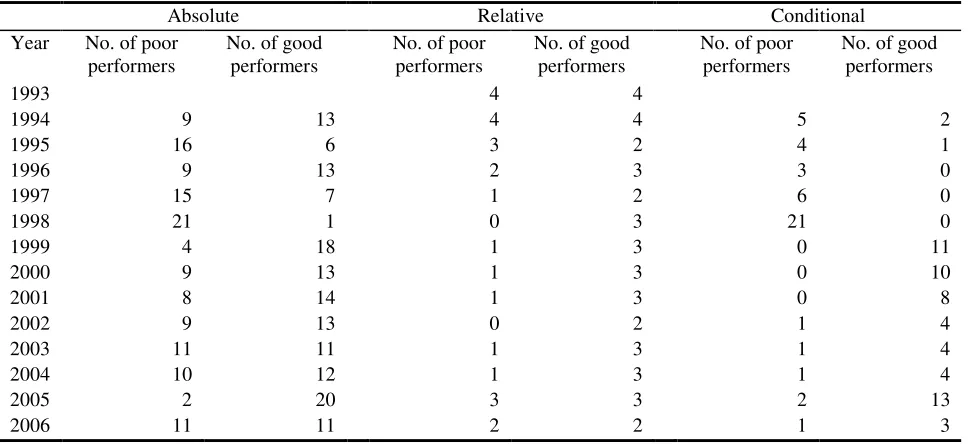
Tables 2-4 present the results of applying the methodological approaches outlined earlier to data
on Barbados‟ secondary school system. The tables provide the number of poor and good
performers for each year based on the three criteria. In general, the tables show that the absolute
performance approach, since it bases achievement on the difference in average grades between
two periods, classifies a larger number of schools as underperformers. All three approaches
presented in Table 2 reveal that there has been a decline in the number of poorly performing
schools over time. In contrast, the relative performance method implies that the number of good
performers has been fairly constant, while the absolute and conditional performance approaches
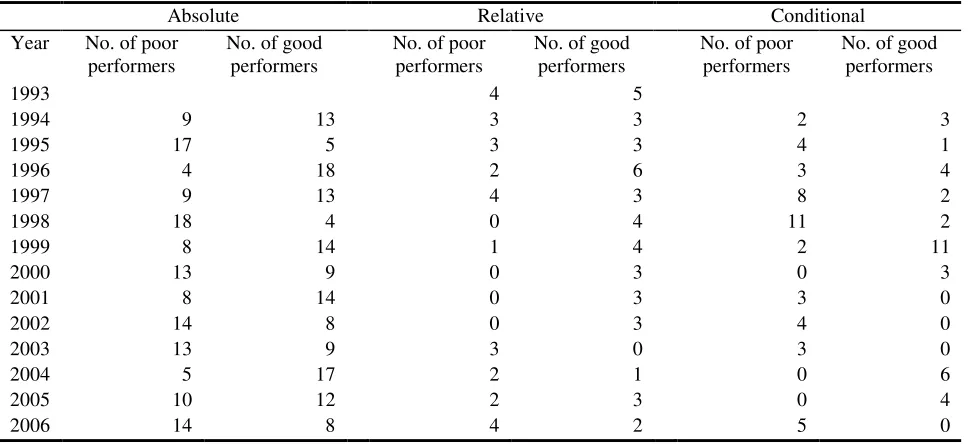
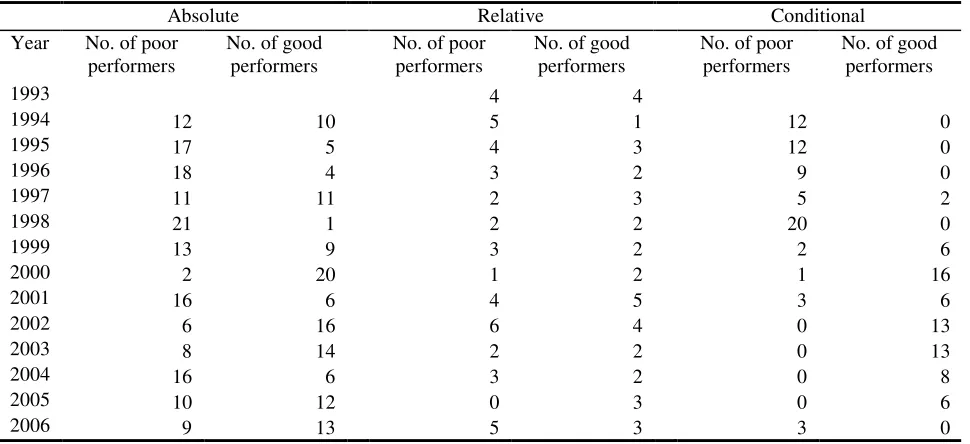
suggests that the number of good performers is rising. Similar results are obtained when average
performance in English and Mathematics examinations is employed (Tables 3 and 4).
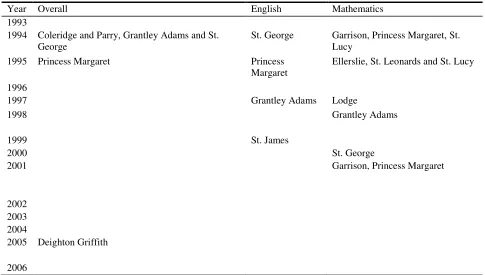
Tables 5 lists the schools classified as poor performers based on all three criteria. Therefore all
standard. There are two main findings that can be gleaned from the table. First, the number of
schools classified as poor performers has been falling over time. Second, no single school
consistently appears on the list every year. This indicates that those schools listed as poor
performs have done an adequate job of ensuring that their performance does not remain below
standard. It is noteworthy that no schools were classified as poor performers in English and
Mathematics since 2001.
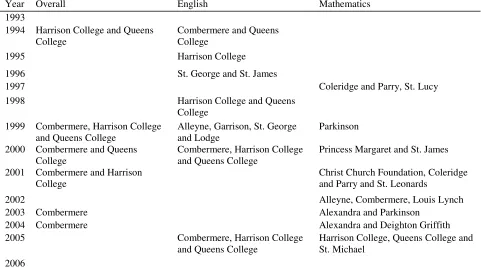
The schools identified as good performers are listed in Table 6. In terms of overall performance,
Harrison College, Queens College and particularly Combermere consistently appear on the list of
good overall performers. In terms of performance on English examinations, the three top schools
are again consistently on the list, but other schools such as St. George, St. James, Alleyne,
Garrison and Lodge also appear on the list in various years throughout the review period. The
performance of the top three schools deteriorates somewhat when one examines the list of top
performers in Mathematics. Harrison College, Queens College and Combermere only appear on
the list once over the 13 year period. In contrast, Coleridge and Parry, Parkinson, Alexandra and
Parkinson all appear on the list more than once.
4. Conclusions
The main goal of this study was to outline a relatively simple approach to identify
underperforming schools. The approach outlined and illustrated in this study can be employed in
techniques, eliminating any bias that may occur from differences in student backgrounds and the
examinations employed to evaluate schools in each district.
The paper utilises three criteria to identify poorly performing schools: (1) absolute
underperformance; (2) relative underperformance, and; conditional underperformance. Absolute
underperformance occurs when the school experiences a decline in average grades, relative
underperformance when the average level of performance is more than one standard deviation
below the mean level of performance for all schools and conditional underperformance arises
when performance was one standard deviation below that expected given the initial level of the
performance indicator.
The criteria outlined above were applied to the Barbadian secondary school system over the
period 1993 to 2006. In general, the absolute performance approach classifies a larger number of
schools as underperformers, while the relative and conditional performance methods only
identify those schools that have significantly different levels of performance relative to their
peers. The approach provides fairly consistent results over different indicators of performance:
Overall, English and Mathematics.
Using all three indicators, the number of schools classified as poor performers in Barbados has
been falling over time. In terms of overall performance, the three top schools dominate the list of
good performers, but have a less stellar performance in Mathematics. Harrison College, Queens
College and Combermere only appear on the list once over the 13 year period. In contrast,
References
Barro, R.J. and Sala-i-Martin, X. (2004). Economic Growth. MIT Press, Cambridge, MA.
Department for Education and Skills (2006). Publication of 2006 Test and Examination Results
in the School and College Achievement and Attainment Tables. UK.
Krueger, A.B. and Lindahl, M. (2001). “Education for Growth: Why and For Whom?” Journal
of Economic Literature, Vol. 39, pp. 1101-1136.
Lucas, R. (1988). “On the Mechanics of Economic Development,” Journal of Monetary
Economics, Vol. 22, pp. 3-42.
McDonald, B. (2002). “Self Assessment Skills Used by High School Students without Formal
Training,” School Psychology International, Vol. 23, pp. 416-424.
Morrissey, O. and Anderson, E. (2006). “A Statistical Approach to Identifying Poorly
Performing Countries,” Journal of Development Studies, Vol. 42, pp. 469-489.
Sala-i-Martin, X., Doppelhofer, G. and R. Miller (2004). “Determinants of long-Term Growth: A
Bayesian Averaging of Classical Estimates (BACE) Approach,” American Economic
Review, Vol. 94, pp. 813-835.
Romer, P. (1990). “Human Capital and Growth: Theory and Evidence,” Carnegie-Rochester
Conference Series on Public Policy, Vol. 32, pp. 251-286.
Torres, M. (1988). “Experimental Migration Survey (Barbados),” International Development
Research Centre, Ottawa, Canada.
US Department of Education (2005). No Child Left Behind Act of 2001 Annual Report to
Table 1: Average School Performance in Barbados
Secondary School 1993-2006 1993-1999 2000-2006
Overal l Math s Englis h Overal l Math s Englis h Overal l Math s Englis h
Allexandra 0.362 0.328 0.382 0.376 0.350 0.378 0.347 0.306 0.386 Alleyne 0.358 0.326 0.364 0.380 0.344 0.373 0.335 0.308 0.356 Christ Church
Foundation 0.382 0.331 0.393 0.404 0.360 0.379 0.359 0.301 0.406 Coleridge and Parry 0.345 0.335 0.358 0.363 0.366 0.377 0.328 0.304 0.339 Combermere 0.445 0.335 0.476 0.461 0.344 0.419 0.429 0.326 0.533 Deighton Griffith 0.326 0.309 0.359 0.346 0.330 0.381 0.308 0.293 0.340 Ellerslie 0.312 0.310 0.347 0.335 0.337 0.367 0.289 0.282 0.327 Garrison 0.298 0.303 0.335 0.324 0.335 0.363 0.273 0.271 0.307 Grantley Adams 0.296 0.309 0.327 0.313 0.338 0.366 0.278 0.281 0.271 Harrison 0.572 0.366 0.573 0.577 0.339 0.452 0.567 0.393 0.694 Louis Lynch 0.349 0.325 0.380 0.359 0.344 0.370 0.337 0.303 0.392 Parkinson 0.309 0.317 0.320 0.344 0.349 0.356 0.274 0.284 0.284 Princess Margaret 0.311 0.314 0.325 0.323 0.337 0.358 0.298 0.291 0.292 Queens College 0.502 0.350 0.532 0.503 0.340 0.452 0.502 0.360 0.613 Springer Memorial 0.306 0.316 0.330 0.326 0.346 0.369 0.286 0.285 0.291 St. George 0.291 0.310 0.330 0.304 0.355 0.378 0.277 0.265 0.282 St. James 0.316 0.316 0.347 0.345 0.338 0.410 0.286 0.293 0.284 St. Leonards 0.335 0.320 0.358 0.349 0.337 0.393 0.321 0.304 0.323 St. Lucy 0.347 0.300 0.351 0.378 0.314 0.402 0.316 0.283 0.300 Lester Vaughn 0.284 0.289 0.330 0.286 0.282 0.312 0.284 0.291 0.335 Lodge 0.371 0.316 0.390 0.399 0.332 0.420 0.343 0.300 0.361 St. Michael 0.413 0.331 0.415 0.433 0.336 0.424 0.392 0.326 0.407
Table 2: Number of Poor Performers and Good Performers Overall
Absolute Relative Conditional Year No. of poor
performers
No. of good performers
No. of poor performers
No. of good performers
No. of poor performers
No. of good performers
1993 4 4
1994 9 13 4 4 5 2
1995 16 6 3 2 4 1
1996 9 13 2 3 3 0
1997 15 7 1 2 6 0
1998 21 1 0 3 21 0
1999 4 18 1 3 0 11
2000 9 13 1 3 0 10
2001 8 14 1 3 0 8
2002 9 13 0 2 1 4
2003 11 11 1 3 1 4
2004 10 12 1 3 1 4
2005 2 20 3 3 2 13
Table 3: Number of Poor Performers and Good Performers in English
Absolute Relative Conditional Year No. of poor
performers
No. of good performers
No. of poor performers
No. of good performers
No. of poor performers
No. of good performers
1993 4 5
1994 9 13 3 3 2 3
1995 17 5 3 3 4 1
1996 4 18 2 6 3 4
1997 9 13 4 3 8 2
1998 18 4 0 4 11 2
1999 8 14 1 4 2 11
2000 13 9 0 3 0 3
2001 8 14 0 3 3 0
2002 14 8 0 3 4 0
2003 13 9 3 0 3 0
2004 5 17 2 1 0 6
2005 10 12 2 3 0 4
Table 4: Number of Poor Performers and Good Performers in Mathematics
Absolute Relative Conditional Year No. of poor
performers
No. of good performers
No. of poor performers
No. of good performers
No. of poor performers
No. of good performers
1993 4 4
1994 12 10 5 1 12 0
1995 17 5 4 3 12 0
1996 18 4 3 2 9 0
1997 11 11 2 3 5 2
1998 21 1 2 2 20 0
1999 13 9 3 2 2 6
2000 2 20 1 2 1 16
2001 16 6 4 5 3 6
2002 6 16 6 4 0 13
2003 8 14 2 2 0 13
2004 16 6 3 2 0 8
2005 10 12 0 3 0 6
Table 5: Poorly Performing Schools
Year Overall English Mathematics 1993
1994 Coleridge and Parry, Grantley Adams and St. George
St. George Garrison, Princess Margaret, St. Lucy
1995 Princess Margaret Princess Margaret
Ellerslie, St. Leonards and St. Lucy
1996
1997 Grantley Adams Lodge
1998 Grantley Adams
1999 St. James
2000 St. George
2001 Garrison, Princess Margaret
2002 2003 2004
2005 Deighton Griffith
Table 6: Good Performing Schools
Year Overall English Mathematics 1993
1994 Harrison College and Queens College
Combermere and Queens College
1995 Harrison College 1996 St. George and St. James
1997 Coleridge and Parry, St. Lucy
1998 Harrison College and Queens College
1999 Combermere, Harrison College and Queens College
Alleyne, Garrison, St. George and Lodge
Parkinson
2000 Combermere and Queens College
Combermere, Harrison College and Queens College
Princess Margaret and St. James
2001 Combermere and Harrison College
Christ Church Foundation, Coleridge and Parry and St. Leonards
2002 Alleyne, Combermere, Louis Lynch 2003 Combermere Alexandra and Parkinson
2004 Combermere Alexandra and Deighton Griffith 2005 Combermere, Harrison College
and Queens College
Harrison College, Queens College and St. Michael