Pressure Swing Distillation Simulation and Optimization
of Azeotropic IBA + IBAc Mixture
A. M. Patwardhan
S. P. Shirsat
S. D. Dawande
Department of Chemical Engineering, Laxminarayan Institute of Technology, Nagpur, Maharashtra, India
ABSTRACT
The present work is to simulate and analyze pressure-swing distillation process for azeotropic IBA-IBAc separation using CHEMCAD simulation software. The total number of feed plates, reflux ratio in first column and total number of plates, operating pressure and the feed stream concentration of IBA for the second column are varied to find the optimum feed plate location, to get the desired output i.e. 99.5 mol % IBAc and 98.5 mol % IBA as bottoms from the first and second column respectively, which gives the minimum total heat duty.
General Terms
Simulation, OptimizationKeywords
Pressure-swing distillation, Simulation, azeotrope, activity coefficient, IBA (Isobutyl Alcohol), IBAc (Isobutyl Acetate).
1.
INTRODUCTION
Isobutyl acetate (IBAc) is widely used in chemical industry as a solvent for coatings, inks, adhesives, industrial cleaners, degreasers etc[1]. IBAc is produced esterification of acetic acid and isobutyl alcohol (IBA). The IBA+ IBAc mixture exhibits minimum boiling azeotrope at atmospheric pressure making the purification of acetate by traditional technologies a relatively complex procedure.
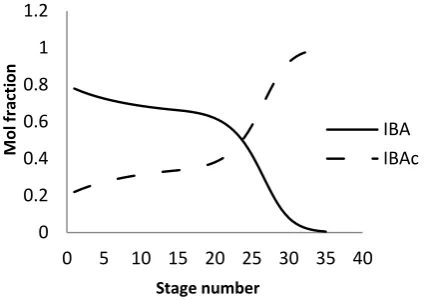
[image:1.595.323.536.198.348.2]Separation of azeotropes is difficult and expensive. There are different techniques used for the separation of IBA- IBAc like azeotropic and extractive distillation[2,3,4], reactive distillation[5], liquid–liquid extraction, adsorption, membrane pervaporation[6], salt addition and pressure-swing distillation[1,7]. Azeotrope is pressure dependent. Pressure swing distillation makes use of this well known fact. An azeotrope is a point at which the activity coefficients of the components in the mixture cross each other. In pressure-swing distillation this point is jumped over. The HVC comes out as distillate while LVC as bottom since the activity coefficients are crossed. The IBA-IBAc mixture is distilled in first column at atmospheric pressure and the distillate is sent to a second column operating at lower pressure so that the azeotrope is jumped over and the distillation continues. In the high pressure column (HPC) IBA (MVC) comes out as distillate and IBAc (LVC) in the bottoms, but in the low pressure column (LPC), since the activity coefficients are crossed the IBAc goes to distillate while IBA to the bottoms. Ti\his can be seen from Figure 1 and 2 which give the variation of mol fractions on each stage in both the columns.
[image:1.595.318.544.391.544.2]Fig 1: Mole fraction of IBA and IBAc at each stage in the HPC.
Fig 2: Mole fraction of IBA and IBAc at each stage in the LPC.
2.
SIMULATION
2.1
Description of the Problem
The schematic of the process is as shown in Figure 3. Mixture of IBA + IBAc (50 mol % IBAc) is fed to the high pressure column (HPC) operating at 101.325 KPa with flow rate of 16 Kmol/hr. The overhead product of the HPC rich in IBA is fed to a second column operating at low pressure i.e. 20 KPa (LPC). The distillate from the LPC is recycled back. The objective is to get bottom product from the HPC 99.5 mol % IBAc and that from LPC 98.5 mol % IBA. The total number of plates, reflux ratio in first column and total number of plates, operating pressure and the feed stream concentration of IBA
0 0.2 0.4 0.6 0.8 1 1.2
0 5 10 15 20 25 30 35 40
M
o
l f
rac
ti
o
n
Stage number
IBA IBAc
0 0.2 0.4 0.6 0.8 1 1.2
0 5 10 15 20
Mo
l
frac
ti
o
n
s
Stage number
IBA
Fig 3: Distillation sequence
for the second column are varied to find the optimum feed plate location, to get the desired output i.e. 99.5 mol % IBAc and 98.5 mol % IBA as bottoms from the first and second column respectively, which gives the minimum total heat duty. The process is run in CHEMCAD V6.2, using NRTL thermodynamic model.
2.2
Sequencing of the Pressure-Swing
Distillation Process
Figure 3 shows the pressure-swing sequence for the separation of IBA from IBAc. The feed enters the high pressure distillation column at 101.3 kPa and the distillate of this column has a composition that approaches the high pressure azeotrope. This distillate is the feed stream to the low pressure column at 20 kPa, and distillate has a composition that approaches the low pressure azeotrope. This distillate has a composition that is similar to the feed composition and it is recycled to mix with the feed to HPC. High purity IBAc (99.5 mole %) is produced as a bottom stream from the HPC and IBA (98.5 mole%) is produced as a bottom stream from the LPC. The variation of azeotropic composition with pressure for IBAc is as shown in figure 4.
Fig 4: IBAc mole fraction and temperature of the azeotrope as a function of pressure.
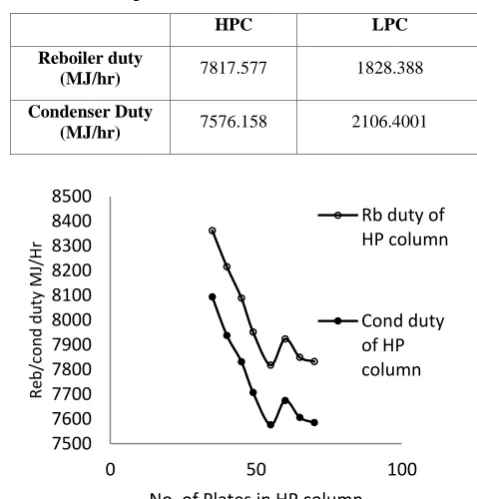
plate location for which the reboiler and condenser duties are minimum is found. The condenser and reboiler duties initially decrease with increase in number of plates reach a minimum value and then start increasing. Also the duties go through a minimum when the feed location is changed in both of the columns.
[image:2.595.305.544.401.651.2]The total number of plates 55 with feed plate location 23 gives the minimum duties as given in Table 1.
Table 1. Optimum Reboiler and Condenser Duties
HPC LPC
Reboiler duty
(MJ/hr) 7817.577 1828.388 Condenser Duty
[image:2.595.60.285.533.707.2](MJ/hr) 7576.158 2106.4001
Fig 5: Variation in reboiler and condenser duties of HPC with number of plates in HPC
40 50 60 70 80 90 100 110 120
0 0.2 0.4 0.6 0.8 1
0 20 40 60 80 100 120
x
azeotr
o
p
ic
(IBA
c)
Pressure KPa
Te
m
p
K 7500 7600
7700 7800 7900 8000 8100 8200 8300 8400 8500
0 50 100
R
eb
/c
o
n
d
d
u
ty
MJ/H
r
No. of Plates in HP column
Rb duty of HP column
Fig 6: Variation in reboiler and condenser duties of LPC with number of plates in HPC
The variation in the reboiler and condenser duties is as shown in the graph Figure 5 and 6.
2.3
Variation in Reflux Ratio in HPC
The reflux ratio in HPC is varied from 1 to 8 keeping every other parameter constant and the optimum feed plate location for which the total heating and cooling duties are minimum is found. In the HPC reboiler and condenser duties increase with increase in the reflux ratio, while in the LPC theses values decrease go through a minimum and start increasing with the variation in the reflux ratio. The total heating and cooling duties decrease with increase in the reflux ratio and reach a minimum value and then start increasing.
[image:3.595.319.547.75.249.2]The reflux ratio of 2.5 with feed plate location 16 gives the minimum duties as given in Table 2.
Table 2. Optimum Total Duties
HPC LPC
Heating Cooling Total Duty
(MJ/hr) 8660.06
8693.03
The variation in total heating and cooling duties is as shown in the graph Figure 7 and 8.
Fig 7: Variation of total heating duties with reflux ratio in the HPC
Fig 8: Variation of total cooling duties with reflux ratio in the HPC
2.4
Variation in Number of plates in LPC
The total number of plates in LPC is varied from 13 to 50 keeping every other parameter constant and the optimum feed plate location for which the reboiler and condenser duties are minimum is found. The condenser and reboiler duties initially decrease with increase in number of plates reach a minimum value and then start increasing. Also the duties go through a minimum when the feed location is changed in both of the columns. The variation in the reboiler and condenser duties is as shown in the graph Figure 9 and 10.
[image:3.595.310.546.420.706.2]The minimum duties are given in Table 3.
Table 3. Optimum Reboiler and Condenser Duties
HPC LPC
Reboiler duty
(MJ/hr) 6683.5283 1427.6591 Condenser Duty
(MJ/hr) 6471.3936 1665.4272
Fig 9: Variation in reboiler and condenser duties of HPC with number of plates in LPC
1500 1600 1700 1800 1900 2000 2100 2200 2300 2400
0 50 100
R
eb
/Co
n
d
d
u
ty
MJ/H
r
No. of Plates in HP Column
Reb duty of LP column
Cond duty of LP column
0 2000 4000 6000 8000 10000 12000 14000
0 2 4 6 8 10
To
tal
H
eati
n
g
Du
ty
MJ/H
r
Reflux ratio in HP column
0 2000 4000 6000 8000 10000 12000 14000
0 5 10
To
tal
Co
o
lin
g D
u
ty
M
J/Hr
Reflux ratio in HP column
0 2000 4000 6000 8000 10000 12000
0 20 40 60
R
eb
/Co
n
d
Du
ty MJ/H
r
No. of Plates in LP column
[image:3.595.50.288.444.509.2] [image:3.595.57.280.537.716.2]Fig 10: Variation in reboiler and condenser duties of LPC with number of plates in LPC
2.5
Variation in Operating Pressure in the
LPC
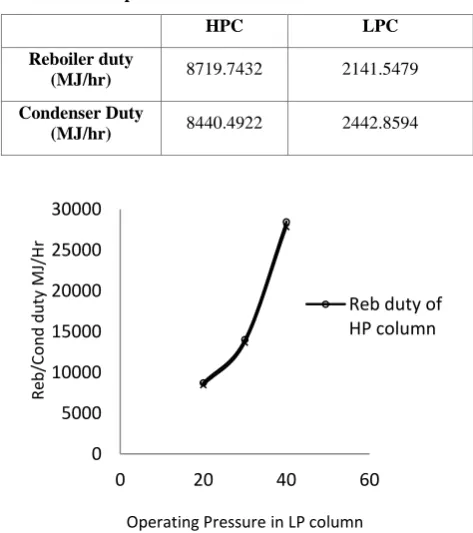
The operating pressure in the LPC is varied from 20 to 40 keeping every other parameter constant and the optimum feed plate location for which the reboiler and condenser duties are minimum is found. The reboiler and the condenser duties increase with increase in the operating pressure for both the columns.The variation in the reboiler and condenser duties is as shown in the graph Figure 11 and 12.
[image:4.595.318.550.76.246.2]The operating pressure of 20 KPa with feed plate location 19 gives the minimum duties as given in Table 4..
Table 4. Optimum Reboiler and Condenser Duties
HPC LPC
Reboiler duty
(MJ/hr) 8719.7432 2141.5479 Condenser Duty
(MJ/hr) 8440.4922 2442.8594
Fig 11: Variation in reboiler and condenser duties of HPC with operating pressure in LPC
Fig 12: Variation in reboiler and condenser duties of LPC
with operating pressure in LPC
2.6
Variation in the Mole Fraction of IBA
in the Distillate of the HPC
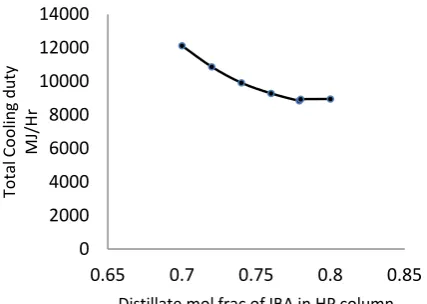
[image:4.595.63.296.77.251.2]The mole fraction of IBA in the distillate of HPC is varied from 0.7 to 0.8 keeping every other parameter constant and the optimum feed plate location for which the reboiler and condenser duties are minimum is found. The reboiler and condenser duties of the HPC increase while that of the LPC decreases. The total heat duties for both the columns decrease with the increase in the mole fraction. The variation in the total heating and cooling duties is as shown in the graph Figure 13, 14. The mol fraction of IBA of 0.779 with reflux ratio 2.76 in the first column gives the minimum duties as given in Table 5.
Table 5. Optimum Total Duties
HPC LPC
Heating Cooling Total Duty
(MJ/hr) 8828.1 8839.4
Fig 13: Variation of total heating duties with mol frac of IBA in the distillate of HPC
0 500 1000 1500 2000 2500 3000 3500
0 20 40 60
R
eb
/Co
n
d
Du
ty MJ/H
r
No. of Plates in LP column
Reb duty of LP column
Cond duty of LP column
0 5000 10000 15000 20000 25000 30000
0 20 40 60
R
eb
/Co
n
d
d
u
ty
MJ/H
r
Operating Pressure in LP column
Reb duty of HP column
0 2000 4000 6000 8000 10000 12000
0 20 40 60
Re
b
/Co
n
d
d
u
ty
M
J/Hr
Operating Pressure in LP column
Reb duty of LP column Cond duty of LP column
0 2000 4000 6000 8000 10000 12000 14000
0.65 0.7 0.75 0.8 0.85
To
tal
He
ati
n
g
D
u
ty
M
J/Hr
[image:4.595.48.285.430.697.2] [image:4.595.311.547.440.697.2]Fig 14: Variation of total cooling duties with mol frac of IBA in the distillate of HPC
3.
CONCLUSION
The simulation of processes with a commercial software program (CHEMCAD) used appropriately is a very powerful tool to analyze the variation in different operating parameters of the distillation scheme. When applied to the study of the separation of IBA+ IBAc azeotropic mixture, using NRTL model with the values of the binary parameters obtained by us, it has produced satisfactory results.
The data obtained and the results can be further used to study the economical optimization of the pressure swing distillation scheme for the IBA + IBAc system. These data can also be used to compare pressure swing distillation with other types like extractive distillation for the same system. With this work it can be concluded that the pressure swing distillation can prove to be a very good option for the separation of azeotropic mixtures.
4.
REFERENCES
[1] Mu˜noz, R., Mont´on, J.B., Burguet, M.C., & Torre, J. de la. 2006. Separation of Isobutyl Alcohol and Isobutyl Acetate by Extractive Distillation and Pressure-Swing Distillation: Simulation and optimization. Separation and Purification Technology, 50, 175–183.
[2] Doherty, M., & Malone, M. 2001. Conceptual Design of Distillation Systems, New York, McGraw-Hill.
[3] Lei, Z., Li, C., & Chen, B. 2003. Extractive Distillation: A Review. Separation and Purification Reviews. 32 (2), 121-213.
[4] Klein, A. 2008. Azeotropic Pressure Swing Distillation. Doctoral Thesis, Prozesswissenschaftender Technischen Universität Berlin.
[5] Maier, R., Brennecke, J., & Stadtherr, M. 2000. Reliable computation of reactive azeotropes. Comput. Chem. Eng. 24, 1851–1858.
[6] Fleming, H. 1992. Consider membrane pervaporation. Chem. Eng. Prog. 88 (7), 46–52.
[7] Frank, T. 1997. Break Azeotropes With Pressure Sensitive Distillation. Chem. Eng. Prog. 52–63.
[8] Ehrenmann, J. 2008. Synthesis of isobutyl acetate (cherry, raspberry, strawberry). Practical course in organic chemistry. D CHAB, ETH Zurich
[9] Hilmen, K. 2000. Separation of Azeotropic Mixtures: Tools for Analysis and Studies on Batch Distillation Operation. Doctoral Thesis, Norwegian University of Science and Technology.
[10]Mu˜noz R., Mont´on J.B., Burguet M.C., & Torre, J. de la; 2005. Phase equilibria in the Ternary System isobutyl alcohol + isobutyl acetate + 1-hexanol and binary systems System isobutyl alcohol + 1-hexanol, System isobutyl acetate + 1-hexanol at 101.3 KPa. Fluid Phase Equilibria, 235, 64–71.
0 2000 4000 6000 8000 10000 12000 14000
0.65 0.7 0.75 0.8 0.85
To
tal
Co
o
lin
g d
u
ty
MJ/H
r