Automatic Detection and Classification of Diabetic
Retinopathy Lesion Using Bag of Visual Words
Model
C.Jagatheesh M.E.
1, C.Jenila M.E.
21
Computer Science and Engineering, Principal, Surya Polytechnic College,Tamil Nadu, India. 2
Electronics and Communication Engineering, Tamil Nadu, India.
Abstract— Diabetic Retinopathy (DR) is a complication of diabetes that affects the eyes. It's caused by damage to the blood vessels of the light sensitive tissue at the back of the retina. The success rate of its curability solemnly depends on the early stage diagnosis or else it will lead to blindness. DR lesions are detected using Bag Of Visual Words (BoVW) model. Features are extracted using Speeded Up Robust Features (SURF).K-Means clustering is used for creating visual dictionary. Fisher vector encoding and Max pooling technique is used for creating Bag of Visual Words (BOVW). Finally SVM is used for lesion classification.
Index Terms— Bag of visual words, Diabetic retinopathy, Encoding, Lesion detectors, SURF, SVM,Visual dictionary.
1 I
NTRODUCTIONue to modern living style, most of the people are getting affected with Diabetes. The World Health Organization report shows that 135 million people have diabetes and the number of people with diabetes will increase to 300 mil-lion by the year 2025.Diabetic Retinopathy (DR) is a most common Diabetic eye disease, which affects the eyes. It occurs due to damage in the capillaries of the light sensitive tissue at the back of the eye i.e. retina. Even if the person does not have Diabetic Retinopathy itself, diabetes will affect the vision. Rap-id changes in blood sugar alter the shape of eye's lens, and the image on the retina will become out of focus. After blood sug-ar stabilizes, the image will be back in focus.
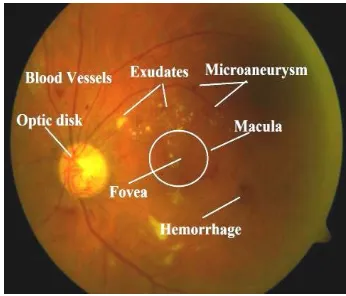
Normal Retinal Fundus image is shown in Fig .1. Due to dia-betic retinopathy characteristics of the blood vessels will change and different parts of the retina get damaged .This creates lesions such as microaneurysms, exudates, and hemor-rhages as shown in Fig. 2. During the initial stage, most people do not notice any change in their vision. This stage is called Non Proliferative Diabetic Retinopathy (NPDR).As the disease progresses, Non Proliferative Diabetic Retinopathy move into the advanced proliferative stage.ie called Proliferative Diabetic Retinopathy (PDR).
Without timely treatment, these new blood vessels can bleed, cloud vision, and destroy the retina. Non Proliferative Diabetic Retinopathy shows up as Cotton Wool pots or as Su-perficial Hemorrhages. It should be monitored with regular checkups otherwise it leads to blindness.
The development of a Automatic Diabetic Retinopathy Detection system that identifies different DR related lesions has been described using a bag-of-visual-words model (BOVW) based upon visual dictionaries [9], [12].Bag of Words (BOW) is a popular approach which transforms local image descriptors into image representations that are used in classifi-cation. To date, a number of encoding techniques such as Soft Assignment [10], Approximate Locality constrained Soft As signment, Sparse Coding [3] have been developed. It is
showed that recently developed Fisher vector encoding [1] technique outperforms the existing encoding technique.
[image:1.612.313.574.366.528.2]Fig.1. Normal Retinal Fundus Image
Fig. 1.Normal Retinal Fundus Image
Fig.2. Retinal Fundus Image Containing DR Lesions
[image:1.612.359.532.564.712.2]
2
PROPOSED
METHODOLOGY
2.1 Proposed Diabetic Retinopathy Lesions Detection Scheme
The proposed DR Lesion detection scheme comprises of three main steps namely Feature extraction, Bag of Visual Words creation and SVM based classification. Diabetic Retinopathy Lesions are detected using a Bag of Visual Words (BoVW) model. These model works by detecting a large number of feature vectors around points of interests in the images and assign these vectors to visual words based on visual diction-ary. Fig. 3. shows the process of detecting the DR lesions. Fea-tures in DR affected images and normal images are extracted using Speeded Up Robust Features.Clustering is done using K-Means Clustering Algorithm for creating a visual diction-ary, representing the normal images and the images with le-sions. After creating the visual dictionary, Fisher Vector En-coding technique is used to create the BoVW features, which feeds a 2 class SVM [9] classifier.
Fig.3.Proposed Lesion Detector
2.2 Feature Extraction
2.2.1 Speeded Up Robust Features (SURF)
Speeded Up Robust Features are used for feature extraction
.
Interest points are selected at different locations in the image, such as corners, blobs. The important property of an interest point detector is its repeatability.Integral Image
The entry of an integral image I∑(x) at a location x = (x, y)
represents the sum of all pixels in the input image I within a rectangular region formed by the origin and image
coordi-nates(x, y).It is given as
(1)
For example, the summation of the shaded region in input image can be calculated using Integral image.
Fig.4.Input Image
Every pixel in an integral image is the summation of the pixels above and to left of it. Once the integral image has been computed, it takes three additions to calculate the sum of the intensities over any rectangular area. The summation of the shaded region in input image Fig.4 can be calculated using four reference values of the rectangular region in the corre-sponding integral image shown in Fig.5. The calculation be-comes 46 – 22 – 20 + 10 = 14. It subtracts the regions above and to the left of the shaded region. The area of overlap is added back to compensate for the double subtraction
Fig.5. Integral Image
Hessian Matrix
defined as
(2)
LXX (X,σ) is the convolution of Integral image with the
second derivative of the Gaussian kernel
.
(3)
Determinant of the Hessian matrix is used to select the scale. A 9x9 Gaussian kernel is used.
Orientation Assignment
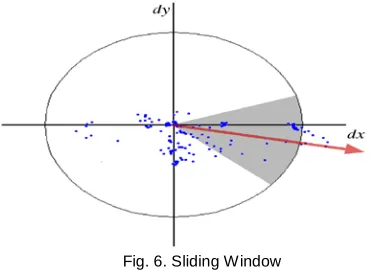
Sliding window of size п/3 is shown in Fig. 6. Sliding win-dow of size п/3 is used to find the orientation of interest point along the scale. Haar wavelet responses in x and y direction within a circular neighbourhood of radius 6s around the inter-est point is calculated. The wavelet response in x and y direc-tion is referred as dx and dy respectively. The horizontal and vertical responses within the window are summed. The two summed responses gives a local orientation vector. The largest such vector over all windows gives the orientation of the in-terest point.
[image:3.612.348.575.118.306.2]
Fig. 6. Sliding Window
SURF Descriptor
The first step consists of constructing a square region centred around the interest points. The size of the square region is 20s.The region is split into 4x4 sub regions. For each sub re-gion, Haar wavelet response is calculated at 5x5 regularly spaced sample points. The Haar wavelet response in x and y direction is referred as dx and dy respectively.|dx| and |dy| gives the polarity of the intensity changes. Four dimensional descriptor vector v is calculated for all sub regions using the equation (4).
(4)
Concatenating this for all 4 x 4 sub regions, gives a descriptor vector of length 64.
2.2.2 Bag Of Visual Words Creation
a) K-Means Clustering
The K-means algorithm is the most popular and one of the
simplest clustering algorithm. It follows simple iterative steps to classify entire data set into some fixed number of clusters (assume k).
Fig. 7. K-Means Principle
K-Means: Setup
1. Initialize K cluster centers
2. It computes the Euclidean distance from each of the feature vector to cluster centre and assigns them to the cluster with the smallest distance
3. Recalculate the k new cluster centres as the Centroid 4. Repeat steps (2) and (3) until the convergence is
reached.
5. Dissimilarity measure: Euclidean distance Euclidean distanceis the distance between two points in Euclidean Space
The associated norm is called the Euclidean norm.
(5)
Where X1, X2,…,XN is the vector of observation. C(i) is the cluster number.mk is the cluster center. k-means algorithm classify each member of a given set of input data into given number of clusters. Fig.8. explains the concept of clustering. K-means Algorithm find the distances between samples and cluster centres. Based on the minimum distance it performs the clustering. First step distributes samples into the clusters, second step update cluster centers. Each sample is assigned to the cluster, which centre is the nearest in given metric. Up-dation of cluster centres is performed by computing arithme-tic mean value of all the samples belonging to the cluster. These two steps are performed iteratively until no changes in positionof the cluster centres.
=
)
,
(
)
,
(
)
,
(
)
,
(
)
,
(
σ
σ
σ
σ
σ
x
x
x
x
X
H
L
L
L
L
yy xy xy xx)
(
*
)
,
(
2 2)
(
σ
σ
g
X
X
I
x
L
xx∂
∂
=
(
∑ ∑ ∑ ∑
)
=
dx
dy
dx
dy
V
,
,
,
N
i
m
x
i
C
K k ki
,
1
,
,
[image:3.612.67.252.371.506.2]Fig .8.K-Means Clustering
b) Coding and Pooling
Visual dictionary is created using k-means clustering algo-rithm. Centroids of the clusters are used as the visual words in the dictionary. Once the Visual dictionary is created it can be represented as The size of the dictionary is 500.
C=C{i}, where i=1,2,…,M.
M is the size of the dictionary, and the dictionary size is 500. The coding step creates the BoVW feature vector
Fisher Vector Encoding
FV uses Mixture of Gaussians as a dictionary. K compo-nents θ=θ1,θ2,……..,θK=((w1,m1,σ1)…..(wk,mk,σk)) are used each
consisting of mixing probability, mean, and standard devia-tion. First and second order statistics are determined using the following equation.
(6)
Concatenation of per cluster statistics forms the midlevel feature.
(7)
Where Фk is given as
(8)
expression p(mk|x,θ) is the membership probability of mean
mkbeing selected given descriptor x and parameters θ.
Pooling
Pooling is the process of aggregating several local descriptor encodings into a single representation. Pooling is typically achieved by either summing/averaging or by taking the ma x-imum response. The pooling step takes place after the coding. g:{αj}; j= 1,2,…,N. (9)
αj represents the codeword assigned to the local feature
vec-tor xj
Max Pooling
Max pooling [2] selects the largest value among the mid level features corresponding to visual words.
g({αj})=Z ; Zm =Max(αmj)
(10)
Z be the final Bag Of Visual Words (BOVW) vector repr e-sentation, this will be given to the Support Vector (SVM) sifier.The encoded output is finally given to the SVM for clas-sification.
2.2.3 Support Vector Machine (SVM)
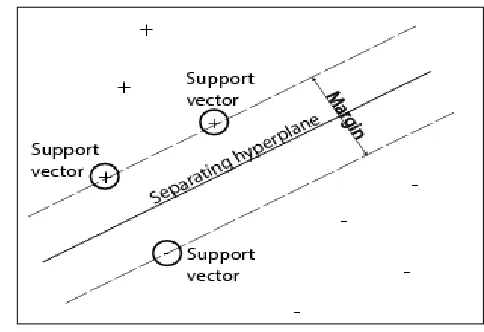
Support Vector Machine is a powerful methodology for solv-ing problems in non linear Classification. Support vector ma-chine (SVM) is used when data has exactly two classes. Prin-ciple of SVM is given in Fig .8. SVM classifies data by finding the best hyper plane that separates all data points of one class from those of the other class. The best hyper plane for an SVM means the one with the largest margin between the two clas-ses. Margin is the maximal width of the slab parallel to the hyper plane that has no interior data points. Support vectors are the data points that are closest to the separating hyper plane. These points are on the boundary of the slab. ‘+’ indi-cate data points of type 1, and ‘-’indiindi-cate data points of type – 1
.
[image:4.612.328.570.346.512.2]
Fig.9. SVM principle
1) Mathematical Formulation
The data for training is a set of points xi along with
their label yi. yi = ‘ 1’or ‘-1’.
The equation of a hyper plane is
(11)
w is called the weight vector and b is the bias.
Assume that all data is at least distance 1 from the hyper plane, then the it follows the two constraints given below for a training set {(xi, yi)}
(12)
(13)
0
)
(
w
Tx
i+
b
=
1
1
)
(
i+
≥
i=
T
y
if
b
x
w
1
1
)
(
i+
≤
−
i=
−
T
y
if
b
SVM classifies the given data points into two groups. The data points greater than ‘1’ are classified into one type of class and the data points less than ‘-1’ are classified into another class. yi
represents label of each class.
The best solution for w and b enables a classification using the following equation.
(14)
The given data point is classified into class 1 or class2 accord-ing to the equation (14)
3
PERFORMANCE
M
EASURESVM is trained using DR1 dataset and tested using DR2 da-taset. The terms used to measure the test performance are true positive (TP), true negative (TN), false positive (FP), false neg-ative (FN).
The performance measures are given by
4
RESULTS
ANDD
ISCUSSIONTo evaluate the performance of the proposed system, perfor-mance measures such as sensitivity, specificity and accuracy are calculated. Dataset DR1 is used for training and DR2 da-taset is used for testing. Totally 250 Samples were taken from the dataset.100 images are used for training and 150 images are used for testing. Then the SVM classifier is trained with training data set.
4.1 Database
Two different datasets, DR1 and DR2, were used. It has 1077 retinal images with resolution of 640x480 pixels. Of which 595 images are normal and 482 images have at least one disease, 234 images contain hard exudates, 139 images contain drusen, 73 images contain cotton wool spots ,102 Image contain Super-ficial Hemorrhages ,146 Deep Hemorrhages and 180 images contain red lesions.
Dataset DR2 has 520 images with resolution of 867x575 pix-els. Among the 520 images, 300 are normal and 149 have at least one lesion, 79 images contain hard exudates, 98 images has red lesions, 50 images contain drusen and17 images con-tain cotton wool spots.
4.2 INTEREST POINTS DETECTION AND FEATURE EXTRACTION
Speeded Up Robust Features (SURF) [15] is used to detect the
points of interest (POI) in the images .Using a training image samples two sets of SURF features are extracted from normal and abnormal images. SURF is a Sparse feature extraction method, where interest points detectors are used to identify structures such as corners and blobs.Features are extracted From image patch around interest points. It can describe ob-jects richly than SIFT. Fig .10shows the features Extracted us-ing SURF.
Fig.10. Input Image (Normal)
Fig.11.Interest points detection and Feature Extraction(Normal)
Fig.12. Input Image (Hard Exudates)
Fig.13.Interest points detection and Feature Extraction (Hard Exudates)
More number of features can be detected using SURF.SURF has less computational complexity than SIFT.
4.3 Bag Of Visual Word Creation and Classification
K-Means Clustering is done for creating visual dictionary. The size of the dictionary is 500.Using fisher vector encoding BoVW features are created. Finally SVM classifier is used for classification, which will classify the image into normal and abnormal image based on the BoVW features. The images with lesions are abnormal and images without lesions are Normal.
)
(
)
(
x
sign
w
x
b
TABLE 1
ACCURACY COMPARISON BETWEEN SURF+SOFT ASSIGNMENT
ENCODING AND SURF+FISHER VECTOR ENCODING TECHNIQUE
The Accuracy obtained for each Lesion Detector is given in Table 1.
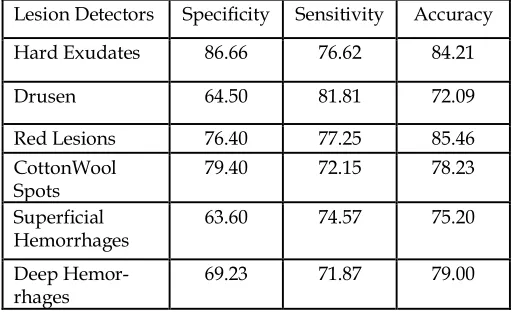
TABLE 2
PERFORMANCE MEASURE USING SURF+FISHER VECTOR
ENCODING TECHNIQUE
The Results shows that Fisher vector Encoding technique gives better performance than soft Assignment Encoding.
From this Results It is found that Fisher vector Encoding technique gives high Lesion classification Accuracy.
5
C
ONCLUSIONDiabetic Retinopathy is caused by complications of diabetes mellitus, which eventually lead to blindness. It affects up to 80% of all patients who have diabetes for 10 years or more. SURF is used to detect the points of interest in the image and
Features are extracted around interest points using SURF.K-Means clustering is done for creating visual dictionary. Fisher vector encoding technique and MAX pooling is used for creat-ing Bag of Visual words. Features selected were passed into the support vector machine (SVM) classifier which classifies the images into normal and abnormal. Six Lesion detectors such as Hard Exudates, Drusen, Red Lesions, Cotton Wool Spots, Superficial Hemorrhages and Deep Hemorrhages were considered. Performance Evaluation was done. The Results shows that Lesion classification Accuracy is improved using Fisher vector Encoding technique.
R
EFERENCES[1] C.Ivo Everts, Jan van Gemert, Theo Gevers and Thomas Men-sink, “Robustifying Descriptor Instability Using Fisher Vectors”, IEEE Transactions On Image Processing, Vol. 23, No.12, pp. 5698 – 5706, Dec. 2014.
[2] N.Murray, F. Perronnin,“Generalised Max Pooling”, IEEE Con-ference On Computer Vision and Pattern Recognition, pp. 2473 - 2480, Jun.2014.
[3] Jianchao Yang, Kai Yu,Yihong Gong and Huang,“ Linear spatial pyramid matching using sparse coding for image classification”, IEEE Transactions On Computer Vision and Pattern Recogni-tion pp. 1794 - 1801,2009.
[4] K.Marina Singha, Daizy Deb and Sudipta Roy ,“A Novel Ap-proach for Retinal Lesion Detection in Diabetic Retinopathy Im-ages”, International Journal of Innovative Research in Science, Engineering and Technology, Vol. 3, Issue .3 , pp. 2319 - 8753, Mar.2014.
[5] P.Sohini Roychowdhury, D.Dara Koozekanani and K. Keshab , “DREAM: Diabetic Retinopathy Analysis Using Machine Learning”, IEEE Journal of Biomedical and Health Informatics, Vol.18, pp. Issue. 5, pp. 1717 - 1728, 2014.
[6] C.Balint Antal and E.Andras Hajdu, “An Ensemble Based Sys-tem for Microaneurysm Detection and Diabetic Retinopathy Grading”, IEEE Transactions on Biomedical Engineering, Vol. 59, Issue.6, pp. 1720-1726, 2012.
[7] K.Deepak and J.Sivaswamy, “Automatic Assessment of Macu-lar Edema from Color Retinal Images”, IEEE Transactions on Medical Imaging, Vol. 31, Issue.3, pp. 766–776, 2012.
[8] H.Jelinek, R. Pires, R.Padilha, S.Goldenstein, J.Wainer and A.Rocha, “Data Fusion for Multi Lesion Diabetic Retinopathy Detection”, IEEE Computer Based Medical Systems, pp. 1–4, 2012.
[9] T.Carvalho, H Jelinek, S. Goldenstein and J. Wainer, “Points of Interest and Visual Dictionaries for Automatic Retinal Lesion Detection”, IEEE Transactions on Biomedical Engineering, Vol.59, No.8, pp.2244_2253,Aug.2012.
[10] L.Liu, L .Wang and X. Liu , “In Defense of Soft Assignment Coding”, IEEE Intl.Conference on Computer Vision, pp. 2486 - 2493, 2011.
[11] D.Morariu, R.Cretulescu and L.Vintan , “Improving a SVM Me-ta classifier for Text Documents by using Naive Bayes" , Int. J. of Computers, Communications & Control, Vol. V, No.3, pp. 351-361,2010.
[12] J.Van Gemert, C.Veenman, A. W. M.Smeulders and J.M.Geusebroek, “Visual word ambiguity’, IEEE Transactions on Pattern Analysis and Machine Intelligence” vol. 32, Issue.7,
Lesion Detectors Specificity Sensitivity Accuracy Hard Exudates 86.66 76.62 84.21
Drusen 64.50 81.81 72.09
Red Lesions 76.40 77.25 85.46 CottonWool
Spots 79.40 72.15 78.23 Superficial
Hemorrhages 63.60 74.57 75.20 Deep
Hemor-rhages 69.23 71.87 79.00
Lesion Detectors SURF+Soft As-sigment
Encod-ing (Accuracy %)
SURF+Fisher vector
Encod-ing (Accuracy %) Hard Exudates 75.50 84.21
Drusen 58.50 72.09
Red Lesions 65.99 85.46
Cotton Wool Spots 75.00 78.23
SuperficialHemorrhages 59.50 75.20
[image:6.612.40.297.118.274.2]pp. 1271–1283, 2010.
[13] K.Meindert Niemeijer, D.Michael, G.Abramoff and A.Bram van Ginneken, “Information fusion for diabetic retinopathy CAD in digital color fundus photographs”, IEEE transactions on medi-cal imaging, vol. 28, No.5, pp.775 - 785, May.2010.
[14] G.Quellec, M.Lamard, P.Josselin, G. Cazuguel, B.Cochener and C. Roux , “Optimal wavelet transform for the detection of mi-croaneurysms in retina photographs”, IEEE Transactions on Medical Imaging, Vol. 27,No.9 pp. 1230 1241,2008.