http://dx.doi.org/10.4236/jpee.2014.29016
Propagation Characteristics of Partial
Discharge Pulses in the Cable
Jianhua Lin1, Junfeng Gui2, Shengyou Gao3, Yubin Wang1, Jianhua Huang1,
Jinjing Yuan1, Wen He1
1Dongguan Power Breuse of Guangdong Grid, Dongguan, China
2School of Electrical Engineering, Beijing Jiaotong University, Beijing, China
3Department of Elec. Eng., Tsinghua University, State Key Lab of Control and Simulation of Power Systems and
Generation Equipments, Beijing, China Email: [email protected]
Received May 2014
Abstract
In order to determine the type and location of partial discharge in cable, the effect of partial dis-charge (PD) pulse propagation in the cable is studied. Firstly, pulses are injected to cables of dif-ferent lengths so that input and output signal can be measured at both ends of each cable. Then the transfer function of pulse propagation path can be defined. Secondly, high-voltage test is done in the cable joint with man-made defects, and typical PD waveforms are gotten. Seven parameters of waveform characteristics are calculated, including edge times, waveform shape and statistical characteristics. They are used to distinguish different types of PD or distances of the pulse propa-gation. Thus the efficiency of PD recognition in cable can be improved.
Keywords
Partial Discharge, Cable, Waveform, Propagation, Recognition
1. Introduction
XLPE cable has been widely used in the distribution network of China. Accidents caused by the insulation de-fects can not be ignored. Partial discharge (PD) is an early phenomenon of the fault in cable’s insulation [1]. If not adjusted timely, it will cause further degradation to the cable insulation. The research of on-line monitoring and pattern recognition for PD in cable has important significance of preventing accident of cables and stable operation of the power system.
With the advancement of data acquisition technology, full waveform can be accessed and its information is more helpful to analyze PD. Because PD may occur in any position, and the measurement can only take place at several specific locations. And the propagation path in cable is very complex. PD pulse waveform after propaga-tion will change. So the research of waveform characteristic for PD recognipropaga-tion and separapropaga-tion cannot be applied to the actual cable system [2]-[6].
stud-ied cable is YJV22-3*95, and its rated phase/line voltage is 8.7/15 kV. Influence of PD pulse during its propaga-tion can be analyzed from characteristics of the waveform [7]-[13]. For safety and operability, the experiment is divided into two tests. One is the propagation of a low-voltage pulse produced by the signal generator, and it is for the transfer function of the cable. The other is PD test under the high-voltage, and it is for typical PD pulse waveforms. Then the method of digital signal processing is used to study propagation characteristics of partial discharge pulses in the cable. Several parameters of the waveform are determined for the analysis of different type or distance.
2. Test of Pulse Propagation in Cable
The test of pulse propagation in cable is carried out. The input signal is injected to one end of the cable, and the output signal is measured in the other end of the cable. Sensor is the high-frequency current transformer which bandwidth is higher than 30 MHz. A digital oscilloscope typed DS2302A is for acquiring the signal, its analog bandwidth is 300 MHz and sampling rate is 2.5 GS/s. Because of the consistency of the cable structure, the most important factor for the pulse propagation path is the length of the cable. During this test, the effect of different propagation distance is studied with the change of cable length.
The injected signal can be as 1) sine wave with various frequency; 2) pulse injection. In this experiment the narrow square wave is selected, and its pulse width is about nanoseconds. Both input and output signals are measured by the oscilloscope.
The transfer function of propagation process can defined by the division of the Fourier Transform of output and input signal. Relationships about the amplitude versus frequency of the transfer function of cable with dif-ferent length are showed in Figure 1.
From the above figures, it shows that transfer function is linked to the propagation distance. When the propa-gation distance is within a few meters, there are different changes in signal magnitude. In general, the magnitude should decrease because of attenuation caused by propagation. For distributed inductances and capacitances, the magnitude will increase at some resonant frequency. When the propagation distance is dozens of meters, the magnitude will mostly decrease. The frequency of PD current pulse is about 1 - 30 MHz. Within this range, the magnitude of received signal will reduce to 10% of the original waveform.
3. Test of Man-Made Defects in Cable Joint
Six man-made defects are put up in the 10 kV 3-phase cable joint. 1) A longitudinal incision on the insulation; 2) A V-shape slot in the insulation; 3) A circle slot in the insulation; 4) A tip plunged into the insulation; 5) A float potential; 6). A metal burr at the conductor.
The 10 kV voltage of power frequency is applied to each defect one by one. When a phase is testing, the other two phases are grounded. PD signals are also measured from the high-frequency current transformer at the grounding wire of cable’s shielding. A wideband PD instrument is used for acquiring the signal, its analog bandwidth is 30 MHz and sampling rate is 100 MS/s. The working mode of PD instrument is threshold trigger in order to get single pulse waveform from continuous signal.
[image:2.595.132.494.555.700.2]
(a) Cable of 4 m length (b) Cable of 40 m length
Pulse waveforms of each types of PD are showed in Figure 2.
4. Calculation of Waveform Characteristics
The typical PD signal waveform is a pulse with steep edges and decaying oscillation, for the duration of a few nanoseconds (Figure 2). According to the principle of discharge, a charge transfer will generate a fast pulses. PD of a certain fault will repeat. Received pulses have similar characteristics. For waveform distinguish, some feature quantities for the description of pulse waveform are calculated, including the time characteristics, the waveform shape features and the statistical characteristics.
1) Time characteristics.
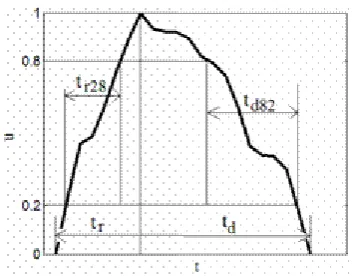
There are several time parameters for main wave crest of the pulse. They can show speeds of rise and fall. The rising edge tr shows the rising time from zero to the pulse peak. The trailing edge td shows the descending
time from the pulse peak to zero. The other two parameters tr28 and td82 contribute to more information of wave
crest characteristics. They show the rising or descending time between 20% and 80% positions of the pulse peak. They are showed in Figure 3.
2) Waveform shape
The magnitude of the pulse peak is very important for PD pulse. Sometimes it can be considered as the dis-charge quantity. The peak factor of a pulse can be defined as,
P d
U K
U
= (1)
where Up is the magnitude of the pulse peak, and U is the RMS of the pulse.
3) Statistical characteristics
Data of a pulse may be considered as random variables. Statistical parameter such as mean value μ and stan-dard deviation σ can be calculated. The high order central moments is defined as,
(
)
{
k}
kk E x
µ = −µ σ (2)
[image:3.595.132.517.391.703.2]
where E means the average function, k = 3 and 4 are used here, named SK and KU. They describe the asymme-try and sharpness of the waveform with respect to a normal distribution.
After calculation, a seven-dimensional vector will use for characteristics of a pulse. The parameters for above 6 kinds of PD pulses are showed in Table 1. The unit of all times is ns.
There is a certain difference of data in the table. It means that he seven-dimensional vector can be used for distinction of PD types, if a suitable tool of artificial intelligence is applied, such as the artificial neural networks (ANN) [14] [15].
5. Characteristics of PD Pulse Waveforms after Propagation
Influence of PD pulse during its propagation can be analyzed by multiplying the transfer function and Fourier transform of PD signal. Then Fourier inverse-transform of the product will be the waveform after propagation. Because there are different sampling rates between two kinds of instrument, 2.5 GS/s in the propagation test and 100 MS/s in the PD test. Sampling signal of PD waveform has been processed by interpolation, so that it has the same time interval with sampling signal received by oscilloscope.
PD of type 1 is calculated as an example, and the distance of pulse propagation are also 4 m and 40 m. The distance is just the length of the cable (L). Parameters are showed in Table 2, in which unit of times is ns.
With the propagation distance of the pulse gets longer, high-frequency component of the signal has a bigger attenuation so that edge times of the waveform will increase. Another notable change is the drop of the sharp-ness.
[image:4.595.225.402.353.492.2]According to the results, there is a certain difference of data in the table, too. If the relationship between pa-rameters and propagation distance is fitted by a suitable method, the distance could be found by papa-rameters of
[image:4.595.87.539.535.635.2]Figure 3. Time characteristics of a waveform.
Table 1. Seven parameters of 6 kinds of PD pulses.
No rt td tr28 td82 kd SK KU
1 50.365 39.635 20.725 17.596 10.852 2.182 43.602
2 60.657 49.343 19.774 16.901 10.219 2.059 38.758
3 49.797 30.203 19.151 19.361 10.621 1.9003 44.133
4 50.027 59.973 24.793 27.892 7.8068 1.4664 12.548
5 60.061 49.938 24.810 17.505 8.4805 1.4809 14.264
6 50.215 49.784 20.342 20.379 8.2769 1.4618 13.506
Table 2. Parameters of original and propagated pulses.
m/L rt td tr28 td82 kd SK KU
0 50.3 39.6 20.7 17.5 10.8 2.1 43.60
4 57.0 42.4 22.1 24.0 9.8 2.8 28.2
[image:4.595.86.541.663.720.2]received signal, that is, the PD location can be obtained.
6. Conclusions
1) Pulse propagation in cables of different length has been tested. Transfer functions of propagation path are calculated, thus resonant frequency and attenuation ratio can be determined.
2) Cable joint with man-made faults are used for PD test. Typical PD waveforms are obtained.
3) 7 waveform parameters are defined for the analysis of typical and propagated PD pulse. They can be used for recognition of PD type and determination of propagation distance.
References
[1] IEC 60270 (2001) Partial Discharge Measurement. 3rd Edition.
[2] Cselkó, R. and Berta, I. (2013) Challenges of Partial Discharge Diagnostics of Low-Voltage Cables. Journal of Elec-trostatics, 71, 558-563. http://dx.doi.org/10.1016/j.elstat.2012.12.042
[3] Kranr, H.-G. and Krump, R. (1992) Partial Discharge Diagnosis Using Statistical Parameter Optimization on a PC-System. IEEE Transactions on Electrical Insulation, 27, 93-98.
[4] Gulski, E. (1993) Computer-Aided Measurement of Partial Discharges in HV Equipment. IEEE Transactions on Elec-trical Insulation, 28, 969-983.
[5] Gulski E. and Krivda Neural A. (1993) Networks as a Tool for Recognition of Partial Discharges. IEEE Transactions on Electrical Insulation, 28, 984-1001.
[6] Su, M.-S., Chen, J.-F. and Lin, Y.-H. (2013) Phase Determination of Partial Discharge Source in Three-Phase Trans-mission Lines Using Discrete Wavelet Transform and Probabilistic Neural Networks. Electrical Power and Energy Systems, 51, 27-34.
[7] Okamoto, T. and Tanaka, T. (1995) Partial Discharge Pattern Recognition for Three Kinds of Model Electrodes with a Neural Network. IEE Proceedings—Science Measurement and Technology, 142.
[8] Blackburn, T.R., Phung, B.T., Vakilan, M., Naderi, M.S. and Zhang, H. (2005) Investigation of High Frequency Signal Propagation Characteristic on HV XLPE Cables. 7th International Power Electronics Conference, 2, 776-781.
[9] Oussalah, N., Zebboudj, Y. and Boggs, S.A. (2007) Analytic Solutions for Pulse Propagation in Shielded Power Cable for Symmetric and Asymmetric PD Pulses. IEEE Transactions on Dielectrics and Electrical Insulation, 14, 1264-1270.
http://dx.doi.org/10.1109/TDEI.2007.4339487
[10] Pommerenke, D., Strehl, T. and Heinrich, R. (1999) Discrimination between Internal PD and Other Pulses Using Di-rectional Coupling Sensors on HV Cable Systems. IEEE Transactions on Dielectrics and Electrical Insulation, 6, 814- 824. http://dx.doi.org/10.1109/94.822021
[11] Cavallini, A., Tozzi, M. and Montanari, G.C. (2007) Improving PD Location in Cable Routes through Advanced Analysis Techniques. Nordic Insulation Symposium,Denmark, 141- 144.
[12] Chandrasekar, S., Cavallini, A., Montanari, G.C. and Puletti, F. (2007) Bandwidth and Sensitivity Issues in PD Detec-tion in Power Cables. IEEE Transactions on Dielectrics and Electrical Insulation, 14, 735-743.
http://dx.doi.org/10.1109/TDEI.2007.369538
[13] Ametani, A., Miyamoto, Y. and Nagaoka, N. (2004) Semiconducting Layer Impedance and Its Effect on Cable Wave Propagation and Transient Characteristics. IEEE Transaction on Power Delivery, 19, 1523-1531.
http://dx.doi.org/10.1109/TPWRD.2003.822502
[14] Gao, K., Tan, K., Li, F. and Wu, C. (2002) PD Pattern Recognition for Stator Bar Models with Six Kinds of Character-istic Vectors Using BP Network. IEEE Transactions on Dielectrics and Electrical Insulation, 9, 381-389.
http://dx.doi.org/10.1109/TDEI.2002.1007700