ABSTRACT
Signal transduction pathways are responsible for sensing and responding to stimuli. Two-component systems are a common type of signaling pathway found in microorganisms and plants, and are composed of a sensor kinase (SK) and response regulator (RR) protein. Changes in the phosphorylation states of the SK and RR due to environmental stimuli provide a molecular switch to control signal output.
RRs possess the catalytic activity for phosphotransfer, but it is not known how closely related RRs self-catalyze phosphorylation and dephosphorylation reactions with rate constants that span up to six orders of magnitude. Variable residues in the RR active site, named according to their position relative to a conserved aspartic acid (D+2) and threonine residue (T+1 and T+2), individually influence autophosphorylation and autodephosphorylation reaction kinetics by one to two orders of magnitude.
Our hypothesis is that certain combinations of variable active site residues interact to produce much larger effects on RR reaction kinetics than the sum of their individual effects. To
investigate these interactive properties, we examined existing data on the effects of specific D+2 and T+2 combinations, in the presence of the most common T+1 residue (Ala), that resulted in synergistic interactivity. To complete characterization of position T+1, the impact of Gly (the second most abundant residue) on reaction kinetics was tested. Finally, the effects of
combinations at all three positions on rate constants were tested.
INTRODUCTION
Two-component regulatory systems are common signal transduction pathways found in
bacteria, archaea, eukaryotic microorganisms, and plants (Wuichet et al., 2010).
Two-component systems are involved in a variety of biological processes including: nutrient
acquisition,behavior, development, pathogenesis, and stress response. Hundreds of thousands of
two-component systems have been identified (mistdb.com; Ulrich & Zhulin, 2010), which is far
too many to study individually. Therefore, we are interested in studying the general properties of
two-component pathways.
Protein phosphorylation mediates signal transduction in two-component systems.
Two-component regulatory systems (reviewed by Zschiedrich et al., 2016)begin with detection of an
external stimulus from the environment. This stimulus is recorded on a sensor kinase with a
change in phosphorylation state through the use of ATP. The phosphoryl group can then be
transferred from the sensor kinase to a response regulator, which is composed of both a receiver
and an output domain. The response regulator controls output according to the phosphorylation
of its receiver domain (Gao & Stock, 2010). Generally, an output response is executed if the
receiver domain of the response regulator is phosphorylated. Response regulators cease output
by losing the phosphoryl group on their receiver domain either through autodephosphorylation
with water or with the assistance of a phosphatase. Typically, an output from a response
regulator will result in an increase or decrease in downstream transcription of a target gene;
however, outputs can also involve protein or RNA binding as well as regulation of enzyme
activity (Galperin, 2010).
A critical characteristic of response regulators is their ability to self-catalyze their
the absence of partner proteins such as sensor kinases and phosphatases. This indicates that
response regulator proteins possess the catalytic molecular machinery for these reactions.
Autocatalytic reactions are also valuable experimentally, in which the rate of simplified
autophosphorylation and autodephosphorylation reactions can be measured quantitatively to give
insight into general properties of response regulators. Furthermore, response regulators in vivo
utilize small molecule phosphodonors in autophosphorylation reactions as well as water in
autodephosphorylation reactions. For example, metabolic intermediates that are phosphodonors
are known to influence the regulation of two-component systems(Wolfe, 2010). The
Escherichia coli CheB response regulator does not use phosphatases and, as such, relies entirely
on autodephosphorylation (Stewart, 1993).
Conserved residues in receiver domain catalyze phosphorus substitution chemistry.
Receiver domains in response regulators have both conserved and variable residues in their
active site (Figure 1). The conserved residues of the active site catalyze the chemistry of
accepting or donating the phosphoryl group and are found across all response regulators. In E.
coli CheY, the conserved residues are: positions 12 and 13 (DD), which bind the metal ion that
assists in phosphorylation (Lukat et al., 1992) anddephosphorylation (Lukat et al., 1990; Stock
et al., 1993); position 57 (D), which covalently binds to the phosphoryl group (Sanders et al.,
1989); and positions 87 (T) (Appleby & Bourret, 1998) and 109 (K) (Lukat et al. 1991), which
bind two phosphoryl group oxygen atoms and help position the phosphorylation reaction within
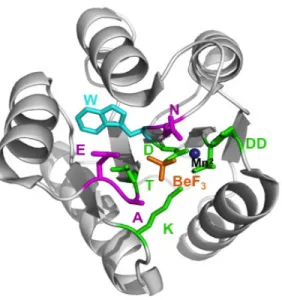
Figure 1. Active Site of CheY Receiver Domain. The five conserved active site residues (DD, D, T, K), which catalyze phosphorylation chemistry, are in green; variable active site residues known to influence reaction kinetics (D+2, T+1, T+2), are in magenta; Manganese ion, which is essential for phosphoryl group reactions, is in navy; the stable phosphoryl group analogue BeF3
-is in orange; the Trp (W) used for fluorescence measurements -is in cyan. PDBid 1FQW (Lee et
al. 2001) is shown.
Variable active site residues influence response regulator reaction kinetics. Kinetically,
when looking at signal transduction pathways such as two-component systems, a stimulus from
the environment must be noted and an output generated before the stimulus changes. If this does
not occur, then the pathway is innately flawed and the response will not be synchronized with the
environment. Thus, each response regulator is fine tuned for the specific process it controls. For
instance, if a fast action response is needed, fast phosphorylation reaction kinetics are seen. Due
to this, two-component systems have rate constants of autodephosphorylation reactions in
different wild type receiver domains that are reported to vary over six orders of magnitude
(Bourret et al., 2010). How can different response regulators that share a common
three-dimensional structure and set of conserved amino acids carry out the same reactions at such
different rates? Variable residues, which are not conserved among different response regulators,
The specific variable active site residues analyzed in this work are D+2, T+1, and T+2 in the
CheY receiver domain. Nomenclature for variable residues is expressed as the position of the
variable residue relative to the closest conserved residue. Therefore, D+2 refers to the variable
residue two positions C–terminal to the conserved aspartic acid residue. The nature of specific
amino acid residues at variable positions D+2, T+1, T+2 has demonstrated influence over
autophosphorylation and autodephosphorylation kinetics. Previous research has accounted for
two orders of magnitude difference in autodephosphorylation rate constants due to substitutions
at D+2 and T+2 (Page et al., 2016; Thomas et al., 2008; Pazy et al., 2009). In addition,
D+2/T+2 substitutions can account for up to two orders of magnitude difference in
autophosphorylation kinetics (Thomas et al., 2013), while T+1 can account for one order of
magnitude difference in both autophosphorylation and autodephosphorylation rate constants
(Immormino et al., 2016).
Combinations of variable active site residues interact to modulate response regulator
reaction kinetics. Our long-term goals are to account for the other three orders of magnitude in
autodephosphorylation rate constant (kdephos)and assess how large a range is possible for response
regulator autophosphorylation rate constants (kphos/KS), which have only been explored in CheY
(Thomas et al., 2013) and PhoB (Creager-Allen et al., 2013). Because variable active site
residues D+2, T+1, T+2 have been proven to individually influence autophosphorylation and
autodephosphorylation rate constants, it makes logical sense to explore if combinations of these
variable residues interact to help account for the remaining timescale observed. My hypothesis
using D+2/T+2 combinations enriched with uncommon T+1 residues will display synergistic
effects upon autophosphorylation and autodephosphorylation that will lend insight into the
general kinetics of two-component systems.
Throughout all response regulators, T+1 is Ala in 53%, Gly in 22%, Ser/Thr in 17%, and
Ile/Met/Val in 5%. Among these amino acids, only the effects of Gly at T+1 have not been
characterized. Thus, autophosphorylation and autodephosphorylation rate constants were
measured for an Ala to Gly CheY mutant. In addition, almost all currently available information
about D+2/T+1/T+2 combinations is with Ala at T+1. Therefore, rate constants were measured
for three D+2/T+1/T+2 combinations without an Ala at T+1: Asn/Thr/Ser, Asn/Val/Ser, and
MATERIAL AND METHODS
Site directed mutagenesis. Wild type E. coli CheY contains Asn at D+2, Ala at T+1, and Glu at
T+2. Two expression systems were used to construct the D+2/T+1/T+2 combinations examined
in this thesis. Mutants NTS and NVS were expressed in a pRS3 vector system, which encodes
native CheY, CheZ, an Ampicillin (Amp) resistance gene, and an inducible Trp promoter
(Boesch et al., 2000). N-terminal His6-tagged mutants NGE, RGY, and RGH were expressed in
a pET28-derivative pKC1 vector with a Kanamycin (Kan) resistance gene and an inducible T7
RNA polymerase promoter (Creager-Allen et al., 2013). All mutant primers were designed
using PrimerX, online primer designing software (http://www.bioinformatics.org/primerx/) for
use in site directed mutagenesis. Primer sequences were checked using IDT
(https://www.idtdna.com/calc/analyzer) to ensure little to no secondary structure interference.
All primers were synthesized at UNC Lineberger Cancer Center. All template plasmids were
isolated using Qiagen Spin MiniPrep Kit. Site directed mutagenesis was conducted using
QuikChange (Agilent) protocol as described for pRS3 mutants (Boesch et al., 2000) and pKC1
mutants (Creager-Allen et al., 2013). Briefly, PCR was performed using mutant primers with the
appropriatetemplate and DpnI restriction enzyme was added to digest methylated parental
strands. Mutant plasmids were transformed into E. coli DH5α competent cells and then pRS3
vector mutants were plated on LB/Amp (100 mg/L) agar, while His6-tagged pKC1 vector
mutants were plated on LB/Kan (30 mg/L) agar. Single colonies were streaked for purification
and mutant candidate plasmids were isolated as before using Qiagen Spin MiniPrep Kit. Plasmid
concentrations were quantified using a Nanodrop 2000 UV-Vis Spectrophotometer by measuring
the absorbance at 260 nm, and the entire cheY gene was sequenced to determine if site directed
K0641recA (∆cheY) (Thomas et al., 2008) competent cells using CaCl2 and heat shock as
described (Maniatis et al., 1982) and stored at -80°C. His6-tagged pKC1 vector mutant plasmids
were transformed into E. coli BL21 (Thomas et al., 2008) competent cells using heat shock as
described (Bourret et al., 2010) and stored at -80°C.
Protein purification. CheY mutantsNTS and NVSwere purified as described (Hess et al.,
1991). Briefly, K0641recA/pRS3 cells were inoculated in 1 L LB/Amp (100 mg/L) and grown
to an OD600 between 0.8-0.9. Expression of mutant CheY was induced using beta-indoleacrylic
acid (100 mg/L). After overnight growth at 37°C, K0641recA/pRS3 cells were lysed by
sonication and centrifuged at 30,000 rpm to remove cellular debris. The supernatant was
applied to an Affi-Gel Blue (Bio-Rad) affinity column and CheY eluted using TMG (25 mM
Tris, pH 7.5, 5 mM MgCl2, 10% (v/v) glycerol) + 1 M NaCl. SDS-PAGE was performed to
identify CheY-containing fractions, which were pooled and dialyzed twice against 1 L TMG.
Dialysate was added to DE-52 ion exchange column and CheY eluted using TMG + 0.1 M NaCl.
CheY-containing fractions were identified using gel electrophoresis and concentrated using
Amicon ultra-15s centrifuge tubes. Concentrated CheY was applied to a Superdex 75 (GE
Healthcare) gel filtration column (1.6 cm diameter, 60 cm length) and fractions collected.
CheY-containing fractions were again concentrated using Amicon ultra-15s and protein concentration
calculated from absorbance at 280 nm with a Nanodrop 2000 UV-Vis Spectrophotometer using a
CheY extinction coefficient of 0.727 mL/ mg * cm (Silversmith et al., 2001). Concentrated
protein solution was aliquoted and stored at -20°C.
CheY mutants NGE, RGY, and RGH were purified as described (Bourret et al., 2010).
Briefly, BL21 (DE3)/pKC1 cells were inoculated in 1 L LB/Kan (30 mg/L) and grown to an
overnight growth at 37°C, cells were lysed by sonication and centrifuged at 30,000 rpm to
remove cellular debris. Supernatant was applied to a 2 mL Nickel affinity column (Ni-NTA
Agarose) and His6-tagged CheY was eluted using increasing concentrations of imidazole (10-160
mM). Mutant CheY RGY was prone to precipitating out of solution during nickel
chromatography; therefore, 0.5 mL fractions of elutant were diluted into 1.5 mL of TMG buffer
during collection. CheY containing fractions were combined and the His6-tag removed by the
addition of 1 unitthrombin (Novagen) per mg of protein. The non-native Gly-Ser-His residues
remaining at the N-terminus after cleavage do not affect CheY autodephosphorylation (Bourret
et al., 2010) or autophosphorylation (Creager-Allen et al., 2013)kinetics. The digested CheY
was applied to a Superdex 75 gel filtration column and fractions collected. CheY containing
fractions were concentrated and protein concentration was calculated as described above.
Measurement of autodephosphorylation rate constant using stopped-flow fluorescence
spectroscropy. The phosphoryl group donor phosphoramidate (PAM) was synthesized by
Frederick Ferguson according to established techniques (Sheridan et al., 1971). The
concentration of PAM sufficient to half-maximally phosphorylate the CheY mutant (K1/2) in 100
mM Hepes pH 7.0, 10 mM MgCl2 was determined by tryptophan fluorescence (excitation at 295
nm and emission at 346 nm) using a Perkin-Elmer LS-50B luminescence spectrometer with FL
Winlab version 4 software as described (Bourret et al., 2010). kdephos for all mutants except RGY
were determined via the pH Jump/Stopped Flow procedure as described (Schuster et al., 2001).
Briefly, one syringe containing 20 μM mutant CheY, 5 x K1/2 PAM, 5 mM Tris pH 7.5, and 10
mM MgCl2 was mixed with an equal volume from another syringe filled with 200 mM sodium
bicarbonate, pH 10.3, using an Applied Photophysics RX2000 rapid mixing device and
was very slow,kdephos for mutant RGY was determined in a cuvetteusing 2 μM RGY CheY, 5 x
K1/2 PAM, 5 mM Tris pH 7.5, and 30 mM MgCl2 mixed with 100 mM sodium bicarbonate, pH
10.3. Fluorescence was monitored with a Perkin-Elmer LS-50B luminescence spectrometer as
described above. The high pH buffer retards CheY autophosphorylation with PAM, allowing
measurement of autodephosphorylation. Dephosphorylation curves were exported to GraphPad
Prism software and fit to single-exponential decay equation to determine kdephos from replicate
trials.
Measurement of rate constant for autophosphorylation with PAM using stopped-flow
fluorescence spectroscopy. Time courses for reactions of mutant CheY with the small molecule
phosphodonor PAM were measured via stopped-flow tryptophan fluorescence as described
(Silversmith & Bourret, 2017). Briefly, two syringes were prepared, one syringe with 10 μM
CheY mutant in 100 mM HEPES (pH 7.0), 10 mM MgCl2, and one syringe of varying
concentrations of PAM (e.g. 5, 10, 15, and 20 mM) in 100 mM HEPES (pH 7.0), 10 mM MgCl2,
and increasing volume of 1 M KCl to maintain a constant ionic strength of 230 mM. Equal
volumes of syringes were simultaneously mixed with an Applied Photophysics RX2000 rapid
mixing device and fluorescence was measured as described above using a Perkin-Elmer LS-50B
luminescence spectrometer with FL Winlab version 4. Time courses for each CheY variant were
exported to GraphPad Prism software and fitted to a single exponential decay equation and
plotted to obtain a first-order rate constant (kobs). Average kobs for replicates for each variant
were then graphed versus phosphodonor concentration to a linear fit, and the
autophosphorylation biomolecular rate constant (kphos/Ks) was determined from kobs =
RESULTS
Investigation of interactive properties by examining D+2 and T+2 pairings that resulted in
synergy. If variable positions within a protein interactively participate in functionally important
reactions, then they would be expected to exhibit evolutionary covariation. As such, variable
positions D+2 and T+2 have been shown to be potentially significant to receiver domain function
by exhibiting high mutual information content (Z-score of 163, sixth highest overall) when
compared to the 5,995 possible pairings within receiver domains (Page et al., 2016). In order to
ascertain information about interactions of variable residue combinations selected by evolution, a
sequence analysis was performed of varying pairings of amino acids at D+2/T+2 using a
database of frequency of amino acids versus position within receiver domains (Page et al., 2016).
Previous research was focused on 20 identified D+2/T+2 pairings that accounted for half of
naturally occurring receiver domain sequences (Page et al., 2016). Because Ala accounts for
53% of residues at T+1 (Table 1), previous research on combinations of variable residues at
D+2/T+2 has been conducted in the context of Ala at T+1.
Table 1. Natural Abundancea of Amino Acids at Receiver Domain Position T+1
Amino Acid Number Percent
Ala 17467 53
Gly 7353 22
Ser 3387 10
Thr 2301 6.9
Val 747 2.3
Met 712 2.1
Asn 239 0.72
Ile 237 0.71
aFrom a non-redundant database of 33,252 receiver domains (Page et al., 2016).
In order to investigate the contributions of individual and combination substitutions at
2016)were mathematically analyzed to determine interactivity (Table 2). By utilizing the
equation for the activation energy of a reaction, ΔG‡
= -RTln(kdephos), the change in activation
energy (ΔΔG‡
) between wild type CheY and each single variant was determined as well as the
activation energy change between wild type and the double mutant combination,as described by
(Thomas et al., 2008). If the change in activation energy between wild type and the double
mutant combination were much greater than the sum of the individual changes in activation
energies between wild type and the component variants, this would indicate a synergistic
interaction. Similarly, if the change in activation energy between wild type and the double
mutant combination were either very similar or much smaller than the sum of the individual
changes in activation energies between wild type and the component variants, this would indicate
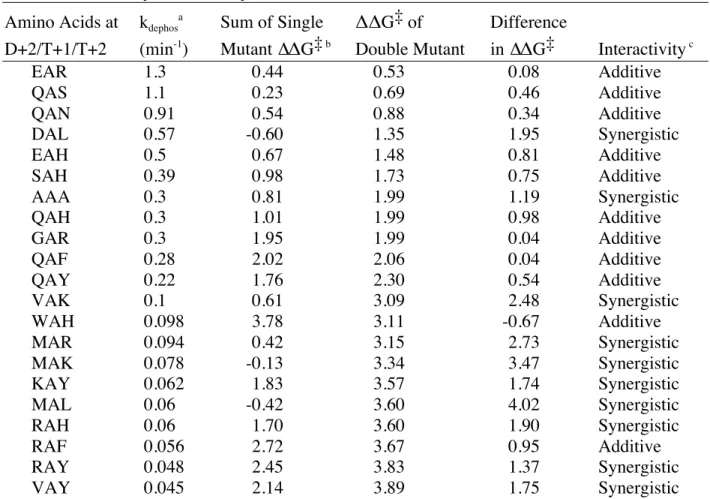
Table 2. Thermodynamic Analysis of Published D+2/T+1/T+2 Combinations in CheY
Amino Acids at kdephos
a
Sum of Single ΔΔG‡ of Difference
D+2/T+1/T+2 (min-1
) Mutant ∆ΔG‡ b
Double Mutant in ∆ΔG‡ Interactivity c
EAR 1.3 0.44 0.53 0.08 Additive
QAS 1.1 0.23 0.69 0.46 Additive
QAN 0.91 0.54 0.88 0.34 Additive
DAL 0.57 -0.60 1.35 1.95 Synergistic
EAH 0.5 0.67 1.48 0.81 Additive
SAH 0.39 0.98 1.73 0.75 Additive
AAA 0.3 0.81 1.99 1.19 Synergistic
QAH 0.3 1.01 1.99 0.98 Additive
GAR 0.3 1.95 1.99 0.04 Additive
QAF 0.28 2.02 2.06 0.04 Additive
QAY 0.22 1.76 2.30 0.54 Additive
VAK 0.1 0.61 3.09 2.48 Synergistic
WAH 0.098 3.78 3.11 -0.67 Additive
MAR 0.094 0.42 3.15 2.73 Synergistic
MAK 0.078 -0.13 3.34 3.47 Synergistic
KAY 0.062 1.83 3.57 1.74 Synergistic
MAL 0.06 -0.42 3.60 4.02 Synergistic
RAH 0.06 1.70 3.60 1.90 Synergistic
RAF 0.056 2.72 3.67 0.95 Additive
RAY 0.048 2.45 3.83 1.37 Synergistic
VAY 0.045 2.14 3.89 1.75 Synergistic
ak
dephos values from Page et al., 2016
b Activation Energy equation ∆ΔG‡ = -RT ln(k
dephos CheY variant/kdephos CheY
wildtype). RT constant not included.
c
Relative ratio of 3 (∆ΔG‡ for double mutant over Σ∆ΔG‡ for single mutants) used for interactivity determination; ln (3) = 1.1. Synergistic defined as difference in
ΔΔG‡ ≥ 1.1. Additive defined as -1.1 < difference in ΔΔG‡ < 1.1. Antagonistic defined as difference in ΔΔG‡ ≤ -1.1.
To attempt to identify why some combinations of variable active site residues exhibited
synergy and others did not, correlations were examined between various properties of the
combinations and the type of interaction observed. One expected factor that was observed was a
general negative correlation between double mutant kdephos rate constants and synergy (cf.
columns 2 and 6 of Table 2). Because CheY is on the faster end of the kinetics spectrum of
autodephosphorylation rate, it is more likely that greater synergybetween the amino acids at
D+2 and T+2will be necessary. Another factor that was examined was between D+2 and T+2
amino acid properties and the type of interaction. However, no correlations were found between
properties such as hydrophobicity, charge, or polarity and synergy (data not shown). Similarly,
no correlations were found betweenthe abundance of D+2/T+2 pairs in naturally occurring
response regulators and synergy (data not shown). Finally, links between the type of interaction
and T+1 residues other than Ala were investigated for potential insight into physical interactions
of T+1with D+2 and T+2. Because autodephosphorylation rate constants were determined with
an Ala at T+1, it might be that the additive D+2/T+2 pairingsin Table 2 reflect D+2/T+2
combinations with predominately non-Ala residues at T+1 in native response regulators (i.e. the
presence of Ala might interfere with interaction between D+2 and T+2). However, no
correlations between amino acid abundance at T+1 for a particular D+2/T+2 pair and lack of
synergy were found (data not shown).
Identification of candidate combinations of variable active site residues for experimental
analysis. In order to identify potentially informative D+2/T+1/T+2 combinations, the most
abundant D+2/T+2 pairings were identified. From these pairings, focus was placed on
D+2/T+1/T+2 combinations that displayed relative enrichmentof non-Ala residues at T+1.
Relative enrichment values were calculated for D+2/T+1/T+2 combinations by taking the ratio
between the frequency of a particular T+1 residue associated with a particular D+2/T+2 pair and
the frequency of that T+1 residue with any D+2/T+2 pair. For example, Thr makes up 7% of
T+1 residues (Table 1), but 48% of T+1 residues in receiver domains with Asn at D+2 and Ser at
T+2, an enrichment of about seven-fold. In the context of position T+1, Gly represents the
D+2/T+1/T+2 combinations RGY and RGH represent the first and second most abundant triplets
with Gly at T+1, displayed relative enrichment values of about two- and three-fold respectively,
and thus were chosen. These are relatively large enrichments, because a baseline abundance of
22% (Table 1) limits the maximum possible enrichment of Gly at T+1 to less than five-fold. Thr
and Val displayed extreme effects on autodephosphorylation among various amino acids at T+1
when tested in three different response regulators (i.e. three different D+2/T+2 pairs)
(Immormino et al., 2016). Therefore,partner D+2/T+2 pairings with Thr or Val at T+1 were of
particular interest to examine. NVS represents the most abundant combination with Val at T+1,
with a relative enrichment of five-fold; NTS is the second most common combination with Thr
at T+1, with a high relative enrichment of seven-fold, thus both combinations were chosen.
Impact of Ala to Gly substitution at T+1 on reaction kinetics was not significant. It has
been proposed that T+1 exerts influence over response regulator reaction kinetics through
mediating access to the active site (Immormino et al., 2016). While Gly is the second most
common residue at position T+1 behind wild type Ala (Table 1), the impact of Gly at T+1 on
reaction kinetics has not previously been tested. In order to finish characterization of common
amino acids at position T+1, autophosphorylation and autodephosphorylation rate constants were
determined for both Ala and Gly variants at T+1 by measuring fluorescence intensity of the Trp
at D+1 in the CheY active site. Trp fluorescence values increase in response to losing the
phosphoryl group. Values for wildtype CheY kdephos and kphos/Ks (Table 3) were similar to
previously reported values (Page et al., 2016, Thomas et al., 2013). In addition, kdephos and
Table 3. Effect of Gly Substitution at T+1 on CheY
Autodephosphorylation and Autophosphorylation Rate Constants
Amino Acid at T+1 kphos/Ks (M
-1
s-1
)a
kdephos (min -1
)b
Ala (wildtype) 9.2 ± 3 3.4 ± 0.04
Gly (NGE mutant) 11 ± 3 2.8 ± 0.2
a
Values are means ± standard deviations. Wildtype kphos/Ks mean obtained
from five replicate trials (n=5). NGE (n=3).
b
(n=2)
The effects of D+2/T+1/T+2 combinations on autophosphorylation and
autodephosphorylation rate constants. In order to gain insight into interactivity among
specific combinations of variable residues D+2/T+1/T+2, autophosphorylation and
autodephosphorylation rate constants were determined by measuring Trp fluorescence for several
D+2/T+1/T+2 combinations without an Ala at T+1, chosen as described above. I constructed the
cheY NTS and cheY NVS genes, purified CheY NTS, and made preliminary
autodephosphorylation measurements for the CheY NTS mutant. Lab mentor Dr. Ruth
Silversmith purified CheY NVS and made final measurements for both CheY NTS and NVS,
which were published in Immormino et al., 2016. The CheY RGY mutant combination was
constructed, purified, and tested by myself. Both autophosphorylation and
autodephosphorylation rate constants were determined for NVS and NTS, while only
autodephosphorylation kinetics were measured for mutant RGY due to time constraints. I
constructed the CheY RGH mutant, but have not yet purified and measured it.
Introduction of Thr at T+1 in D+2/T+2 pairing Asn/Ser diminished autophosphorylation with
PAMand enhanced autodephosphorylation, while introduction of Val at T+1 in the same
D+2/T+2 pairing diminished both reactions (Table 4). These effects are similar to those
observed in the context of the wild type CheY D+2/T+2 residues Asn/Glu (Table 4).
to wild type, similar to component combination RAY (Table 4). Therefore, introduction of Gly
at T+1 in D+2/T+2 pairing Arg/Tyr did not significantly affect autodephosphorylation.
Table 4. Autodephosphorylation and Autophosphorylation Rate Constants of CheY D+2/T+1/T+2 Combinations
Amino Acid at D+2/T+1/T+2 kphos/Ks (M -1
s-1
)a
kdephos (min -1
)
NAE (Wildtype) 9.2 ± 3b
3.4 ± 0.04b
NTEc
4.6 ± 0.5 d
5.0 ± 0.1d
NVE 0.34 ± 0.06 d
0.11 ± 0.01d
NAS 4.2 ± 0.1d
1.2 ± 0.0 e
NTS 3.5 ± 0.7 d
2.7 ± 0.1d
NVS 0.42 ± 0.03 d
0.31 ± 0.04 d
NGE 11 ± 3 b 2.8 ± 0.2 b
RAY -- 0.048± 0.004e
RGY -- 0.084 ± 0.0
a
Values are means ± standard deviations.
b
From Table 3
c
Bold font indicates residue substitution from wild type.
d
From Immormino et al., 2016
e From Page et al., 2016
Thermodynamic analysis of interactivity among D+2/T+1/T+2 combinations. Mathematical
analysis of activation energy, as described above, was used to determine interactivity in
D+2/T+1/T+2combinations. As an example, combination NTS has two component variants
from wild type (NAE): T+1 mutant (NTE) and T+2 mutant (NAS). Compared to a wild type
kdephos of 2.2 min -1
(Page et al., 2016), NTE displays a kdephos of 5.0 min -1
, while NAS has a kdephos
of 1.2 min-1
(Table 4). Applying the thermodynamic change in activation energy equation:
∆∆G‡
for the component variants NTE and NAS equals -RTln (1.2 min-1
/ 2.2 min-1
) -RTln (5.0
min-1/ 2.2 min-1) respectively, while ∆∆G‡ for the combination NTS equals -RTln (2.6 min-1/ 2.2
min-1
). Therefore the difference between the activation energy of the mutant combination
(-0.17RT) and the sum of the activation energies of the two single mutants (-0.21RT) (Table 5) is
0.04RT, which indicates no interaction among residues D+2/T+1/T+2 in the combination NTS.
interactivity among variable residues was determined (Table 5). Combination NVS displayed
antagonistic interactivity among D+2/T+1/T+2 variable residues, whereas combination RGY
displayed additive interactivity.
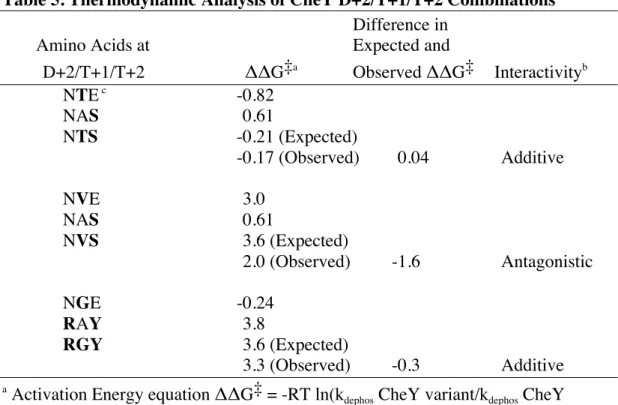
Table 5. Thermodynamic Analysis of CheY D+2/T+1/T+2 Combinations
Difference in
Amino Acids at Expected and
D+2/T+1/T+2 ΔΔG‡a
Observed ΔΔG‡ Interactivityb
NTE c
-0.82
NAS 0.61
NTS -0.21 (Expected)
-0.17(Observed) 0.04 Additive
NVE 3.0
NAS 0.61
NVS 3.6 (Expected)
2.0(Observed) -1.6 Antagonistic
NGE -0.24
RAY 3.8
RGY 3.6 (Expected)
3.3 (Observed) -0.3 Additive
a Activation Energy equation ΔΔG‡ = -RT ln(k
dephos CheY variant/kdephos CheY
wildtype). RT constant not included.
b
Relative ratio of 3 (∆ΔG‡ for double mutant over Σ∆ΔG‡ for single mutants) used for interactivity determination; ln (3) = 1.1. Synergistic defined as difference in
ΔΔG‡ ≥ 1.1. Additive defined as -1.1 < difference in ΔΔG‡ < 1.1. Antagonistic defined as difference in ΔΔG‡ ≤ -1.1.
c
DISCUSSION
Impact of position T+1 on reaction kinetics. It has been proposed that position T+1 exerts its
influence on reaction kinetics via steric hindrance or access to the active site of the receiver
domain (Immormino et al., 2016). As a phosphodonor and water molecule are necessary for
autophosphorylation and autodephophorylation reactions respectively, steric impedance of these
molecules into the active site represents a significant factor impacting kinetics. From this, the
effects of various amino acids at T+1 have been proposed to be grouped into four categories:
residues that can hydrogen bond with the attacking water molecule, residues that minimally
interact with the attacking water molecule, residues that can adapt multiple conformations that
either block or do not block access, and residues that partially block access to the active site
(Immormino et al., 2016). The negligible effects of the T+1 Ala to Gly mutant on rate constants
(Table 3) further confirms the characterization of small T+1 residues as minimally interacting
with the attacking water molecule during autodephosphorylation or PAM during
autophosphorylation. Previously tested substitutions at T+1 affected the three phosphodonors
phosphoramidate, acetyl phosphate, and monophosphoimidazole differently, but all were
consistent with the steric access hypothesis. The effects of the T+1 Ala to Gly substitution have
not yet been tested withacetyl phosphate or monophosphoimidazole; however, it would be
expected that the substitution would display negligible effects on rate constants.
Combinations NTS and NVS displayed additive and antagonistic interactivity respectively.
Combination NTS displayed additive interactive properties (Table 5) indicating minimal
cooperation among the variable residues. This indicates that each residue exerted its influence
on reaction kinetics independent of one another. An interpretation of this result is that the
through hydrogen bonding, needed for removal of the phosphoryl group, thus enhancing the
autodephosphorylation rate. The Glu to Ser substitution at T+2 worked in the opposite direction
by decreasing access to active site, thus the two changes taken together produce an intermediate
effect on autodephosphorylation kinetics consistent with the observed additive interactivity.
Combination NVS displayed antagonistic properties (Table 5) indicating counteracting
interactive forces among variable residues. In total, the effect of combining the Ala to Val
substitution at T+1 and Glu to Ser substitution at T+2 on the autodephosphorylation rate was
equal to about one-fifth (e-1.6
) of the separate substitutions taken independently (Table 5). A
steric explanation for this result is that the substitution of Val for Ala at T+1 significantly
reduced the availability of access to the active site, while introduction of Ser for Glu at T+2 only
moderately reduced access. However, when combined, the substitutions together exerted a lesser
diminishing impact on autodephosphorylation kinetics than would be expected with each
substitution acting independently. This evidence indicates some conflicting interaction between
residues Val and Ser at T+1 and T+2, respectively, in this combination.
Combination RGY displayed additive interactivity. Combination RGY displayed additive
interactivity indicating minimal cooperation among these variable residues. An explanation for
this result is that the Asn to Arg substitution at D+2 and Ser to Tyr substitution at T+2
significantly reduced access of the attacking water molecule to the active site compared to wild
type CheY. The Ala to Gly substitution at T+1 exerted minimal steric impact, as shown earlier,
and thus RGY displayed a combined additive result similar to component mutant RAY.
However, during kdephos determination, fluorescence of unphosphorylated CheY RGY was heavily
quenched by addition of high pH sodium bicarbonate. This resulted in a significant alteration of
autodephosphorylation rate constants for RGH could not be determined, however, this represents
a next logical step for future experiments. In addition, measuring autophosphorylation kinetics
for both RGY and RGH with a variety of small molecule phosphodonors could give additional
insight into combination interactivity and thus would be valuable to investigate.
Future directions. My research has been focused on selecting D+2/T+1/T+2 combinations that
could be properly analyzed using previously obtained component mutant data at the expense of
evaluating more enriched combinations. In order to completely characterize the extent of the
impact of these variable residues, the most abundant and enriched D+2/T+1/T+2 combinations
should be thoroughly investigated. One option would be to continue examining combinations,
without Ala at T+1, that display the highest natural abundance. In addition, investigating
combinations that are highly enriched with a specific non-Ala T+1 residue compared to the
overall distribution could give insight into interactions among the three variable residues.
Another potential avenue to help account for the remaining three orders of magnitude seen in
autodephosphorylation rate constants would be to investigate variable active site residues other
than D+2, T+1, and T+2. Variable active site residues K+1 and K+2 display an evolutionary
covariation in the top 10 for response regulators with a Z score higher than D+2/T+2, and thus
would be ideal candidates to examine. While Pro makes up 82% of amino acids at position K+1,
rare amino acid combinations such as Ser/Gly at K+1 and K+2 are seen in both extremely fast
and slow response regulators and would be intriguing to investigate. If a combination of variable
active site residues had striking effects on reaction kinetics, the interactions could be visualized
by solving X-ray crystal structures of the CheY mutants in the presence of the stable phosphoryl
group analog BeF3
ACKNOWLEDGEMENTS
I would like to thank Dr. Robert Bourret and Dr. Ruth Silversmith for expert advice in
analyzing two-component systems, insight into potential mutant combinations, and guidance in
learning new and unfamiliar laboratory techniques over the course of the last year and a half. I
would also like to thank Thane Miller for the use of his database of the frequency of variable
residues D+2, T+1, and T+2, and his database of mutual information content of pairings within
receiver domains. Finally, I would like to thank Frederick Ferguson for the synthesis of PAM
and for the use of his purified wild type CheY.
Research in the Bourret/Silversmith lab is supported by grant R01GM050860 from the
REFERENCES
Appleby, J.L., & Bourret, R.B. (1998) Proposed signal transduction role for conserved CheY residue Thr87, a member of the response regulator active-site quintent. J. Bacteriol.180:
3563-3569.
Boesch, K. C., Silversmith, R. E., & Bourret, R. B. (2000) Isolation and characterization of nonchemotactic CheZ mutants of Escherichia coli. J. Bacteriol. 182: 3544−3552.
Bourret, R.B., Thomas, S.A., Page, S. C., Creager-Allen, R.L., Moore, A.M., & Silversmith, R.E. (2010) Measurement of response regulator autodephosphorylation rates spanning six
orders of magnitude. Meth. Enzymol.471: 89-114.
Creager-Allen RL, Silversmith RE, & Bourret RB. (2013) A link between dimerization and autophosphorylation of the response regulator PhoB. J Biol Chem, 288: 21755–21769.
Galperin, M. Y. (2010) Diversity of structure and function of response regulator output
domains. Curr. Opin. Microbiol. 13:150-159.
Gao, R., & Stock, A. M. (2010) Molecular strategies for phosphorylation-mediated regulation of
response regulator activity. Curr. Opin. Microbiol. 13:160-167.
Hess, J.F., Bourret, R.B., & Simon, M.I. (1991) Phosphorylation assays for proteins of the
two-component regulatory system controlling chemotaxis in Escherichia coli. Methods Enzymol
200: 188–204.
Immormino, R.M., Silversmith, R.E. & Bourret, R.B. (2016) A variable active site residue influences the kinetics of response regulator phosphorylation and dephosphorylation.
Biochemistry. 39: 5595-5609.
Keener, J., & Kustu, S. (1998) Protein kinase and phosphoprotein phosphatase activities of nitrogen regulatory proteins NTRB and NTRC of enteric bacteria: role of the conserved
amino-terminal domain of NTRC. Proc. Natl. Acad. Sci. U.S.A. 85: 4976-4980.
Lee, S.Y., Cho, H.S., Pelton, J.G., Yan, D., Berry, E.A., & Wemmer, D.E. (2001) Crystal structure of activated CheY. Comparison with other activated receiver domains. J. Biol. Chem.276: 16425-16431.
Lukat, G.S., Lee, B.H., Mottonen, J.M., Stock, A.M., & Stock, J.B. (1991) Roles of the highly conserved aspartate and lysine residues in the response regulator of bacterial chemotaxis. J. Biol. Chem. 266: 8348-8354.
Lukat, G.S., McCleary, W.R., Stock, A.M., & Stock, J.B. (1992) Phosphorylation of bacterial
response regulator proteins by low molecular weight phospho-donors. Proc. Natl. Acad. Sci.
U.S.A. 89: 718-722.
Lukat, G.S., Stock, A.M., & Stock, J.B. (1990) Divalent metal ion binding to the CheY protein and its significance to phosphotransfer in bacterial chemotaxis. Biochemistry 29: 5436– 5442.
Maniatis T., Fritsch E.F., & Sambrook J. (1982) Molecular cloning: A laboratory manual. (Cold Spring Harbor Laboratory, Cold Spring Harbor, NY).
Mayover, T.L., Halkides, C.J., & Stewart, R.C. (1999) Kinetic characterization of CheY phosphorylation reactions: Comparison of P-CheA and small-molecule phosphodonors.
Biochemistry, 38: 2259–2271.
Page, S.C., Immormino, R.M., Miller, T.H., & Bourret, R.B. (2016) Experimental analysis of functional variation within protein families: Receiver domain autodephosphorylation kinetics. J. Bacteriol.198: 2483-2493.
R.E. (2009) Matching biochemical reactions to the timescale of life: Structural determinants that influence the autodephosphorylation rate of response regulator proteins. J. Mol. Biol. 392: 1205-1220.
Sanders, D.A., Gillece-Castro, B.L., Stock, A.M., Burlingame, A.L., & Koshland, D.E. Jr. (1989) Identification of the site of phosphorylation of the chemotaxis response regulator
protein, CheY. J. Biol. Chem.264: 21770-21778.
Schuster, M., Silversmith, R. E., & Bourret, R. B. (2001) Conformational coupling in the chemotaxis response regulator CheY. Proc. Natl. Acad. Sci. U.S.A. 98: 6003−6008. Sheridan, R.C., McCullough, J.F., Wakefield, Z.T., Allcock, H.R., & Walsh, E.J. (1971)
Phospharamidic acid and its salts. Inorg. Synth. 13: 23–26.
Silversmith, R.E., & Bourret, R.B. (2017). Fluorescence measurement of kinetics of CheY
autophosphorylation with small molecule phosphodonor. Meth. Mol. Biol. In Press
Silversmith, R.E., Smith, J.G., Guanga, G.P., Les, J.T., & Bourret, R.B. (2001) Alteration of a nonconserved active site residue in the chemotaxis response regulator CheY affects
phosphorylation and interaction with CheZ. J. Biol. Chem. 276: 18478–18484.
Stewart, R.C. (1993) Activating and inhibitory mutations in the regulatory domain of CheB, the methylesterase in bacterial chemotaxis. J. Biol. Chem.268: 1921-1930.
Stock AM, Martinez-Hackert E, Rasmussen BF, Stock JB, Ringe D, & Petsko GA. (1993)
Structure of the Mg2+
-bound form of CheY and mechanism of phosphoryl transfer in bacterial chemotaxis. Biochemistry. 32: 13375-13380.
Thomas, S. A., Brewster, J. A., & Bourret, R. B. (2008) Two variable active site residues modulate response regulator phosphoryl group stability. Mol. Microbiol. 69: 453−465.
Thomas, S.A., Immormino, R.M., Bourret, R.B., & Silversmith, R.E. (2013) Nonconserved active site residues modulate CheY autophosphorylation kinetics and phosphodonor
preference. Biochemistry (USA). 52: 2262–2273.
Ulrich, L.E., & Zhulin, I.B. (2010) The MiST2 database: a comprehensive genomics resource on microbial signal transduction. Nucl. Acids. Res. 38: D401-D407.
Wolfe, A.J. (2010) Physiologically relevant small phosphodonors link metabolism to signal transduction. Curr. Opin. Microbiol.13: 204-209.
Wuichet, K., Cantwell, B.J., & Zhulin, I.B. (2010) Evolution and phyletic distribution of two-component signal transduction systems. Curr. Opin. Microbiol.13: 219-225.