Munich Personal RePEc Archive
The evolution of intra- and inter-sector
knowledge spillovers in the EU
Framework Programmes
Dumont, Michel and Tsakanikas, Aggelos
University of Antwerp, Laboratory of Industrial and Energy
Economics, National Technical University of Athens, Greece
2002
Online at
https://mpra.ub.uni-muenchen.de/70571/
The evolution of intra- and inter-sector knowledge
spillovers in the EU Framework Programmes
CESIT Discussion paper No 2002/01
January 2002
Cent r e f or t he Econom ic St udy
of Innovat ion and Technology
S i T
S i T
Cent r e f or t he Econom ic St udy
of Innovat ion and Technology
The evolution of intra- and inter-sector knowledge spillovers in the EU Framework Programmes
Michel Dumont*- Faculty of Applied Economics, University of Antwerp, Belgium Aggelos Tsakanikas- Laboratory of Industrial and Energy Economics, National Technical University
of Athens, Greece
Abstract
In this paper we compute knowledge spillovers springing from R&D co-operation in the EU Framework Programmes.
Contrary to most other methods we estimate spillovers in a direct way, following a limited number of assumptions.
Intra- and inter-sector spillovers are computed for the first four FWPs, to analyse the evolution of the pattern of co-operation in response to policy and other (e.g. technology) shifts.
We endorse a ‘learning by networking’ perspective, which acknowledges that knowledge flows are not limited to flows of codified information and argue that measuring spillovers is essential in assessing the rationale and the impact of network-promoting policies.
*
1. Introduction
Although, as can be learned from the burgeoning (game-)theoretical literature on spillovers and R&D co-operation, the magnitude and specific nature of spillovers is a crucial factor for the rationale of a policy to promote and subsidise R&D co-operation, there has been relatively little empirical investigation of spillovers in general, and spillovers within the EU Framework Programmes (FWPs) in specific.
In this paper we apply the method, proposed in Dumont and Tsakanikas (2001 a, b), to measure knowledge spillovers springing from co-operation in R&D.
Contrary to most other methods of measuring spillovers, we clearly define the spillover mechanism and estimate knowledge spillovers in a direct way, following a limited number of prior assumptions. By focusing on spillovers through subsidised R&D co-operation within the EU FWPs we can assess the impact of a large-scale network promoting policy. As Jaffe (1998) argues in his assessment of the US Advanced Technology Program (ATP), evaluating a program of which the rationale is to create spillovers, implies an attempt to measure spillovers.
We use data on inter-firm linkages established within the EU Framework Programmes (FWPs) of subsidised cross-national ‘pre-competitive’ collaboration in R&D.
We compute intra- and inter-sector spillovers for each of the first four FWPs, to analyse the evolution of the pattern of co-operation in response to policy and other (e.g. technology) shifts.
2. Evolution of the EU FWP funding
In the beginning of the 80’ concerns were raised that the EU economy was falling behind the US and Japan, especially in the area of ICT. The formation of a Programme promoting collaborative research in this specific area was the first action the EU took in order to face decreasing market shares in this sector. ESPRIT 1 was established in collaboration with 12 large European ICT firms in order to strengthen the scientific and technological basis. However, the official basis for the implementation of science and technology policy in the European Union was created only in 1987, when the legal enactment of the First Framework Programme was established in the Single European Act. ESPRIT 1 served as a model and spirited the creation of a general ‘’umbrella typed’’ Framework which included programmes in other technological areas as well. The official basis has been modified since, under the 1993 Maastricht Treaty and also under the 1996 Amsterdam Treaty, giving the ‘’final’’ shape to what we today call the EU RTD policy. Its implementation is carried out through three major mechanisms:
• Shared cost contract RTD projects • Concerned actions
• Own research activities taking place in a network of European Research Centers: the Joint
Research Centre (JRC)
Four Framework Programmes have already been completed (1984-1987, 1987-1991, 1990-1994 and 1994-1998) and the fifth is almost completed (1998-2002).
The budget allocations of the successive Framework Programmes reflect the shift in policy priorities, given to different research fields, of the European Commission.
The allocations over technological fields are the result of a consultation procedure involving the European Commission, the Council of Ministers, the European Parliament and the Economic and Social Committee.
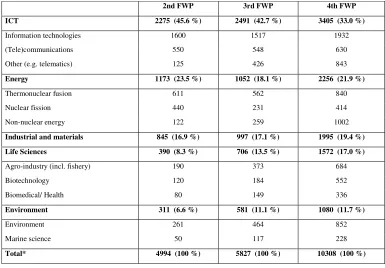
In table 1 we show the breakdown of the budget (millions of ECU) over the main technological fields in the second, third and fourth FWP. Over the years there have been changes in the naming and the content of these fields, but the table results from an harmonisation carried out by the Commission (European Commission, 1997, p. 503)
<Insert table 1>
The focus in the first FWPs was very much on information and communications technology (ICT), since this was, as pointed out above, the area which seemed the most in need of support. Priority was also given to the (nuclear) energy sector in this Framework.
In the Second Framework Programme, the RTD budget increased, although it was less than 3% of total government spending in RTD in the Members States and just about 1% of all (public and private) RTD spending (Peterson and Sharp, 1998).
Information and communications technology has, from the second FWP onwards, always been the
The focus within the ICT budget shifted from strengthening international competitiveness of European IT firms in the first FWPs to technological support for the development of ICT infrastructure, with an increased budget for telematics applications (European Commission, 1997, p. 506).
Energy recorded the sharpest decrease over the FWPs with a budget share dropping from almost 50 %
in the first FWP to 21.9 % in the fourth FWP. However, due to the renewed interest in energy saving and the development of non-nuclear energy, its share increased considerably from the third to the fourth FWP.
Life Sciences witnessed the sharpest increase in budget share which, apart from the emergence of biotechnology as an important research field, also reflects the link with the policy of the Commission
regarding agriculture, health and nutrition. The budget share of environment increased from 6.6 % in the second to 11.7 % in the fourth FWP. Moreover, the Commission claims that almost all FWP technological fields consider environmental aspects (e.g. encouraging environment-friendly technologies) (European Commission, 1997, p. 507).
In recent FWPs efforts are directed towards more international co-operation, dissemination and valorisation of the results of the projects, and human capital, training and mobility. The FWP objectives are fitted in a more general socio-economic policy framework, with e.g. attention to user-friendlyness of ICT and sustainable growth (European Commission, 1997, pp. 507-509). Furthermore, in the 4th Framework, efforts were made to link the EU RTD policy with regional development policies and to the general aim of socio-economic cohesion. Therefore, the objective of reducing the scientific and technological gap between members states gained priority.
3. Data
from the EU-RJV database, which contains information on cross-national R&D collaboration established in Europe through the FWPs2. Two basic criteria for developing this database have been used. First, we have selected programmes focusing mainly on industrial research and excluded those that simply provide support (e.g. disseminate information) or represent other EU actions. The database includes 64 Programmes from all FWPs, including large and well-known programmes (e.g. ESPRIT, BRITE/EURAM, RACE) but also some smaller programmes. At the project level we have only selected R&D consortia for which it was positively identified that they included at least one firm as participant3 (excluding e.g co-operation between universities).
The implementation of the above citeria resulted in a final inclusion of 9335 research consortia, covering an extensive period of 16 years (1983–1998). About 20499 organizations from 52 countries are responsible for 64476 participations in these research collaborations. However, the real value adding part of this database is the conjunction of this information with firm level data of the participants. Drawing on AMADEUS4, we managed to identify almost 40% of the firms participating in these consortia. Therefore data for 2722 European firms were retrieved, including sector information (primary activity in NACE 2 digit) that will be used in the analysis.
A complete list of the number of projects, the budget and average funding per project of each programme that is included in the database is shown in appendix. The last column in the appendix shows the number of projects that meet the criteria (e.g. at least one industrial partner) that were used to construct the datafile. Projects in the field of ICT (e.g. ESPRIT, ACTS, RACE, ENS), by far, have the highest average budget per project.
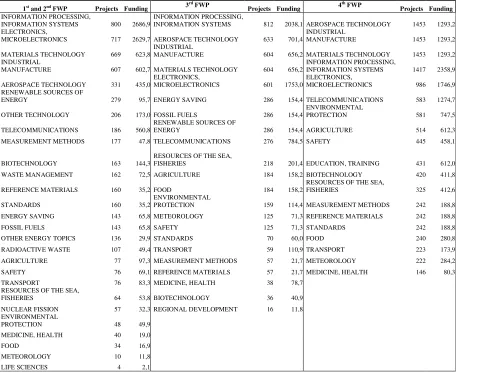
In table 2 the different technological fields in the first and second FWP, the third FWP and the fourth FWP, respectively, are classified according to the total number of projects included in the database, on
1
The database was constructed in the context of an EU funded TSER project entitled ‘’Science and Technology Policies Towards Research Joint Ventures’’ (Record Control Number 39084).
2
The primary source of information was CORDIS.
3
In cases where it was impossible (due to the poor quality of information) to identify an organization as a firm, we prefered to exclude them from the database.
4
condition of meeting the criteria discussed above (i.e. primarily the condition that at least one firm should be involved in the project).
< insert table 2>
The table reflects the relative diversification of policy priorities over the FWPs. Despite a significant increase in the total number of projects in the field of information processing and information systems in the fourth FWP, this field dropped from a first place in the three first FWPs to fourth place in the fourth FWP. The number of projects in aerospace technology more than doubled in each new FWP and this field recorded the highest number of projects in the fourth FWP. Materials technology and industrial manufacture hold a relatively stable and strong position in terms of number of projects in all
FWPs. For Environmental protection the number of projects tripled in each consecutive FWP and climbed from a 23rd position in the first and second FWP to a seventh position in the fourth FWP. Biotechnology witnessed a sharp increase in number of projects in the fourth FWP, after a
considerably decline in the third FWP.
A number of programmes, in the fields of biotechnology-biomedicine, environmental protection and energy, promote relatively more fundamental research than others, and are thereby characterised by a
high degree of co-operation between universities and research institutes, and a low involvement of industrial partners whereas programmes in the fields of ICT, materials technology and industrial manufacture cover more applied research and enjoy more interest from firms. There seems, however,
to have been a significant twist over time in the relative involvement of industrial partners. Programmes like BIOMED, BIOTECH and ENV witnessed an increase in the percentage of total projects that are withheld whereas for programmes like ESPRIT and BRITE-EURAM this percentage decreased considerably. In table 3 the NACE sectors are classified by the number of project memberships in the FWPs at the EU level. The first five sectors in terms of memberships represent over 40 % of all memberships.
explained by the large number of projects in aerospace technology (manufacture of aircraft and spacecraft is subsector 353).
<insert table 3>
4. The computation of spillovers within the FWPs
In this section we briefly describe the procedure that we use to compute spillovers springing from co-operation in the FWPs. For a more detailed discussion and the first application of this method we refer to Dumont and Tsakanikas (2001 a, b).
In Dumont and Tsakanikas (2001 a, b) we have argued that a public policy that would only draw conclusions from input/output-based methods, often used to analyse (embodied) spillovers, will probably be more inward- and backward looking than a policy that also considers indications as to the direction in which the international technological space will evolve, and that such a policy may moreover run the risk of promoting inefficient and collusive lock-in situations.
As input/output-based methods are acknowledged to be rather unreliable for small, open economies (Debresson and Hu, 1999), and international spillovers are often found to be more significant for this type of countries, an approach that precludes the shortcomings of i/o-analysis seems even more to be called for, for these countries.
The method that we propose to estimate disembodied knowledge spillovers5 focuses, in contrast to most other approaches, on a specific spillover mechanism that seems to have been somewhat neglected, i.e. co-operation in R&D. The reason of this neglect, despite the increasing co-operation in R&D, is probably that most scholars stick to the traditional strict definition of spillovers as externalities (e.g. Grossman and Helpman, 1992; Branstetter, 1998). Some recent definitions,
5
however, comprise the voluntary exchange of useful knowledge (e.g. Llerena and Matt, 1999; Rycroft and Kash 1999; De Bondt, 1999). If in co-operation between firms, the largest part of knowledge flows between partners can be regarded as intended, spillovers- sensu stricto- should be considered as an inevitable result of co-operation, as pointed out by Inkpen (1998). Interfirm collaboration in R&D can be seen as an agreement in which mutual spillovers are, if not intended, at least implicitly accepted.
In contrast to other methods of measuring disembodied spillovers (e.g. Jaffe 1986, 1989; Branstetter, 1998) we do not assume an unambiguous decreasing relationship between technological distance and spillovers. If technological proximity can clearly be seen as a good proxy measure for the absorptive capacity we consider, following Katsoulacos & Ulph (1998), the total spillover as the interaction of a knowledge flow component with a measure for absorptive capacity. Collaboration involving knowledge sharing between close competitors is for obvious reasons more problematic than between more distant partners. Moreover, as pointed out by Katsoulacos & Ulph (1998), research by (technologically) close competitors may involve a high degree of overlap and therefore a lower degree of useful knowledge transmission-intended or not- than research efforts by more complementary partners.
Our basic hypothesis is that the number of co-operative links between firms is a proxy measure for the underlying knowledge flows, and thus for the spillovers that spring from these flows, which are assumed to be proportionate to the knowledge flows.
We furthermore assume that in R&D projects more knowledge flows from the partners to the prime contractor than the other way round. Knowledge flows between ‘normal’ partners are assumed to be balanced.
Finally, we assume knowledge flows to be inversely related to the total number of participants in each project, to account for the fact that knowledge exchange is swifter in small than in large projects.
In box1 we give the mathematical definition of the spillovers.
To limit the analysis to the most significant sectors, we compute the matrix for the 25 most active sectors (at EU level) in terms of participation (see table 3). This results in matrices with 625 cells.
<insert box 1>
In Dumont and Tsakanikas (2001 a) we used domestic and foreign sector R&D stocks, computed from data on R&D expenditures, to weight the spillovers.
Domestic sector R&D stocks were taken as a proxy for absorptive capacity and foreign intra- and inter-sector R&D stocks as a proxy of the amount of knowledge that can spill over.
Due to a lack of data on R&D expenditures for a number of countries and sectors we prefer to perform the analysis on unweighted spillovers, which seems the more justified as weighting does not seem to alter the results considerably.
We consider three degrees of linkages. The strongest linkages are those linkages, representing more than 30 % of the total spillover flowing from a supplier-sector (aggregated over all countries and depicted in a box in the figures) to the given country recipient-sector (encircled sectors in figures) and more than 2 % of the total spillover for the given country. These are depicted by the thick arrows. The weaker linkages represent, respectively, fractions of 20 %-1% (normal arrow) and 10 %- 0.5% (dashed line).
As the number of projects increased considerably in each consecutive FWP there is a significant size difference. The first FWP represents 793 lines in our file, the second FWP 2122 lines, the third FWP 3374 and the fourth 5678 lines. To ensure some degree of comparability and to preclude a size bias we decided to merge the first and second FWP. This seems moreover justified as the major shift in policy priorities occurred from the third FWP onwards.
5. The pattern of intra- and inter-sector spillovers
In figure 1 we show the EU clusters of the strongest intra- and inter-sector spillover linkages in the three periods that were considered: FWP 1+2 (1984-91), FWP 3 (1990-94) and FWP 4 (1994-98).
<insert figure 1>
In agreement with the diversification of technological priorities after the second FWP the cluster of the third FWP is more diversified than the one emerging from co-operation in the first and second FWP.
However, this pattern seems to have slightly attenuated in the fourth FWP with a cluster consisting of less and weaker links.
The dominance of ICT, despite its decreased budget share, is revealed by the central position of sectors 30 (office machinery and computers), 31 (electrical machinery), 32, 64 (post and telecommunications) and 72.
Sector 32 holds the most central position in all three clusters, but is clearly on the receiving side. From the third FWP onwards the sector is only a strong knowledge supplier to firms within the same sector. The position of sectors 30 and 72 weakened over the FWPs with sector 30 dropping out of the fourth FWP cluster altogether.
The increasing importance of transport is reflected in the central position of transport sectors 34 and 35 in the most recent FWPs. The strong position of sector 35 is, as already mentioned before, easily explained by the importance of aerospace technology, as shown in table 2, the technological field with the highest number of projects in the fourth FWP.
With regard to the renewed interest in energy (saving), we find an intermediate strong intra-sector link of sector 40 (electricity, gas, steam and water supply) and a weak link of this sector with sector 74 (other business activities), both in the third and the fourth FWP.
In the fourth FWP a weak link between sector 24 (chemicals) and sector 73 (research & development) emerges. As can be seen in table 2, the number of projects in the field of biotechnology that meet the criterion of the involvement of at least one firm, increased considerably in the fourth FWP. This is due to an increase of the total number of projects but seems even more to be due to the increased involvement of firms.
A large number of small biotech firms relatively recently spun off from universities. These spin-offs are mainly classified in sector 736.
A number of ‘low tech’ sectors like 15 (food and beverages), 17 (textiles), 27 (basic metals) and 28 (fabricated metal products) appear in the clusters, but apparently all of their linkages are intra-sector.
6
Pre-competitive R&D collaboration is clearly not limited to ‘high tech’ sectors, but ‘low tech’ sectors do not seem to receive much knowledge, through the FWPs, from other sectors. Trusting in the participation in FWPs, throws some doubt on the Pavitt taxonomy. Pavitt (1984) classifies sectors in a number of categories. ‘Low tech’ sectors like textiles are classified as ‘supplier dominated’ and are considered to be highly dependent on external sources for technology and to perform little own R&D whereas ‘high tech’ sectors are defined as ‘science based’ and considered to perform much own R&D and to have close contacts with universities and research institutes. In Dumont and Tsakanikas (2001 b) ‘low tech’ sectors like food and beverages (Nace 15) and textiles (Nace 17) had already be found to co-operate relatively much with universities and research institutes whereas ‘high-tech’ sectors like electronic equipment (Nace 32) and instruments (Nace 33) co-operate relatively little.
The degree of intra-sector linkages slightly decreased from 27 % in the first and second FWP to 24 % in the fourth. The percentage of domestic intra-sector linkages increased from 22 % to 26 %. Firms have apparently become less reluctant to co-operate with domestic competitors over time. The convergence of both percentages over time may be an indication of European integration having blurred the distinction between domestic and foreign competitors.
Over all FWPs, firms were already more inclined to work with domestic competitors (22 % in the first period- 25 % in the third FWP and 26 % in the fourth FWP of all intra-sector spillovers) than with domestic firms outside the sector (respectively 22 %, 18 % and 22 % of all spillovers were domestic). The analysis being performed at the two digit level, the degree of intra-sector collaboration seems relatively low. If collaboration in R&D is indeed an important spillover mechanism, this casts some doubt on the assumed relationship between spillovers and technological proximity, unless technological proximity, as a measure for absorptive capacity, outweighs the knowledge flow component of total spillovers. Kesteloot and Veugelers (1997) found that in private R&D alliances the search for complementarity is more important than technological relatedness.
co-operation in the FWPs is between firms from different industries they conclude that the FWP subsidies probably do not result in much additional efforts and information sharing. We believe this claim to be too pessimistic as to the benefits of collaboration. It rests on the assumption that information sharing is independent of operation, i.e. firms can fully share information without co-operating. However, If the tacit component of knowledge is important, co-operation can in our view result in knowledge flows between partners that could never be attained between non-co-operating firms.
For all four FWPs combined, the degree of intra-sector spillovers was found to be positively and significantly linked to country size (GDP). A breakdown over the different FWPs reveals that this positive correlation applies to the first and second FWP but disappears over time. For the first and second FWP the correlation (0.59) is highly significant but for the third FWP the correlation (0.35) no longer is.
For the fourth FWP the correlation even turns, be it insignificantly, negative (-0.08).
This finding may be explained by the dominant position, in the first FWPs, of the so-called ‘Big 12’, the 12 largest European IT firms, almost all originating from large countries. In 1983 more than 70 per cent, and by 1986 still more than half of the ESPRIT budget (the largest IT programme at the time) was granted to these firms, which to a large extent co-operated with one another (Peterson, 1991; Sandholtz, 1992).
firms with complementary capabilities, contacts that might never have been established without the instrument of the FWPs.
Countries with a large number of objective 1 regions like Greece, Ireland, Portugal and Spain have a small degree of domestic linkages and thus highly depend on foreign partners for collaboration.. This finding shows the increasing importance of the Framework Programmes for the participating firms located in the ‘’cohesion countries’’. Sharp (1998) already pointed out the ‘’small but steady rise in the shares of cohesion countries in partnerships’’. In European Commission (1997) the impact of the FWPs on cohesion within the EU is analysed in detail. There are indications that the FWPs succeed in joining European centers of excellence to lagging EU regions but that this is limited to a happy few (Ireland, Lisbon and Attiki) and often limited to a small number of universities and research centers without many spillovers to local firms ( European Commission, 1997, pp. 379-398).
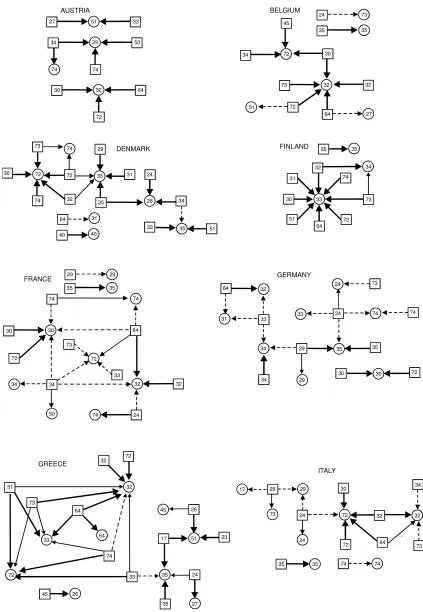
In figure 2, figure 3 and figure 4 we show the country clusters, respectively for the period of the first and the second FWP, the third FWP and the fourth FWP. From these national clusters we can see that the EU clusters from figure 1 conceal considerable differences between countries in the pattern of sector spillovers.
We will not discuss the country clusters in detail but will just comment on a number of aspects.
<insert figure2, figure 3 and figure 4>
The clusters reveal the policy priorities of the Commission and the shift over time, but as ICT projects still received over 30 % of the total budget in the fourth FWP, the dominant ICT linkages somewhat blur the evolution of the spillover pattern over the FWPs.
We therefore carry out a shift-share analysis, traditionally used to analyse the dynamics of export market shares (e.g. Fagerberg and Sollie, 1987), in which we consider the total spillover pool in a given FWP as a ‘market’. For each country and each possible intra- or inter-sector spillover link we compute a ‘market’ share. The shift-share analysis consists in decomposing the change of the ‘market’ share (between the 1st + 2nd FWP and the third FWP and between the third and the fourth FWP respectively) in three effects: the share effect measures the extent to which the total change of the share can be explained by a change of the share, measured at a fixed share composition at the EU level, and can therefore be seen as a competitiveness measure7, the composition effect measures the part of the total share explained by a change in the composition of the EU matrix, keeping the individual shares fixed. Finally, the adaptation effect, which is an interaction effect, reflects the part of the total change due to a move towards or away of links that become more or less important at the EU level.
The analysis allows to establish the degree to which the share of a given EU country in the ‘market of FWP co-operation’ increased or decreased and whether this can be explained by the competitiveness, the specialisation and the adaptability of intra- and inter-sector linkages.
In table 4 we list the 20 strongest intra- and inter-sector links (on a total of 625 possible links) in terms of their share in the total EU spillover pool. In the first and second FWP the top 20 linkages account for 41.7 % of all linkages. This decreased to 30.8 % in the third FWP to slightly increase again to 32.2 % in the fourth FWP which confirms the impression from the clusters in figure 1 that in terms of intra- and inter-sector co-operation the third FWP was more diversified than the first two FWPs and that the diversification slightly decreased in the fourth FWP.
Intra-sector spillovers of sector 35 overtook intra-sector spillovers of sector 32 in terms of importance in the fourth FWP.
The importance of transport is confirmed by the high number of linkages with either sector 34 or 35 in the top 20 and the appearance of their intra-sector linkages in the top 3 both in the third and fourth FWP.
Energy sector 40 holds a fifth position both in the third and the fourth FWP and somewhat surprisingly
the ‘low tech’ sector 17 (textiles) is in sixth position in the third FWP. True enough, textiles drops from the top 20 in the fourth FWP.
In general the list confirms the dominance of ICT related linkages over all FWPs. There is an apparent shift from hardware and to a lesser extent also from software to ICT equipment, trusting that sector 30 (office machinery and computers) drops from a second place (intra-sector) in the first and second FWP to the 17 th position in the third FWP, to fall out the top 20 altogether in the fourth FWP. In the fourth FWP all linkages (intra and inter-sector) of sector 30 drop from the top 20 list. The total number of linkages of sector 72 in the top 20 decrease from 7 in the first period to 5 in the third FWP and to only 3 (two of which are with sector 32) in the fourth FWP. The number of linkages of sector 32 on the other hand decrease from 6 in the first period to 5 in the third FWP but increase to 7 in the fourth FWP.
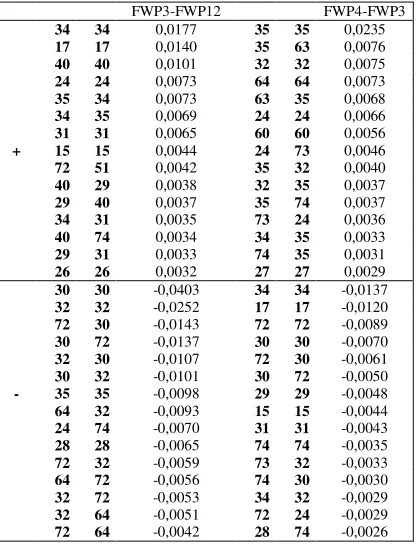
This shift becomes even more apparent from table 5 which lists the 15 fastest growing linkages and the 15 fastest declining spillover linkages at the EU level, resulting from the shift-share analysis.
<insert table 5>
Sectors 30, 32 and 72 are the sharpest declining sectors, obviously as a result of the diversification of policy priorities, in the third FWP compared to the first and second FWP, but whereas sector 32 recovers in the fourth FWP, the position of sectors 30 and 72 further decline. The list reveals the sharp
7
increase in the third and the fourth FWP of transport sectors 34, 35 and 63 (supporting and auxiliary transport activities) and energy sector 40 in the third FWP.
There is a sharp increase of intra-sector co-operation in sector 64 (post and telecommunications). This is the sector of former national (monopolist) telecom operators. The deregulation and liberalisation of the EU telecom market, which started in 1987 with the publication of the Green Paper on the development of the common market for telecommunications services and equipment, culminated in the liberalisation of basic voice telephony services in 1998. Many public operators have since been privatised and the sector witnessed a large number of mergers and acquisitions. Telecommunications has an increasing share in the ICT market (Dumont and Meeusen, 1999).
The sharp increase of the intra-sector links of ‘low tech’ sectors 17 (textiles) and 15 (food and beverages) in the third FWP is almost entirely undone by a proportionate decrease in the fourth FWP.
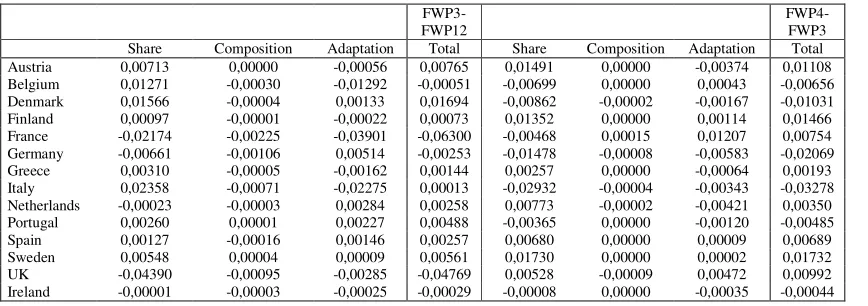
In table 6 we report the overall shift-share effects of individual EU countries.
Comparing the change of total shares between the third FWP and the period of the first two FWPs, shows that large countries like France, Germany and the UK witnessed the sharpest decline in their shares, to a large extent due to a negative share effect, and small countries like Austria, Denmark and Sweden witnessed the highest increase, again to a large extent explained by a (positive) share effect. In the fourth FWP large countries like Italy and Germany lost shares and small countries like Sweden, Finland and Austria gained shares.
The sharp gain in shares of the latter three countries should not come as a surprise, given that they only officially joined the EU in 1995 (i.e. in the period of the fourth FWP).
<insert table 6>
period (1984-91) and the third FWP (1990-94) on the other hand. This would indicate that the evolution of the participation of a country in the ‘pre-competitive’ FWPs is to some extent a leading indicator of future GDP per capita growth. Given the crudeness of this measure, we will not take the point as far as suggesting that this can be seen as evidence of a positive impact of FWP participation on economic growth, but this result seems interesting enough to go into this matter in future research.
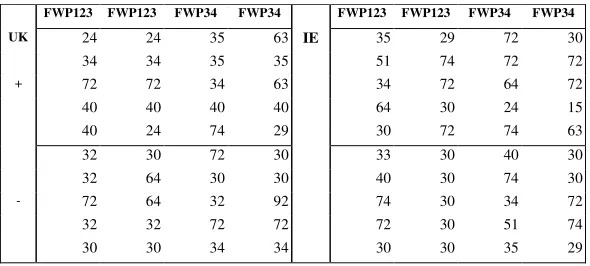
In table 7 we list the top 5 of the most positive and the top 5 of the most negative total shift-share effects for individual EU countries. This list shows which intra- and inter-sector spillovers contributed most to the overall change of the share of a given country.
Belgium, Germany and Ireland are the only countries for which the share decreased over all FWPs, as table 6 shows. The constant market share analysis performed by Van Essen and Verspagen (1997) reveals that, of a group of 10 countries, Germany and Belgium witnessed the sharpest decline in their high-tech market shares in the period 1988-1994.
From table 7 we see that for Germany and Ireland this is to a large extent due to the tenacity of sector 30 which lost ground at the EU level. Ireland, as can also clearly be seen from the scanty country clusters, seems to have ensconced itself in ICT related industries which contributed to its decreased share in the EU spillover pool.
<insert table 7>
7. Conclusions
In this paper we apply the method, proposed in Dumont and Tsakanikas (2001 a, b), of computing knowledge spillovers in inter-firm R&D co-operation, to analyse the changing pattern of intra- and inter-sector collaboration in the ‘pre-competitive’ Framework Programmes (FWPs) of the EU.
The evolution reflects the shift in policy priorities of the European Commission but also of technology shifts in the economic space.
Despite a diversification of technological fields, ICT remained the dominant area over all FWPs, with a budget share of still more than 30 % in the fourth FWP. A steady growth in the number of private interfim alliances in ICT has been reported (Hagedoorn, 1993), indicating a general trend in the linkages that have been established in the European area. In addition Santagelo (2000), following the technological overlap notion of Mowery et al. (1998) finds that such a factor is crucial for the
formation of strategic technological partnerships among similar ICT companies. Therefore it is not
suprising that sector 32 (radio, television and communication equipment) holds a central position as a knowledge receiver in all FWPs. The precompetitive nature of the Framework Programmes does not seem to affect the general picture obtained from other partnerships as well (Hagedoorn and Schakenraad, 1990)
Sectors 30 (office machinery and computers) and sector 72 (computer and related services) steadily lost ground, indicating a shift away from hardware and to a lesser extent from software to equipment. Following the increased budget share of the field of transport policy sector 34 (motor vehicles) but especially sector 35 (other transport equipment) have become both strong knowledge suppliers and spillover recipients over time, and hold a central position in the spillover clusters of the most recent FWPs.
Some ‘low tech’ (or “traditional”) industries like 15 (food and beverages), 17 (textiles), 27 (basic metals) and 28 (fabricated metal products) appear in the clusters of strong spillover links, but
apparently all of these linkages are intra-sector, indicating that pre-competitive R&D collaboration is not restricted to ‘high tech’ sectors. These ‘low tech’ sectors, however, seem to be highly self-reliant and do not receive much knowledge, through the FWPs, from other sectors. This finding, as well as data on the degree of co-operation of sectors with universities and research institutes, suggests that the taxonomy of Pavitt (1984), which primarily classifies ‘low tech’ sectors as ‘supplier dominated’ and ‘high tech’ sectors as ‘science based’, does not plainly apply to co-operation in R&D, at least not to co-operation within the FWPs.
An analysis at the country level reveals the country specificity of the intra- and inter-sector pattern of co-operation. Firms from small countries significantly rely more on foreign partners than firms from large countries, which again reveals the importance of networking for small countries, to make up for the insufficient scale and the lack of appropriate domestic partners. This finding also applies to the so-called “cohesion countries”. Sharp (1998) already pointed out the ‘’small but steady rise in the shares of cohesion countries in partnerships’’. The data reported in European Commission (1997) show that EU centres of excellence have joined with partners from lagging countries but that this is often limited to a happy few regions and a small number of universities and research centres with little spillovers to local firms so far.
Apart from the linkages created and the spillover effect that takes place, firms need to develop proper absorptive capacity (Cohen and Levinrthal, 1990) in order to fully benefit from this effect. That is why further research with data at the firm level could link the ‘’external’’ knowledge transfer phenomenon, captured by the spillover flow component, with the ‘’internal’’ processes that each firm uses in order to absorb and use this knowledge.
period 1992-1996, but the crudeness of this measure restrains us of drawing any other conclusion than that this matter certainly deserves further consideration.
We believe that the proposed method to measure knowledge spillovers, following a limited number of assumptions and focusing on a specific and important if not somewhat neglected spillover mechanism, can be useful in the empirical analysis of spillovers in general, and can, more specifically, be instrumental in the assessment of a public policy of which, at least implicitly, the creation of spillovers is an important rationale.
Appendix : FWP programmes included in the RJV database
Programme Acronym FWP
Number of Projects
Budget (million ECUs)
Average funding per
project Criteria
ACTS 4th FWP 154 671 4,36 152
AERO 0C 2nd FWP 28 35 1,25 28
AERO 1C 3rd FWP 34 53 1,56 29
AGRIRES 3C 1st FWP 113 50 0,44 1
AIM 1 2nd FWP 43 20 0,47 36
AIM 2 3rd FWP 44 97 2,20 35
AIR 3rd FWP 436 377 0,86 184
BAP 1st FWP 366 75 0,20 69
BCR 4 2nd FWP 265 59,2 0,22 160
BIOMED 1 3rd FWP 274 151 0,55 3
BIOMED 2 4th FWP 674 374 0,55 146
BIOTECH 1 3rd FWP 156 186 1,19 33
BIOTECH 2 4th FWP 492 595,5 1,21 274
BRIDGE 2nd FWP 97 100 1,03 49
BRITE 1st FWP 219 185 0,84 206
BRITE/EURAM 1 2nd FWP 378 499,5 1,32 303
BRITE/EURAM 2 3rd FWP 472 770 1,63 388
BRITE/EURAM 3 4th FWP 2058 1833 0,89 1453
CAMAR 2nd FWP 80 55 0,69 21
CLIMAT 3C 1st FWP 108 17 0,16 0
CRAFT 3rd FWP 539 57 0,11 216
DECOM 2C 1st FWP 74 12,1 0,16 6
DECOM 3C 2nd FWP 73 31,5 0,43 31
DRIVE 1 2nd FWP 69 60 0,87 67
DRIVE 2 3rd FWP 66 124,4 1,88 59
ECLAIR 2nd FWP 42 80 1,90 41
ENNONUC 3C 1st FWP 789 175 0,22 136
ENS 3rd FWP 14 41,3 2,95 13
ENV 1C 3rd FWP 560 319 0,57 125
ENV 2C 4th FWP 715 914 1,28 222
EPOCH 2nd FWP 34 40 1,18 10
ESPRIT 1 1st FWP 241 750 3,11 234
ESPRIT 2 2nd FWP 435 1600 3,68 380
ESPRIT 3 3rd FWP 605 1532 2,53 483
ESPRIT 4 4th FWP 1599 2084 1,30 834
EURAM 1st FWP 87 30 0,34 62
EURET 2nd FWP 9 25 2,78 9
FAIR 4th FWP 632 739,5 1,17 240
FAR 2nd FWP 127 30 0,24 16
FLAIR 2nd FWP 34 25 0,74 17
FOREST 2nd FWP 38 12 0,32 14
HYMGEN C 2nd FWP 29 15 0,52 4
JOULE 1 2nd FWP 267 122 0,46 143
JOULE 2 3rd FWP 401 217 0,54 286
LIBRARIES 3rd FWP 51 22,5 0,44 35
LRE 3rd FWP 25 22,5 0,90 18
MAST 1 2nd FWP 48 50 1,04 48
MAST 2 3rd FWP 93 118 1,27 34
MAST 3 4th FWP 157 243 1,55 85
MAT 3rd FWP 178 67 0,38 57
MATREC C 2nd FWP 71 45 0,63 67
MHR 4C 2nd FWP 211 65 0,31 0
NNE-JOULE C 4th FWP 577 475
ORA 3rd FWP 19 14 0,74 16
RACE 1 2nd FWP 94 550 5,85 83
RACE 2 3rd FWP 123 554 4,50 118
RADWASTOM 3C 1st FWP 217 62 0,29 30
RADWASTOM 4C 2nd FWP 121 79,6 0,66 40
RAWMAT 3C 1st FWP 236 70 0,30 84
REWARD 2nd FWP 13 6 0,46 11
SMT 4th FWP 394 307 0,78 242
TELEMAN 2nd FWP 21 19 0,90 20
TELEMATICS 2C 4th FWP 641 913 1,42 431
TRANSPORT 4th FWP 336 263 0,78 223
Totals 17596 18709,6 9335
References
Branstetter, L.G., 1998,Looking for International Knowledge Spillovers: A Review of the Literature with Suggestions for New Approaches, Annales d’Economie et de Statistique 49-50, ***.
Coe, D.T. and E. Helpman, 1995, International R&D spillovers, European Economic Review 39, 859- 887.
Cohen, W.M. and D.A. Levinthal, 1990, Absorptive capacity. A new perspective on Learning and Innovation, Administartive Science Quarterly 35, 128-152.
De Bondt, R., 1999, Spillovers and innovative activities, International Journal of Industrial Organization 15, 1-28.
DeBresson, C. and X. Hu, 1999, Identifying Clusters of Innovative Activities: A New Approach And A Tool Box, in: T. Roelandt and P. Den Hertog (Editors), Cluster Analysis and Cluster- Based Policy Making in OECD Countries (OECD, Paris) pp.27-59.
Dumont, M. and W. Meeusen, 1999, The Impact of the RTD Policy of the EU on Technological Collaboration: A case study of the European Telecommunications Industry , in :W.Meeusen (Editor), Current Issues in European Economic Policy (Edward Elgar, Cheltenham) pp.135- 156.
Dumont, M. and A. Tsakanikas (2001 a), Knowledge spillovers through R&D networking, in: OECD (Editor), Innovative Firm Networks (OECD,Paris), *** to be published.
March.
European Commission ,1994, The European Report on S&T Indicators 1994, DG XII, (Office for the Official Publications of the European Commission, Luxembourg).
European Commission ,1997, The Second European Report on S&T Indicators 1997, DG XII, (Office for the Official Publications of the European Commission, Luxembourg).
Fagerberg, J. and G. Sollie, 1987, The method of constant market shares analysis reconsidered, Applied Economics 19, 1571-1583.
Griliches, Z., 1992, The Search for R&D Spillovers, Scandinavian Journal of Economics 94 (Supplement), 29-47.
Grossman, G.M. and E. Helpman, 1992, Innovation and Growth in the Global Economy (MIT Press, Cambridge).
Hagedoorn, J., 1993, Understanding the rationale of strategic technology partnering: Inter-
organizational modes of cooperation and sectoral differences, Strategic Management Journal 14, 371-385.
Hagedoorn, J. and J. Schakenraad, 1990, Inter-firm partnerships and cooperative strategies in core technologies in: C.Freeman and L.Soete (Editors), New Explorations in the Economics of Technological Change (Pinter, London) pp. 3-87.
Hauknes, J., 1999, Norwegian Input-Output Clusters and Innovation Patterns, in : OECD (Editor), Boosting Innovation: The Cluster Approach (OECD, Paris) pp. 61-90.
Inkpen, A.C., 1998, Learning and knowledge acquisition through international strategic alliances, Academy of Management Executive 12(4), 69-80.
Jaffe, A.B.,1986, Technological Opportunity and Spillovers of R&D: Evidence from firms’ Patents, Profits and Market Value, American Economic Review 76 (5), 984-1001.
Jaffe, A.B., 1989, Characterizing the “technological position” of firms, with application to quantifying technological opportunity and research spillovers, Research Policy 18, 87- 97.
Jaffe, A.B., 1998, The Importance of “Spillovers” in the Policy Mission of the Advanced Technology Program, Journal of Technology Transfer 23, 11-19.
Katsoulacos, Y. and D. Ulph, 1998, Endogenous Spillovers and the Perfomance of Research Joint Ventures, Journal of Industrial Economics 46(3), 333-359.
Kesteloot, K. & R. Veugelers, 1997, Stable R&D Cooperation between Asymmetric Partners’, in: S. Poyago-Theotoky (Editor), R&D Cooperation: theory and evidence (Mac Millan, London) pp. 97-125.
Llerena, P. and M. Matt, 1999,Inter-organizational collaboration: the theories and their policy implications, in: A. Gambardella and F. Malerba (Editors), The Organization of Economic Innovation in Europe (Cambridge University Press, Cambridge) pp.179-201.
cooperation: implications for the resource based view of the firm, Research Policy 27, 507- 523.
OECD, 1999 a, Boosting innovation : The Cluster Approach (OECD,Paris).
OECD, 1999 b, Managing National Innovation Systems, (OECD, Paris).
Pavitt, K.,1984, Sectoral Patterns of Technical Change: Towards a Taxonomy and a Theory,
Research Policy 13, 343-373.
Peterson, J., 1991, Technology Policy in Europe: Explaining the Framework Programme and Eureka in Theory and Practice, Journal of Common Market Studies 29 (3), 269-290.
Peterson, J. and M. Sharp, 1998, Technology Policy in the European Union (Macmillan Press, London).
Rycroft, R.W. and D.E. Kash, 1999, Innovation Policy for Complex Technologies, Issues in Science and Technology Online, Fall 1999, http://www.nap.edu/issues/16.1/rycroft.htm.
Sandholtz, W., 1992, ESPRIT and the Politics of International Collective Action, Journal of Common Market Studies 30 (1), 1-21.
Santagelo, G.D., 2000, Corporate strategic technological partnerships in the European information and communication technology industry, Research Policy 29 (9), 1015-1031.
Table 1: FWP funding (Mecu) of different technological areas
2nd FWP 3rd FWP 4th FWP
ICT 2275 (45.6 %) 2491 (42.7 %) 3405 (33.0 %)
Information technologies 1600 1517 1932 (Tele)communications 550 548 630 Other (e.g. telematics) 125 426 843
Energy 1173 (23.5 %) 1052 (18.1 %) 2256 (21.9 %)
Thermonuclear fusion 611 562 840 Nuclear fission 440 231 414 Non-nuclear energy 122 259 1002
Industrial and materials 845 (16.9 %) 997 (17.1 %) 1995 (19.4 %)
Life Sciences 390 (8.3 %) 706 (13.5 %) 1572 (17.0 %)
Agro-industry (incl. fishery) 190 373 684
Biotechnology 120 184 552
Biomedical/ Health 80 149 336
Environment 311 (6.6 %) 581 (11.1 %) 1080 (11.7 %)
Environment 261 464 852
Marine science 50 117 228
Total* 4994 (100 %) 5827 (100 %) 10308 (100 %)
Table 2: Number of projects in different technological FWP fields8
1st and 2nd FWP Projects Funding 3rd FWP Projects Funding 4th FWP Projects Funding
INFORMATION PROCESSING,
INFORMATION SYSTEMS 800 2686,9
INFORMATION PROCESSING,
INFORMATION SYSTEMS 812 2038,1 AEROSPACE TECHNOLOGY 1453 1293,2 ELECTRONICS,
MICROELECTRONICS 717 2629,7 AEROSPACE TECHNOLOGY 633 701,4
INDUSTRIAL
MANUFACTURE 1453 1293,2 MATERIALS TECHNOLOGY 669 623,8
INDUSTRIAL
MANUFACTURE 604 656,2 MATERIALS TECHNOLOGY 1453 1293,2 INDUSTRIAL
MANUFACTURE 607 602,7 MATERIALS TECHNOLOGY 604 656,2
INFORMATION PROCESSING,
INFORMATION SYSTEMS 1417 2358,9 AEROSPACE TECHNOLOGY 331 435,0
ELECTRONICS,
MICROELECTRONICS 601 1753,0
ELECTRONICS,
MICROELECTRONICS 986 1746,9 RENEWABLE SOURCES OF
ENERGY 279 95,7 ENERGY SAVING 286 154,4 TELECOMMUNICATIONS 583 1274,7 OTHER TECHNOLOGY 206 173,0 FOSSIL FUELS 286 154,4
ENVIRONMENTAL
PROTECTION 581 747,5 TELECOMMUNICATIONS 186 560,8
RENEWABLE SOURCES OF
ENERGY 286 154,4 AGRICULTURE 514 612,3 MEASUREMENT METHODS 177 47,8 TELECOMMUNICATIONS 276 784,5 SAFETY 445 458,1 BIOTECHNOLOGY 163 144,3
RESOURCES OF THE SEA,
FISHERIES 218 201,4 EDUCATION, TRAINING 431 612,0 WASTE MANAGEMENT 162 72,5 AGRICULTURE 184 158,2 BIOTECHNOLOGY 420 411,8 REFERENCE MATERIALS 160 35,2 FOOD 184 158,2
RESOURCES OF THE SEA,
FISHERIES 325 412,6 STANDARDS 160 35,2
ENVIRONMENTAL
PROTECTION 159 114,4 MEASUREMENT METHODS 242 188,8 ENERGY SAVING 143 65,8 METEOROLOGY 125 71,3 REFERENCE MATERIALS 242 188,8 FOSSIL FUELS 143 65,8 SAFETY 125 71,3 STANDARDS 242 188,8 OTHER ENERGY TOPICS 136 29,9 STANDARDS 70 60,0 FOOD 240 280,8 RADIOACTIVE WASTE 107 49,4 TRANSPORT 59 110,9 TRANSPORT 223 173,9 AGRICULTURE 77 97,3 MEASUREMENT METHODS 57 21,7 METEOROLOGY 222 284,2 SAFETY 76 69,1 REFERENCE MATERIALS 57 21,7 MEDICINE, HEALTH 146 80,3 TRANSPORT 76 83,3 MEDICINE, HEALTH 38 78,7
RESOURCES OF THE SEA,
FISHERIES 64 53,8 BIOTECHNOLOGY 36 40,9 NUCLEAR FISSION 57 32,3 REGIONAL DEVELOPMENT 16 11,8 ENVIRONMENTAL
PROTECTION 48 49,9 MEDICINE, HEALTH 40 19,0 FOOD 34 16,9 METEOROLOGY 10 11,8 LIFE SCIENCES 4 2,1
Source: Adapted from Cordis CD-Rom (1999 III)
8
Table 3: EU sector distribution of FWP participation
NACE Description Number of
memberships
% Number of firms % Average number of
memberships per firm
32 Radio, television and communication equipment and apparatus
1387 11,4 152 5,8 9,1 74 Other business activities 1133 9,3 261 10,0 4,3 72 Computer and related services 925 7,6 142 5,4 6,5 35 Other transport equipment 911 7,5 66 2,5 13,8
24 Chemicals 787 6,5 175 6,7 4,5
34 Motor vehicles and trailers 704 5,8 57 2,2 12,4 29 Machinery and equipment n.e.c. 679 5,6 231 8,9 2,9 30 Office machinery and computers 504 4,1 54 2,1 9,3 73 Research and development 499 4,1 38 1,5 13,1 33 Medical, precision and optical instruments; watches
and clocks
482 4,0 139 5,3 3,5 51 Wholesale trade (except motor vehicles) 462 3,8 184 7,1 2,5 40 Electricity, gas, steam and water supply 434 3,6 57 2,2 7,6 31 Electrical machinery and apparatus n.e.c. 423 3,5 82 3,1 5,2 64 Post and telecommunications 414 3,4 33 1,3 12,5 27 Basic metals 295 2,4 109 4,2 2,7 28 Fabricated metal products (except machinery and
equipment)
273 2,2 106 4,1 2,6 45 Construction 207 1,7 64 2,5 3,2 26 Non-metallic mineral products 161 1,3 75 2,9 2,1 15 Food and beverages 149 1,2 80 3,1 1,9
17 Textiles 140 1,1 68 2,6 2,1
50 Sale, repair and maintenace of motor vehicles 131 1,1 16 0,6 8,2 23 Cokes, refined petroleum products and nuclear fuel 124 1,0 23 0,9 5,4 60 Land transport 107 0,9 26 1,0 4,1 92 Recreational, cultural and sporting activities 91 0,7 22 0,8 4,1 63 Supporting and auxiliary transport activities 85 0,7 18 0,7 4,7
52 Retail trade 74 0,6 28 1,1 2,6
25 Manufacture of rubber and plastic products 71 0,6 41 1,6 1,7 11 Extraction of crude petroleum and natural gas 64 0,5 18 0,7 3,6 22 Publishing, printing, reproduction of recorded media 59 0,5 38 1,5 1,6 14 Other mining and quarrying 52 0,4 16 0,6 3,3
Other 351 2,9 188 7,2 1,9
Box 1: Mathematical definition of spillovers
Spillover from sector J (all countries) to sector I in country C:
SPcij = ΣΣΣΣn ΣΣΣΣk ΣΣΣΣl≠≠≠≠k (Dpc)/NPn [(Pnk∈∈∈∈ C AND Pnk∈∈∈∈ I AND Pnl∈∈∈∈ J) 1; 0]
C: country I, J: sector n: project number
k,l = 1... NPn
NPn: Number of participants in project n
Dpc =2if Pnk is prime contractor and 1 if not
Pnk: k-th participant in project n
34
Table 4: Top 20 of spillover linkages at EU level
FWP12 FWP3 FWP4
32 32 0,066 32 32 0,040 35 35 0,058
30 30 0,050 34 34 0,037 32 32 0,048
35 35 0,045 35 35 0,035 34 34 0,023
72 30 0,024 72 72 0,019 24 24 0,020
30 72 0,023 40 40 0,014 40 40 0,016
64 32 0,019 17 17 0,014 34 35 0,014
34 34 0,019 24 24 0,013 64 64 0,014
72 72 0,019 29 29 0,012 72 32 0,012
32 72 0,017 32 72 0,012 35 34 0,012
72 32 0,017 35 34 0,011 32 72 0,012
32 30 0,016 72 32 0,011 72 72 0,011
32 64 0,016 32 64 0,011 35 29 0,010
30 32 0,015 34 35 0,011 64 32 0,010
74 74 0,013 35 29 0,010 35 74 0,009
64 72 0,011 72 30 0,010 74 32 0,009
24 74 0,010 64 32 0,010 33 32 0,009
72 64 0,010 30 30 0,010 35 63 0,009
29 35 0,009 74 74 0,010 29 35 0,009
28 28 0,009 29 35 0,009 74 35 0,009
35
Table 5: Top 15 fastest growing and fastest declining linkages at the EU level
FWP3-FWP12 FWP4-FWP3
34 34 0,0177 35 35 0,0235
17 17 0,0140 35 63 0,0076
40 40 0,0101 32 32 0,0075
24 24 0,0073 64 64 0,0073
35 34 0,0073 63 35 0,0068
34 35 0,0069 24 24 0,0066
31 31 0,0065 60 60 0,0056
+ 15 15 0,0044 24 73 0,0046
72 51 0,0042 35 32 0,0040
40 29 0,0038 32 35 0,0037
29 40 0,0037 35 74 0,0037
34 31 0,0035 73 24 0,0036
40 74 0,0034 34 35 0,0033
29 31 0,0033 74 35 0,0031
26 26 0,0032 27 27 0,0029
30 30 -0,0403 34 34 -0,0137
32 32 -0,0252 17 17 -0,0120
72 30 -0,0143 72 72 -0,0089
30 72 -0,0137 30 30 -0,0070
32 30 -0,0107 72 30 -0,0061
30 32 -0,0101 30 72 -0,0050
- 35 35 -0,0098 29 29 -0,0048
64 32 -0,0093 15 15 -0,0044
24 74 -0,0070 31 31 -0,0043
28 28 -0,0065 74 74 -0,0035
72 32 -0,0059 73 32 -0,0033
64 72 -0,0056 74 30 -0,0030
32 72 -0,0053 34 32 -0,0029
32 64 -0,0051 72 24 -0,0029
36
Table 6: Country shift-share effects
FWP3-FWP12
37
Table 7: Top 5 of highest and lowest total shift-share effects at country level
FWP123 FWP123 FWP34 FWP34 FWP123 FWP123 FWP34 FWP34 FWP123 FWP123 FWP34 FWP34 FWP123 FWP123 FWP34 FWP34
AT 34 29 32 32 BE 64 32 34 72 DK 31 31 35 35 FI 24 24 64 51
32 73 33 32 51 32 35 35 29 31 64 64 45 24 24 24
+ 32 32 72 32 51 72 27 27 40 40 24 24 29 40 24 23
26 26 32 29 74 32 64 64 40 28 73 24 40 23 72 33 32 74 40 32 31 29 31 32 29 26 74 35 74 23 64 64 27 51 30 73 74 27 73 32 33 35 40 28 30 33 31 40 33 51 29 45 30 32 51 32 24 28 40 40 51 33 74 27
- 34 51 32 74 45 72 30 72 35 33 31 31 72 33 40 23
72 32 26 26 74 73 32 32 35 28 17 17 64 33 29 40 34 74 32 73 34 72 17 17 30 72 29 31 32 34 45 24
FR 15 15 35 35 DE 34 34 35 35 GR 32 72 64 64 IT 40 29 35 35
34 34 32 32 35 34 32 35 72 32 32 32 34 31 64 45
+ 72 51 34 35 34 35 32 74 29 27 64 51 29 32 64 72
34 35 63 35 40 40 50 34 72 72 40 72 35 29 24 24 92 32 72 32 24 24 60 60 30 72 30 32 74 31 32 72 72 30 74 74 74 24 35 34 72 33 35 72 64 72 17 24 24 74 15 15 32 30 32 31 26 51 32 72 30 32 72 30
- 30 72 30 30 64 32 29 29 45 26 17 17 32 72 30 72
32 32 72 30 72 30 17 17 24 27 72 72 32 32 32 32 30 30 34 34 30 30 34 34 35 35 29 27 30 72 72 72
NL 40 74 24 24 PT 24 40 40 40 ES 40 40 74 74 SE 40 40 35 34
51 74 34 34 32 64 26 45 29 40 74 72 32 32 34 34
+ 27 74 27 28 64 64 74 29 40 74 32 72 72 64 45 74
72 51 29 28 24 24 63 51 32 73 74 26 72 74 32 32 31 31 72 74 24 51 72 40 34 35 33 28 35 35 35 72 72 29 31 31 51 17 24 24 24 35 34 35 29 34 73 32 29 28 40 29 30 33 64 64 72 64 64 64 74 34 27 29
- 45 74 17 17 72 33 32 64 64 64 30 40 35 34 64 32
Table 7: continued
FWP123 FWP123 FWP34 FWP34 FWP123 FWP123 FWP34 FWP34
UK 24 24 35 63 IE 35 29 72 30
34 34 35 35 51 74 72 72
+ 72 72 34 63 34 72 64 72 40 40 40 40 64 30 24 15 40 24 74 29 30 72 74 63 32 30 72 30 33 30 40 30 32 64 30 30 40 30 74 30
GREECE 51 35 72 64 32 33 17 45 26 23 24 35 72 32 51 26 64 27 45 33 74 73
Figure 2: Country spillover clusters in the First and Second Framework Programme
Figure 3: Country spillover clusters in the Third Framework Programme AUSTRIA 26 74 40 31 29 34 26 33 74 45 92 40 29 24 32 24 32 73 30 73 72 29 17 64 32 35 17 BELGIUM 32 73 51 74 72 72 30 31 29 26 28 DENMARK 35 24 32 72 64 72 24 51 74 35 17 31 34 40 17 31 33 40 FINLAND 33 40 29 27 34 40 64 24 72 64 31 32 73 51 24 15 23 33 29 15 45 74 74 72 FRANCE 29 30 31 32 51 34 33 35 64 35 30 29 34 28 51 74 32 24 35 24 35 GERMANY 72 32 31 30 40 29 34 32
33 72 31
28 34
GREECE 23 27 24 51 15 17 35 72 35 64 17 32 24 29 31 72 30 32 51 ITALY 30 32
31 64 74
GREECE 17 29 51 23 64 33 35 32 27 72 30 64 31 27 24 32 40 72 73 35 74 51 ITALY 33 32 31 64 74 32 28 74 24 72 34 35 45 31 29 35 72 64 29 24 NETHERLANDS 45 24 45 40 72 74 35 28 29 31 51 64 64 28 74 32 34 60 32 31 92 27 51 24 27 34 40 PORTUGAL 63 51 17 32
74 24 29