Watershed Management by Using QGIS Software
Bangar Sunil. R 1, Patil Pramod. Z2, Kashid Vinod. H3
1
Department of Civil Engineering, Bharati Vidyapeeth’s College of Engineering Kolhapur, (India)
2
Department of Civil Engineering, Bharati Vidyapeeth’s College of Engineering Kolhapur, (India)
3
Department of Civil Engineering, Bharati Vidyapeeth’s College of Engineering Kolhapur, (India)
Abstract: Maharashtra government has launched the project "Jalyukt Shivar Abhiyaan" in a bid to make Maharashtra a drought-free state by 2019. The project aims to make 5000 villages free of water scarcity every year. For that purpose many NGO’s like NAMA and PAANI foundation are working for watershed management program at villages. The success of such programs depends on proper planning of watershed management structures. QGIS software is helpful in marking existing structures and can suggest the best suitable sites for rainwater harvesting structure. This paper includes the details methodology to prepare plan for watershed development of a village. For that purpose one village is selected from drought prone area. The village also participated in water cup competition of PAANI foundation. For that village, the village boundary map is prepaid. Existing structures are identified by using GPS Garmin eTrex 10. Using QGIS software land use land cover, slopes and soil maps are prepared. With reference to these maps, suitable sites for various rainwater harvesting structures like contour trench, gully plug, gabion structure, check dams, K.T. weir etc are suggested. This methodology results in saving in time and money along with fair accuracy. The plans of existing and new structure are found beneficially during actual implementation of project.
Keywords: Check dam, Contour trench, GPS, Gully plugs, gabion, K.T. weir, QGIS
I. INTRODUCTION
As we know rapidly increase in industrialization and population it’s also increase demand of water. Due increase in demand of water human extract more water from ground water table due to that depth of ground water table is reducing. For recharging ground water table we need to plan the watershed management. But we know watershed management is more time consuming to reduce the time we have to plan watershed management with the help of QGIS. Watershed is a unit of area covers all the land which contributes runoff to a common point a ridge line. QGIS is help full for extracting contours, defining slopes, generating land use land cover map it is also help full for generating map of existing rain water harvesting structures and plan new rain water harvesting structures. Planed new structure increase ground water level it also increase infiltration rate of land, reduce soil, reduce soil erosion.
II. LITRATURE REVIEW
Mudher N Abdulla (2011) carried out drainage analysis on a terrain model for Bekhma area. The Arc Hydro tools are used to derive several data sets that collectivity describe the drainage patterns of the catchments. Raster analysis is performed to generate data on flow direction, flow accumulation, stream definition, stream segmentation, and watershed delineation. These data are then used to develop a vector representation of catchments and drainage lines from selected points. The utility of Arc Hydro tools is used to develop attributes that can be useful in hydrologic modeling. The main data is the DEM with 1 arc second to get as much accurate results as could. Using this technique the author got very good results by comparing the Russian results introduced using the topo maps, with GIS technique while they used the collection of hard copy maps and they extracted the DTM from the contour lines and calculated the catchment area. Sarita Gajbhiye (2015) this study concentrated on Kanhaiya nala watershed located in Satna district of Madhya Pradesh using remote sensing and GIS. The total area of watershed 19.53 km2. Soil map, Land Use and slope map were generated in GIS Environment. GIS technique is a very reliable alternative or a dependable support system to our conventional way of surveying, investigation, planning, monitoring, modeling, data storing and decision making process. Subhash Chavare (2011), gave the methodology to analyze the relief of the Kolhapur district using SRTM data and GIS techniques. The elevation model derived from Shuttle Radar Topography Mission (SRTM) data is used for the relief analysis. Relief visualization study is important for the analysis of slope of particular area. In this study the slope of Kolhapur district is steep in western side and gentle towards the eastern side and from the slope analysis we can identify the drainage pattern of the area and watershed boundaries. Supakij Nontananandh and Burin Changnoi, (2012) carried out the coupling of a GIS and the USLE has been widely used and is a very effective approach for estimating the magnitude of soil loss and identifying spatial locations vulnerable to soil erosion. Yongsheng Ma (2004) stated that unless the watersheds are not managed in an integrated sustainable manner, then not only the water resources but also other resources such as vegetation, fertile soil, fauna and flora get depleted. Rational management of upper and lower parts of a watershed is equally important for the sustenance of the environment. Therefore it is extremely important to use an integrated spatial approach for managing watersheds and river basins. The remote sensing and GIS for watershed management constitutes theoretical aspects of Geographic Information Systems (GIS) & Remote Sensing and their application for watershed management.
III. MATERIAL AND METHODOLOGY
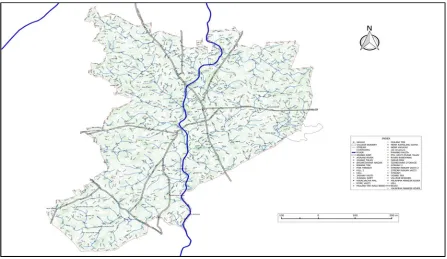
A. Select Area For Watershed Management
Fig. Location map
B. Reconnaissance Survey
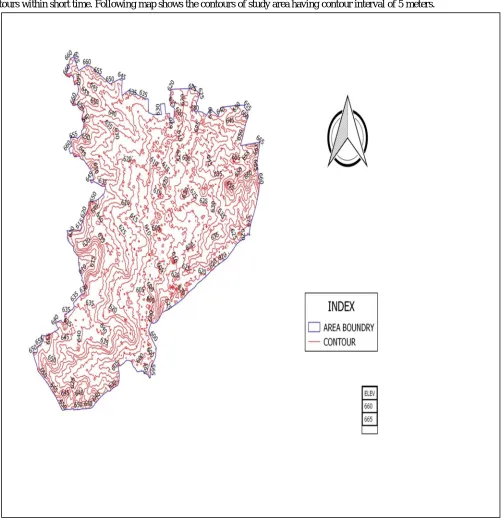
[image:4.612.83.530.445.704.2]C. By using QGIS Generate Contours
[image:5.612.56.557.104.623.2]As we know contouring is very lengthy process with the help of instruments but by using QGIS software we can able to calculate contours within short time. Following map shows the contours of study area having contour interval of 5 meters.
Fig. Contour map
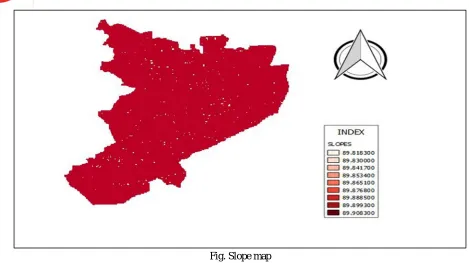
D. Preparation of Slope Map
Fig. Slope map
E. Planning Of New Structures
based on above information and depending on slopes, soil strata, elevation we can plan various structures suitable for that site can be plan with the help of QGIS.
IV. CONCLUSION
Remote sensing, GPS and software are very useful to plan rainwater harvesting structures like contour trench, gully plug, gabion structure, check dams, K.T. weir etc are quickly planed with the help of QGIS. QGIS is very easy to use and give more satisfactory result in short time as compare to manual planning.
REFERENCES
[1] Identification of rain water harvesting structures for yerala river using remote sensing and GPS by Abhijit M. Zende, kamalakishor. R Atal.
[2] Effectiveness of watershed management Means of economical development- A case study by Mrs. Sushma s. Kulkurani, Mr.Vidula A Swami, Mr. Vishal P. Kumbhar.
[3] Assesment of ground water potential zone by using GIS techniques in Yerala river basin, western Maharashtra India by Abhijit M. Zende, kamalakishor. R Atal [4] Analysis of surface runoff from Yerala river basin using SCS-CN and GIS by Abhijit M. Zende, kamalakishor. R Atal.
[5] http://www.universitywatersectorpartnership.org/ [6] https://earthexplorer.usgs.gov/