Influence of Sand Particles on Strength and
Durability of Mortar (1:3)
Ansari Aaquib1, Bhupesh Nandurkar2, Rajesh Bhagat3, Jayant Raut4, Veena Ganvir5, Vikash Agrawal6, Amol Kedar7, Pravin Sahare8
1,2,3,4
Civil Engineering Department, Yeshwantrao Chavan College of Engineering Nagpur, RTMNU, Nagpur, India
5, 6, 7
Civil Engineering Department, Priyadarshini College of Engineering, Nagpur, RTMNU, Nagpur, India
8
Civil Engineering Department, G. H Raisoni Academy of Engineering and Technology, Nagpur, RTMNU, Nagpur, India
Abstract: In recent years, research has been devoted for the improvement of the masonry mortar in order to achieve the optimum results towards the strength and durability. An experimental programme is presented in order to evaluate the influence of sand grading for the mortar mix (1:3) keeping the water cement ratio 0.5 constant. Six types of mortar mixes were prepared in the form of 70.6mmx70.6mmx70.6mm cubes confirming IS-10086-1982. Mortar specimens were cured for 7, 28 and 90 days through which compressive strength was tested for 7, 28 and 90 days, Drying shrinkage test was conducted on 250mmx25mmx25mm bar for 3, 7 and 35 days of moisture curing. Water absorption for 28 days and 90 days were observed and rest of the specimens were immersed in fresh water with solution of 3% HCL and 1% H2SO4 and tested at 30 days and 90 days from the day of immersion. Mix 04 with 60 % coarse and 40 % fine sand showing the optimum results toward the strength and durability.
Keywords: Cement Mortar, Sand grading, Compressive strength, water absorption, shrinkage, HCL, H2SO4.
I. INTRODUCTION
Mortar for the masonry work is a combination of cement, river sand and water. The mortar provides a level bed for the masonry. Study of different parameters like water cement ratio and particle size gradation is important. Every batch of sand receive is different from the previous supply [1]. Engineers have been looking for mortar which is ever stronger and more durable against aggressive environment. Mortar during its service life may expose to sulfate and acid attacks [2]. Fine aggregates (sand) make up the main bulk of masonry mortar therefore having the significant effect on the properties of product in both fresh and hardened state. The selection of suitable aggregate which are capable of producing a product with the optimum properties is very essential [3].
It has been found that mortar is influenced greatly by the type of sand and particle size grading of the sand. A preliminary study has been made to obtain information of the influence of sand grading on the properties of mortar .properties like Compressive strength and water absorption and durability has been studied to understand the effect of sand grading [4]. Modern mortars are typically made with a mixture of sand, a binder such as cement, pozzolanic materials and water. Engineers have been looking for mortar which is ever stronger and more durable against aggressive environments [5].
II. EXPERIMENTAL PROGRAMME
Under this programme different materials were selected. The cement was of OPC (43 grade) and physical, chemical properties of cement were determined. Similarly natural sand or river sand was used as a fine aggregate. These observations are described in the following sections.
A. Basic Materials and Their Properties
Ordinary Portland cement (OPC):- Ordinary Portland cement (ACC) brand comply with the Indian standards specification for 43
grade confirming IS-8112(2013) and tested as per IS – 4031.
1) River Sand (Fine aggregate): Fine aggregate is classified in two categories according to the Particle size Fine sand (FS) is natural sand which is passing through both 2.36mm and 600µ IS-Sieves and retaining in the pan in oven dried condition. Second type is coarse sand (CS) which is natural sand which is passing through 2.36mm and retaining on 600µ IS-Sieve and
retaining on the pan in oven dry condition. Concentrated acids HCL and H2SO4 were used for the durability test.
TABLE I
CHEMICAL COMPOSITION OF OPC (43 GRADE)
B. Preparation of Samples
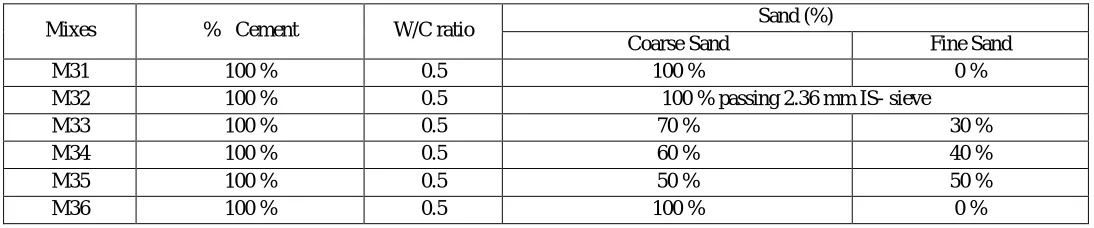
[image:3.612.30.581.376.561.2]Six types of mixes (1:3) were casted. The water cement ratio was maintained constant at 0.5 for all six mortar mixes. The sand cement was mixed thoroughly to ensure the homogeneity of mixes and each sample were prepared taking the quality and method of the mixing into consideration.
Table ii
Physical properties of opc (43grade)
C. Different Mortar Mixes and Combination for (1:3) Cement Sand Mortar
TABLEIIIDIFFERENTMORTARMIXESFOR1:
Characteristics Result Obtained Requirement Confirming IS
% Soluble silica % Alumina % Iron oxide % Lime % Magnesia % Insoluble residue % SO3
% loss of ignition Lime saturation factor
Proportion of alumina to iron oxide C3A % chloride 22.5 5.0 2.9 61.6 2.1 2.6 2.2 2.4 0.847 1.72 8.3 0.016 --- --- ---
Not more than 6% Not more than 4% Not more than 3.5% Not more than 5% Between 0.66 to 1.02 Not less than 0.66
Not more than 0.1 %
Test Conducted Results Obtained Requirement Confirming IS
Fineness m2/Kg 270 Not less than
Compressive Strength 3 days 7 days 28 days 34.5 40 53.5
Not less than23 Not less than33 Not less than Min43/Max58 Setting time (minutes)
Initial Final
190 260
Not less than30 Not more than 600 Soundness
Le-chatelier experiments. (mm) Autoclave expansion. (%)
0.00 0.033
Not more than 10mm Not more than 0.8% a) Normal consistency (%)
b) Temperature during testing (0C) c) % fly ash added
26.8 27+/-2
2.9 Not more than 5%
Mixes % Cement W/C ratio Sand (%)
Coarse Sand Fine Sand
M31 100 % 0.5 100 % 0 %
M32 100 % 0.5 100 % passing 2.36 mm IS- sieve
M33 100 % 0.5 70 % 30 %
M34 100 % 0.5 60 % 40 %
M35 100 % 0.5 50 % 50 %
[image:3.612.33.580.606.720.2]III. TESTING METHODOLOGY
Six types of mortar mixes were tested to evaluate compressive strength water absorption, drying shrinkage and acid attack test (durability). These tests were conducted on 70.6mmx70.6mmx70.6mm size cubes and 250mmx25mmx25mm shrinkage bar. The specimens were tested at different ages 7, 28 and 90 days compressive strength, water absorption for 28 and 90 days and drying shrinkage test for 3, 7, 35 and 90 day. The acid attack test conducted after initial water curing of 28 days. Durability test were determined by the compressive strength test. All six types of mixes were immersed in the solution of 3% HCL and 1% H2SO4 solution and were tested for 30 days after 28 days of initial water curing.
IV. RESULTS AND DISCUSSION
Following are some test results for the sand samples as well as other test conducted on the mortar mixes.
TABLE IVSPECIFIC GRAVITY OF FINE AGGREGATES
Table 4 shows Specific gravity of fine aggregates calculated as per IS-2386 (part-3) for each mortar mix and for different sand grading.
TABLE VFINENESS MODULUS OF FINE AGGREGATE
Table 5 shows the fineness modulus of different sand grading having value higher for coarser sand and lower for the finer sand as per the requirement of the Indian Standards.
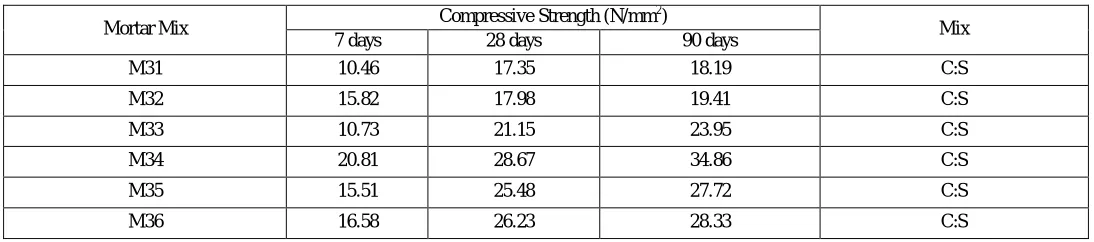
Table 6 shows the compressive strength of different mixes which is average of three samples M31 shows poor results toward the compressive strength for 7, 28 and 90 days but M34 shows better compressive strength.
TABLE VIAVERAGE 7,28 AND 90 DAYS COMPRESSIVE STRENGTH
Sand Grading Test Value
100 % CS 2.63
2.36 mm passing (conventional) 2.58
70 % CS + 30 % FS 2.64
60 % CS + 40 % FS 2.46
50 % CS + 50 % FS 2.48
100 % FS 2.42
Sand Grading Test Value
100 % CS 2.72
2.36 mm passing (conventional) 3.36
70 % CS + 30 % FS 2.96
60 % CS + 40 % FS 2.80
50 % CS + 50 % FS 2.65
100 % FS 1.82
Mortar Mix Compressive Strength (N/mm
2
)
Mix
7 days 28 days 90 days
M31 10.46 17.35 18.19 C:S
M32 15.82 17.98 19.41 C:S
M33 10.73 21.15 23.95 C:S
M34 20.81 28.67 34.86 C:S
M35 15.51 25.48 27.72 C:S
[image:4.612.33.579.227.326.2] [image:4.612.34.579.387.484.2] [image:4.612.33.580.582.703.2]In mortar mix M34, maximum values obtained are 20.81, 28.67 and 34.86 N/mm2. Similarly Figure 1 shows the graded sand passing through 2.36 mm retained on 600 micron and passed through 600 micron. Figure 2 showing the Compressive strength test conducted in a concrete laboratory.
TABLE VII
AVERAGE WATER ABSORPTION FOR 30 AND 90 DAYS
Average water absorption (%) is more for M36 after 30 days. Maximum average absorption value for M32 after 90 days was found.
TABLE VIII
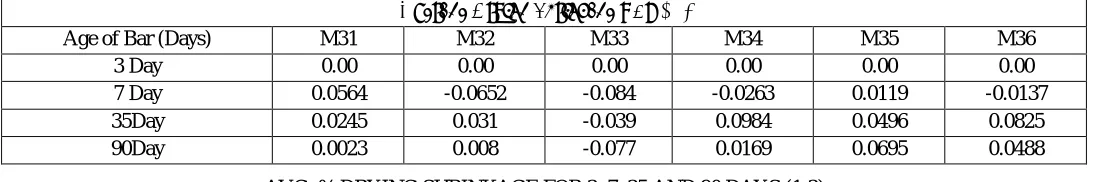
AVG. % DRYING SHRINKAGE FOR 3, 7, 35 AND 90 DAYS (1:3)
M31 shows the expansion or increase in the length for all three duration of testing. M33 shows the continuous reduction in the length at all ages. M32 shows initial shrinkage at 7 days and then expansion at 35 and days of moisture curing.
M35 is showing the expansion in length for 7, 35 and 90 days of curing and the values are 0.0119, 0.0496 and 0.0695 respectively. Initially mortar M34 shows shrinkage value -0.0263 but after 35 and 90 days it goes on increasing in length.
Mortar Mix Average Water Absorption (%)
30 Days 90 Days
M31 7.01 4.71
M32 5.52 6.06
M33 6.06 3.83
M34 6.42 4.53
M35 6.42 3.31
M36 8.11 3.73
Average Drying Shrinkage ΔLx (%)
Age of Bar (Days) M31 M32 M33 M34 M35 M36
3 Day 0.00 0.00 0.00 0.00 0.00 0.00
7 Day 0.0564 -0.0652 -0.084 -0.0263 0.0119 -0.0137
35Day 0.0245 0.031 -0.039 0.0984 0.0496 0.0825
90Day 0.0023 0.008 -0.077 0.0169 0.0695 0.0488
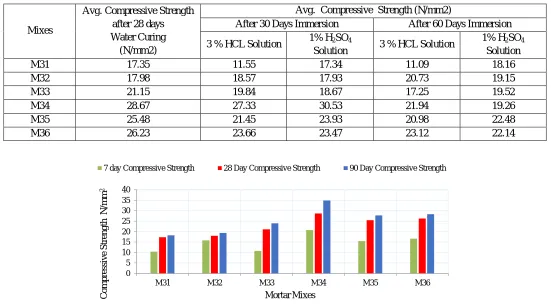
[image:5.612.34.581.507.598.2]TABLE IX
AVG. COMPRESSIVE STRENGTH AFTER 30 & 60 DAYS IN ACIDS (1:3)
Following are the some observations for compressive strength after 30 and 60 days of immersion in acids. After 30 days of
immersion in HCL strength of M31 reduced drastically from 17.35 to 11.55 N/mm2. After 60 days the strength gets increased for
M31 in H2SO4 solution. For M34 strength increases after 30 days of immersion from 28.67 to 30.53 N/mm2 in H2SO4 solution and
reduced after 60 days of immersion to 19.26 N/mm2.
0 5 10 15 20 25 30 35 40
M31 M32 M33 M34 M35 M36
C
o
m
pr
es
si
v
e
S
tr
eng
th
N
/m
m
2
Mortar Mixes
7 day Compressive Strength 28 Day Compressive Strength 90 Day Compressive Strength Mixes
Avg. Compressive Strength after 28 days
Water Curing (N/mm2)
Avg. Compressive Strength (N/mm2)
After 30 Days Immersion After 60 Days Immersion
3 % HCL Solution 1% H2SO4
Solution 3 % HCL Solution
1% H2SO4
Solution
M31 17.35 11.55 17.34 11.09 18.16
M32 17.98 18.57 17.93 20.73 19.15
M33 21.15 19.84 18.67 17.25 19.52
M34 28.67 27.33 30.53 21.94 19.26
M35 25.48 21.45 23.93 20.98 22.48
[image:6.612.92.525.74.290.2]M36 26.23 23.66 23.47 23.12 22.14
[image:6.612.31.582.411.717.2]Fig.6 Average % water absorption for 30 and 90 days (1:3)
Fig.7 Average drying shrinkage for M31, M32 and M33 (1:3) -0.100 -0.082 -0.064 -0.046 -0.028 -0.010 0.008 0.026 0.044 0.062 0.080
3 Day 7 Day 35Day 90Day
D ry in g S h ri n k a g e (% )
Age of Specimens (Days)
M31 M32 M33
0 1 2 3 4 5 6 7 8 9
M31 M32 M33 M34 M35 M36
% W a te rr A b so rp ti o n Mortar Mixes
30 Day % WA 90 Days % WA
-0.060 -0.040 -0.020 0.000 0.020 0.040 0.060 0.080 0.100 0.120
3 Day 7 Day 35Day 90Day
D ry in g S h ri n k a g e (% )
Age of Specimens (Days)
Fig.9 Comp. Strength after 30 days of immersion in Acids (1:3)
Fig.10 Comp. Strength after 60 days of immersion in Acids (1:3)
V. CONCLUSIONS
Mortar mixes with sand gradation showed the variation in compressive strength for 1:3 cement sand mortar. M31 (100 % CS + 0 %
FS) have the least 7, 28 and 90 day strength as 10.46, 17.35 and 18.19N/mm2. M34 (60 % C + 40 % FS) showed maximum 28 day
strength 28.67 N/mm2. More water is absorbed after 30 days by M36 which is 8.11% and minimum water absorption was for M32.
After 90 days there is reduction in absorption capacity of all the mortar mixes. M31 showed the expansion or increase in the length for 7, 35 and 90 days curing.
M35 shows the expansion in length for 7, 35 and 90 days of curing and the values are 0.0119, 0.0496 and 0.0695 respectively. Initially mortar M34 showed shrinkage value -0.0263 but after 35 and 90 days it showed expansion. After 30 days of immersion in
HCL strength of M31 reduced drastically from 17.35 to 11.55N/mm2. After 60 days the strength gets increased for M31 in H2SO4
solution.
REFERENCES
[1] Chandra Prakash Bastani & R. Kansal, ”Effect of Fine Aggregate Particles on Compressive Strength of Cement Mortar,” International journal of engineering studies and technical approach, ISSN No. 2395-0900, Volume 01, No.7, July, 2015.
[2] E. Rivet and T. Ritchie, “The influence of sand grading on mortar properties.” National Research Council Canada Division of Building Research Internal 0 5 10 15 20 25 30 35
M31 M32 M33 M34 M35 M36
A v g . Co m p re ss iv e S tre n g th (N /m m 2) Mortar Mixes NORMAL 3% HCL
1 % H2SO4
0 5 10 15 20 25 30 35
M31 M32 M33 M34 M35 M36
A v g . Co m p re ss iv e S tre n g th (N /m m 2) Mortar Mixes NORMAL 3% HCL
[3] B.V. Venkatarama Reddy and Ajay Gupta. “Influence of sand grading on the characteristics of mortars and soil – cement block masonry.” Construction and Building Materials 22, 1614 – 1623, 2008.
[4] G. De Schutter and A.M. Poppe. “Quantification of the water demand of sand in mortar. Construction and Building Materials.”Volume 18, Issue 7, Pages 517-521, September 2004.
[5] M.A. Amjad, “Elasticity and Shrinkage of Cement: Sand Mortar Produced in Riyadh.”JKAU: Eng. Sci., vol. 11 No. 2, pp. 91-105 (1419 A.H. / 1999 A.D.) [6] R. Malathy and K. Subramanian.“Drying shrinkage of cementitious composites with mineral admixtures.” Indian Journal of Engineering & Sciences. Volume
14, April 2007, pp 146-150.
[7] J.A.Canova1, G.de Angelis Neto and R. Bergamasco. “Mortar with unserviceable tire residues.”Journal of Urban and Environmental Engineering, Volume03, N.2 (2009), Page No, 63–72 ISSN 1982-3932.
[8] Wenyan Zhang, Mohamed Zakaria, Yukio Hama. “Influence of Aggregate Materials Characteristics on the Drying Shrinkage Properties of Mortar and Concrete.” Journal of Construction and building materials volume49 page 500-510, 2012-13
[9] Se Jin Choi; Sang Soo Lee; and Paulo J. M. Monteiro, “Effect of Fly Ash Fineness on Temperature Rise, Setting, and Strength Development of Mortar”. Journal of ASCE.
[10] Narayanan Sambu Potty, Kalaikumar Vallyutham, “Properties of Rice Husk Ash (RHA and MIRAH) mortars.” Research Journal of Applied Sciences and Engineering and Technology. Volume 07, May 10, 2014.