0095-1137/09/$08.00⫹0 doi:10.1128/JCM.00164-09
Copyright © 2009, American Society for Microbiology. All Rights Reserved.
Evidence-Based Approach for Interpretation of Epstein-Barr Virus
Serological Patterns
䌤
J. S. Klutts,
1,2B. A. Ford,
3N. R. Perez,
3and A. M. Gronowski
3*
Department of Pathology, University of Iowa Carver College of Medicine, Iowa City, Iowa1; Pathology and Laboratory Medicine,
Veteran’s Affairs Medical Center, Iowa City, Iowa2; and Department of Pathology and Immunology, Division of Laboratory and
Genomic Medicine, Washington University School of Medicine, St. Louis, Missouri3
Received 26 January 2009/Returned for modification 22 May 2009/Accepted 29 July 2009
Diagnosis of Epstein-Barr virus (EBV) infection is based on clinical symptoms and serological markers, including the following: immunoglobulin G (IgG) and IgM antibodies to the viral capsid antigen (VCA), heterophile antibodies, and IgG antibodies to the EBV early antigen-diffuse (EA-D) and nuclear antigen (EBNA-1). The use of all five markers results in 32 possible serological patterns. As a result, interpretation of EBV serologies remains a challenge. The purpose of this study was to use a large population of patients to develop evidence-based tools for interpreting EBV results. This study utilized 1,846 serum specimens sent to the laboratory for physician-ordered EBV testing. Chart review was performed for more than 800 patients, and diagnoses were assigned based on physician-ordered testing, clinical presentation, and patient history. Testing for all five EBV antibodies was performed separately on all serum samples using the Bio-Rad BioPlex 2200 system. Presumed EBV diagnosis (based on previous publications) was compared to EBV diagnosis based on a medical record review for each serological pattern. Interestingly, of the 32 possible serological patterns, only
12 occurred in>10 patients. The remaining 20 patterns were uninterpretable because they occurred with such
infrequency. Two easy-to-use tables were created to interpret EBV serological patterns based on whether three (EBV VCA IgG, IgM, and heterophile) or five markers are utilized. The use of these two tables allows for interpretation of >95% of BioPlex serological results. This is the first evidence-based study of its kind for EBV serology.
Epstein Barr virus (EBV) is a gammaherpesvirus that causes a number of clinical syndromes, including acute mononucleosis and posttransplant lymphoproliferative disease, and has been linked to a number of malignancies (6). Most people have been exposed to EBV by early adulthood. After the initial infection, the virus becomes latent in B lymphocytes, and it can reactivate later in life to produce posttransplant lymphoproliferative dis-ease in immunocompromised transplant patients, central ner-vous system lymphoma in AIDS patients, or a more classic acute EBV-related viral illness in some patients infected with other viruses (6).
Acute infection with EBV can vary widely with regard to the severity and presentation of illness, ranging from an asymp-tomatic infection to a serious, life-threatening version of mononucleosis with associated liver damage and splenomegaly (6). Additionally, other acute viral syndromes, including those caused by hepatitis viruses and cytomegalovirus (CMV), can lead to similar clinical syndromes. The variety of symptoms and the overlap with other viral infections underscore the impor-tance of laboratory testing in the diagnosis of acute EBV-related disease. Serological markers for EBV infection have been and remain the most commonly used diagnostic tools for this purpose.
Assays using immunoglobulin G (IgG) and IgM antibodies
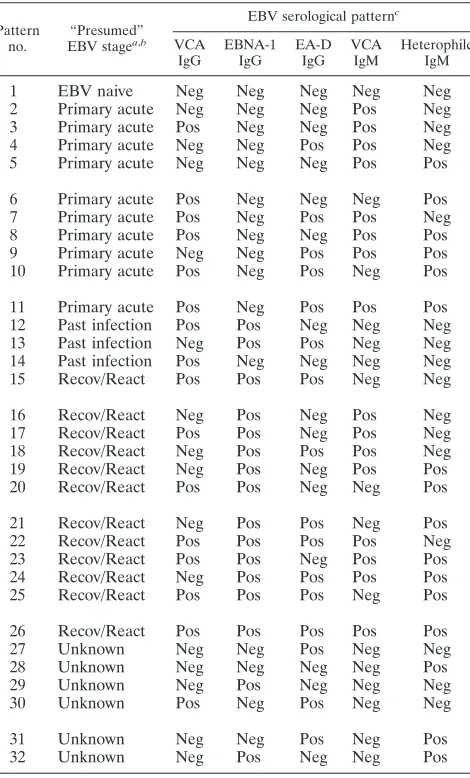
to the viral capsid antigen (VCA) and heterophile antibodies (IgM) are the most commonly performed EBV serological tests. IgG antibodies to EBV early antigen-diffuse (EA-D) and nuclear antigen (EBNA-1) can also be performed. If all five antibodies are measured, there are 32 possible serological pat-terns that could be generated (Table 1). The presumed diag-noses shown in Table 1 are derived from various sources (5, 6, 11). However, there is disagreement on the assignment of certain patterns. Thus, despite our experience with these diag-nostic tests, interpretation of EBV serological patterns remains a challenge (4).
Bio-Rad Laboratories (Hercules, CA) recently introduced a multiplex platform (BioPlex 2200) that can measure all five of these antibodies from one sample in two reaction vessels. We and others recently evaluated this platform with regard to its performance against various predicate assays and showed that it performed quite well (3, 7).
The purpose of this study was to use a large population of patients to develop evidence-based, easy-to-use tables for in-terpreting multiplexed EBV results. To our knowledge this study is the first of its kind.
MATERIALS AND METHODS
Patient samples and EBV testing.Two thousand sixty-four consecutive serum specimens sent to the Barnes-Jewish Hospital and St. Louis Children’s Hospital laboratories for physician-ordered EBV testing from 13 October 2004 to 28 December 2007 were utilized. The patient population represents both inpatients and outpatients and a large number of pre- and posttransplant patients, as well as specimens from tertiary physicians’ offices. Specimens were frozen for up to 30 months at⫺70°C, thawed, and analyzed immediately. Testing for all five anti-bodies was performed with the IgG (EBV VCA, EBV EA-D, and EBV NA) and
* Corresponding author. Mailing address: Department of Pathology and Immunology, Washington University School of Medicine, 660 S. Euclid, Box 8118, St. Louis, MO 63110. Phone: (314) 362-0194. Fax: (314) 362-1461. E-mail: [email protected].
䌤Published ahead of print on 5 August 2009.
3204
on May 16, 2020 by guest
http://jcm.asm.org/
IgM (EBV VCA and heterophile) assays on the BioPlex 2200 automated plat-form according to the manufacturer’s instructions. These assays have been FDA cleared, and cutoffs for positive, negative, and equivocal were established previ-ously by the manufacturer; these cutoffs were used in this study. Two hundred eighteen specimens were excluded. One hundred forty-five of 2,064 specimens were excluded due toⱖ1 equivocal BioPlex result (note: 5 of the 145 specimens had 2 equivalent results; therefore, 150 equivocals/10,320 total results⫽1.5% equivocal results observed). Forty-seven specimens were excluded due to an insufficient quantity of sample for testing. Twenty-six were excluded due to insufficient patient identification associated with the sample. Of the remaining 1,846 specimens in the study, the ages ranged from⬍1 year of age to⬎90 years of age, with approximately 45% of patients under the age of 20.
Physician-ordered EBV testing.EBV anti-VCA IgG, EBV anti-VCA IgM, and anti-EBNA-1 IgG assays were performed using the Captia assay (Trinity Biotech USA, Jamestown, NY) as described in the manufacturers’ package inserts on the Dynex DSX (Chantilly, VA) automated platform. The Status Mono (LifeSign LLC, Somerset, NJ) heterophile antibody assay was performed as described in the manufacturer’s package insert.
Chart review and classification of disease state.One physician, who was blinded to the BioPlex results, reviewed all medical records. Case summaries were recorded on standardized forms, and the information gathered included
physician-ordered EBV and CMV serologies, patient history, pertinent physical exam findings including fever, lymphadenopathy, pharyngitis, rash, malaise, or hepatosplenomegaly, results of manual and automated complete blood count, and results of any concurrent microbiological testing. Using all the clinical and laboratory data available, the physician reviewer assigned each patient to one of five possible EBV diagnoses (EBV naive, primary acute, past infection, recovery/ reactivation, or unknown).
Patients were determined to be EBV naive when they had negative VCA IgG, EA-D, and/or EBNA-1 results and either no IgM or heterophile antibody or no clinical suspicion of acute infection.
Primary acute infection was predominantly associated with the presence of fatigue, malaise, low-grade fever, cervical lymphadenopathy, pharyngeal symp-toms with or without a tonsillar exudate, a maculopapular or morbilliform rash, hepatosplenomegaly or elevation in liver enzymes, and elevation in mononuclear cells and atypical lymphocytes. The absence of another appropriate diagnosis and the presence of appropriate acute serologies (IgM and heterophile antibody) were considered but were not necessary for the diagnosis of acute EBV infection. Past infection patients were defined as those with any positive IgG serology to VCA or EBNA-1 without suspicion of acute infection.
Recovery was defined as positive acute serology or residual symptoms at greater than 2 weeks from onset. Reactivation was considered an occurrence of what appeared to be acute infection in a patient known to be seropositive for VCA IgG and/or EBNA-1 IgG.
The “unknown” category was reserved for patients who could not be assigned to one of the other categories and had conflicting clinical and serological pic-tures.
For the two most common serological patterns, corresponding to naive and past infection (patterns 1 and 12), the reviewer was given only 20% of patients’ medical records to review. Washington University School of Medicine Institu-tional review board approval was obtained prior to initiation of this study.
Statistics.Sensitivities, specificities, predictive values, odds ratios, andPvalues along with all 95% confidence intervals were calculated using Prism software (Prism Software Corporation, Irvine, CA).
RESULTS
BioPlex EBV testing was performed on 1,846 specimens. The prevalence of all 32 possible serological patterns is shown in Tables 2 and 3. Of the 32 possible serological patterns that could have resulted, 10 patterns did not occur in any of the 1,846 specimens and another 10 patterns occurred in⬍10 of the 1,846 specimens. Few conclusions can be drawn about the serological patterns that occur with such infrequency. For this reason, the data are split into patterns that were observed in
ⱖ10 patients (Table 2) and patterns that were observed in⬍10 patients (Table 3). Also shown for each BioPlex EBV serolog-ical pattern is the EBV diagnosis based on a medserolog-ical record review. A medical record review was performed for all patients with the exception of patients with patterns 1 and 12 in Table 2, where a representative 20% of patients were reviewed. In Table 2, the concordance between presumed EBV diagnosis and evidence-based EBV diagnosis is shown by the bolded numbers. Predictive values are also calculated and shown. No calculations were made on the data in Table 3, since it is difficult to draw conclusions with regard to the association of any of these patterns with EBV diagnosis with such small numbers of patients.
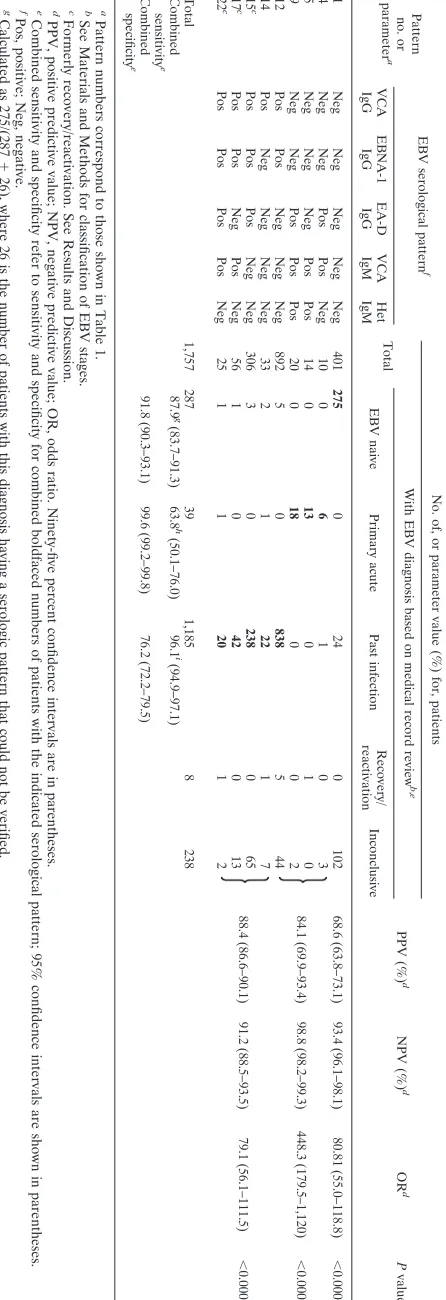
[image:2.585.46.281.89.478.2]The goal of this study was to develop evidence-based easy-to-use tables for interpreting multiple EBV results. To do this, all EBV patterns with predictive values of⬍50% were removed from Table 2 (patterns 2, 29, and 30). Table 4 shows the remaining nine serological patterns that had sufficiently high predictive values to consider them associated with a particular EBV diagnosis, along with calculated diagnostic parameters for each verified pattern. Of note, three patterns (15, 17, and 22) that were presumed to indicate recovery/reactivation were
TABLE 1. All possible serological patterns and presumed EBV diagnoses based on published reportsa
Pattern no.
“Presumed” EBV stagea,b
EBV serological patternc
VCA IgG
EBNA-1 IgG
EA-D IgG
VCA IgM
Heterophile IgM
1 EBV naive Neg Neg Neg Neg Neg
2 Primary acute Neg Neg Neg Pos Neg
3 Primary acute Pos Neg Neg Pos Neg
4 Primary acute Neg Neg Pos Pos Neg
5 Primary acute Neg Neg Neg Pos Pos
6 Primary acute Pos Neg Neg Neg Pos
7 Primary acute Pos Neg Pos Pos Neg
8 Primary acute Pos Neg Neg Pos Pos
9 Primary acute Neg Neg Pos Pos Pos
10 Primary acute Pos Neg Pos Neg Pos
11 Primary acute Pos Neg Pos Pos Pos 12 Past infection Pos Pos Neg Neg Neg 13 Past infection Neg Pos Pos Neg Neg 14 Past infection Pos Neg Neg Neg Neg
15 Recov/React Pos Pos Pos Neg Neg
16 Recov/React Neg Pos Neg Pos Neg
17 Recov/React Pos Pos Neg Pos Neg
18 Recov/React Neg Pos Pos Pos Neg
19 Recov/React Neg Pos Neg Pos Pos
20 Recov/React Pos Pos Neg Neg Pos
21 Recov/React Neg Pos Pos Neg Pos
22 Recov/React Pos Pos Pos Pos Neg
23 Recov/React Pos Pos Neg Pos Pos
24 Recov/React Neg Pos Pos Pos Pos
25 Recov/React Pos Pos Pos Neg Pos
26 Recov/React Pos Pos Pos Pos Pos
27 Unknown Neg Neg Pos Neg Neg
28 Unknown Neg Neg Neg Neg Pos
29 Unknown Neg Pos Neg Neg Neg
30 Unknown Pos Neg Pos Neg Neg
31 Unknown Neg Neg Pos Neg Pos
32 Unknown Neg Pos Neg Neg Pos
aSee references 5, 6, and 11.
bRecov/React, recovery/reactivation: those patients who are in a late acute
infection stage or have benign reactivation.
cPos, positive; Neg, negative.
on May 16, 2020 by guest
http://jcm.asm.org/
actually determined to indicate past infection based on the evidence-based diagnosis. Also, to properly calculate the sen-sitivity, the numbers for the serological patterns were adjusted in Table 4 to include those patients whose cases were not
[image:3.585.46.542.80.266.2]reviewed. For example, for pattern 12, the 710 patients whose data were not reviewed (see Table 2) were distributed into the five EBV diagnosis groups based on the relative frequencies of occurrence in the representative 182 patients with that pattern
TABLE 2. Serological patterns and EBV diagnosis for the 12/32 serological patterns that occurred inⱖ10 patientsa
Patternb
no.
“Presumed” EBV diagnosis
BioPlex 2200 resulth No. of patients
Predictivef
value (%) In
study
With EBV diagnosis based on medical record reviewc
Not reviewed VCA
IgG
EBNA-1 IgG
EA-D IgG
VCA IgM
Het IgM
EBV naive
Primary acute
Past infection
Recovery/
reactivation Inconclusive
1 EBV naive Neg Neg Neg Neg Neg 401 57 0 5 0 21 318d 68.7
2 Primary acute Neg Neg Neg Pos Neg 17 7 6 3 1 0 0 35.3
4 Primary acute Neg Neg Pos Pos Neg 10 0 4 1 0 2 3e 57.1
5 Primary acute Neg Neg Neg Pos Pos 14 0 13 0 1 0 0 92.9
9 Primary acute Neg Neg Pos Pos Pos 20 0 18 0 0 2 0 90.0
12 Past infection Pos Pos Neg Neg Neg 892 1 0 171 1 9 710d 94.0
14 Past infection Pos Neg Neg Neg Neg 33 2 1 22 1 7 0 66.7
15 Recov/React Pos Pos Pos Neg Neg 306 3 0 232 0 63 8e N/Cg
17 Recov/React Pos Pos Neg Pos Neg 56 1 0 42 0 13 0 N/C
22 Recov/React Pos Pos Pos Pos Neg 25 1 1 20 1 2 0 N/C
29 Unknown Neg Pos Neg Neg Neg 24 12 0 6 0 5 1e N/C
30 Unknown Pos Neg Pos Neg Neg 12 0 1 6 0 5 0 N/C
Total 1,810 84 44 508 5 129 1,040
aShown are the 12/32 possible serological patterns that occurred inⱖ10 patients. bPattern numbers correspond to those shown in Table 1.
cSee Materials and Methods for classification of EBV stage. Areas of expected concordance between the “presumed” and observed EBV stage are highlighted in bold. dTwenty percent of randomly selected patients were reviewed.
ePatients were not reviewed due to unavailability of the medical record.
fPredictive value was calculated by dividing the number of patients highlighted in bold by the total number of patients with completed chart review in that row. gN/C, not calculated. See Discussion.
hPos, positive; Neg, negative.
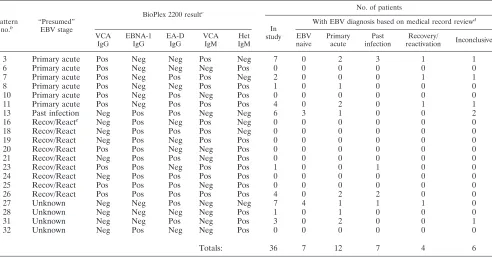
TABLE 3. Serological patterns and EBV diagnosis for the 20/32 serological patterns that occurred in⬍10 patientsa
Pattern no.b
“Presumed” EBV stage
BioPlex 2200 resultc No. of patients
In study
With EBV diagnosis based on medical record reviewd
VCA IgG
EBNA-1 IgG
EA-D IgG
VCA IgM
Het IgM
EBV naive
Primary acute
Past infection
Recovery/
reactivation Inconclusive
3 Primary acute Pos Neg Neg Pos Neg 7 0 2 3 1 1
6 Primary acute Pos Neg Neg Neg Pos 0 0 0 0 0 0
7 Primary acute Pos Neg Pos Pos Neg 2 0 0 0 1 1
8 Primary acute Pos Neg Neg Pos Pos 1 0 1 0 0 0
10 Primary acute Pos Neg Pos Neg Pos 0 0 0 0 0 0
11 Primary acute Pos Neg Pos Pos Pos 4 0 2 0 1 1
13 Past infection Neg Pos Pos Neg Neg 6 3 1 0 0 2
16 Recov/Reacte Neg Pos Neg Pos Neg 0 0 0 0 0 0
18 Recov/React Neg Pos Pos Pos Neg 0 0 0 0 0 0
19 Recov/React Neg Pos Neg Pos Pos 0 0 0 0 0 0
20 Recov/React Pos Pos Neg Neg Pos 0 0 0 0 0 0
21 Recov/React Neg Pos Pos Neg Pos 0 0 0 0 0 0
23 Recov/React Pos Pos Neg Pos Pos 1 0 0 1 0 0
24 Recov/React Neg Pos Pos Pos Pos 0 0 0 0 0 0
25 Recov/React Pos Pos Pos Neg Pos 0 0 0 0 0 0
26 Recov/React Pos Pos Pos Pos Pos 4 0 2 2 0 0
27 Unknown Neg Neg Pos Neg Neg 7 4 1 1 1 0
28 Unknown Neg Neg Neg Neg Pos 1 0 1 0 0 0
31 Unknown Neg Neg Pos Neg Pos 3 0 2 0 0 1
32 Unknown Neg Pos Neg Neg Pos 0 0 0 0 0 0
Totals: 36 7 12 7 4 6
a
Shown are the 20/32 possible serological patterns that occurred in⬍10 patients.
b
Pattern numbers correspond to those shown in Table 1.
c
Pos, positive; Neg, negative.
d
See Materials and Methods for classification of EBV stage.
e
Recov/React, recovery/reactivation: those patients who are in a late acute infection stage or have benign reactivation.
on May 16, 2020 by guest
http://jcm.asm.org/
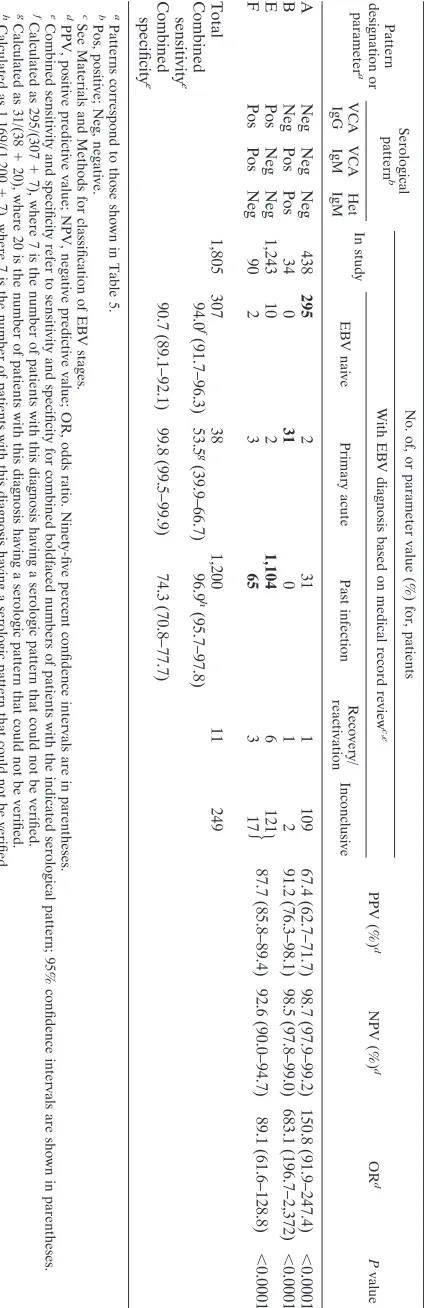
[image:3.585.48.540.427.684.2]TABLE 4. Evidence-based verification of nine EBV serological patterns for interpretation of multiplexed EBV serological results Pattern no. or parameter a EBV serological pattern f No. of, or parameter value (%) for, patients PPV (%) d NPV (%) d OR d P value Total With EBV diagnosis based on medical record review b , e VCA IgG EBNA-1 IgG EA-D IgG VCA IgM Het IgM EBV naive Primary acute Past infection Recovery/ reactivation Inconclusive 1 Neg Neg Neg Neg Neg 401 275 0 24 0 102 68.6 (63.8–73.1) 93.4 (96.1–98.1) 80.81 (55.0–118.8) ⬍ 0.0001 4 Neg Neg Pos Pos Neg 10 0 6 10 3 84.1 (69.9–93.4) 98.8 (98.2–99.3) 448.3 (179.5–1,120) ⬍ 0.0001 5 Neg Neg Neg Pos Pos 14 0 13 01 0 9 Neg Neg Pos Pos Pos 20 0 18 00 2 12 Pos Pos Neg Neg Neg 892 5 0 838 54 4 14 Pos Neg Neg Neg Neg 33 2 1 22 17 88.4 (86.6–90.1) 91.2 (88.5–93.5) 79.1 (56.1–111.5) ⬍ 0.0001 15 c Pos Pos Pos Neg Neg 306 3 0 238 06 5 17 c Pos Pos Neg Pos Neg 56 1 0 42 01 3 22 c Pos Pos Pos Pos Neg 25 1 1 20 12 Total 1,757 287 39 1,185 8 238 Combined sensitivity e 87.9 g (83.7–91.3) 63.8 h (50.1–76.0) 96.1 i (94.9–97.1) Combined specificity e 91.8 (90.3–93.1) 99.6 (99.2–99.8) 76.2 (72.2–79.5) a Pattern numbers correspond to those shown in Table 1. b See Materials and Methods for classification of EBV stages. c Formerly recovery/reactivation. See Results and Discussion. d PPV, positive predictive value; NPV, negative predictive value; OR, odds ratio. Ninety-five percent confidence intervals are in parentheses. e Combined sensitivity and specificity refer to sensitivity and specificity for combined boldfaced numbers of patients with the indicated serological pattern; 95% confidence intervals are shown in parentheses. f Pos, positive; Neg, negative. g Calculated as 275/(287 ⫹ 26), where 26 is the number of patients with this diagnosis having a serologic pattern that could not be verified. h Calculated as 37/(39 ⫹ 19), where 19 is the number of patients with this diagnosis having a serologic pattern that could not be verfied. i Calculated as 1,160/(1,185 ⫹ 22), where 22 is the number of patients with this diagnosis having a serologic pattern that could not be verified.
on May 16, 2020 by guest
http://jcm.asm.org/
[image:4.585.182.405.71.721.2]that were reviewed. Since 171/182 (94%) of patients were di-agnosed as “past infection,” 94% of the 710 nonreviewed pa-tients (667 papa-tients) were added to the “past infection” cate-gory for Table 4. The remaining 43 nonreviewed patients were distributed to the other various diagnostic categories in the same manner.
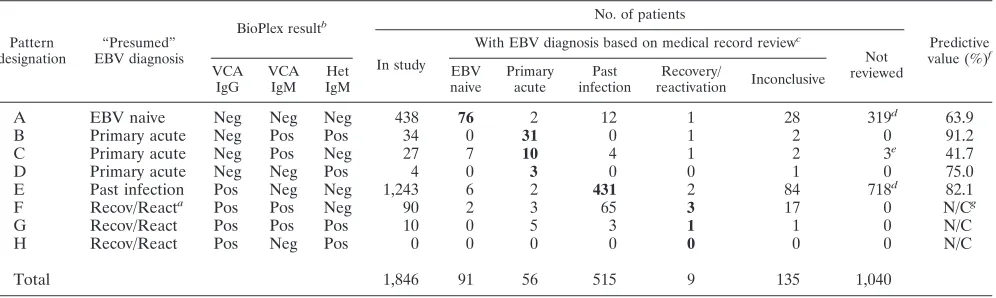
Because it is common practice for physicians to order only the VCA IgG and IgM and the heterophile antibodies to de-termine the EBV disease stage or serological status of patients, Table 5 illustrates the frequencies of those eight possible se-rological patterns in our patient population. The predictive values for patients correctly identified by serology were calcu-lated as they were in Table 2. The four of eight possible patterns with predictive values of⬎50% and sufficient num-bers of patients are shown in Table 6, along with calculations of combined predictive values and sensitivities. Similar to Table 4, patients whose records were not reviewed were included in Table 6 based on pattern frequencies for patients whose records were reviewed in Tables 2 and 3.
DISCUSSION
The diagnosis of EBV-related disease is based on clinical symptoms and laboratory testing. The importance of serolog-ical testing for EBV-related disease cannot be underestimated. However, the association between a particular EBV diagnosis and serological patterns is based largely on assumptions. While utilization of multiplex technology for the detection of EBV antibodies has been evaluated recently (1, 3, 7, 9, 12), this is the first evidence-based study of its kind aiming to match a large number of clinical diagnoses with EBV serological patterns. Here, we analyzed almost 1,850 specimens, generating
⬎10,000 individual serological test results, and reviewed the medical records of more than 800 patients.
Of the 1,846 specimens that were analyzed in this study, 98% (1,810/1,846) had one of only 12 different serological patterns (Table 2). The 20 remaining patterns (Table 3) were so
un-common that it is not possible to make a conclusion as to their association with a particular EBV diagnosis. Among the pat-terns that were not common (Table 3) were those that were VCA IgG positive along with other positive markers of a pri-mary acute infection (VCA IgM, EA-D IgG, and/or hetero-phile; pattern numbers 3, 6, 7, 8, 10, and 11). It has been classically assumed that VCA IgG would be positive in a large percentage of patients positive for VCA IgM and/or hetero-phile antibodies (5, 6), but this was not observed in this pop-ulation. A likely reason for this difference is that the BioPlex assay was developed with the expectation that the IgG and IgM kits would be used together. The VCA IgG assay detects an-tibodies to the EBV p18 antigen, which was previously shown to be a late marker of infection (2). Thus, the BioPlex VCA IgG assay is less likely to be positive for patients with early acute infections.
[image:5.585.45.543.90.239.2]Another observation based on the data in Table 2 is that the cases with patterns presumed to be recovery/reactivation (pat-terns 15, 17, and 22) were actually determined to be past infection by chart review. Records of many of these patients were subjected to unblinded rereview, and even with the knowledge of their entire EBV serological pattern, almost all were still considered to be in the past-infection stage. This would suggest that the vast majority of patients with these three patterns could be clinically considered to have past in-fection with no suggestion of a current EBV-related disease process. It is possible that many of these patients had benign reactivation of EBV. In patients that harbor latent EBV, the virus can reactivate. However, in immunocompetent patients, this reactivation typically does not progress to the lytic stage of viral replication and has little to no clinical consequence (10). Thus, during a chart review of the patient’s symptoms and other clinical data, there would be no evidence of an active process, but the patient would show evidence of past infection. Calculations of the predictive values shown in Tables 2 and 5 were not performed for these patterns, since these calculations
TABLE 5. Serological patterns and EBV diagnoses for the 1,846 study patients using only BioPlex VCA IgG, VCA IgM, and heterophile antibody assay results
Pattern designation
“Presumed” EBV diagnosis
BioPlex resultb No. of patients
Predictive value (%)f
In study
With EBV diagnosis based on medical record reviewc
Not reviewed VCA
IgG VCA
IgM Het IgM
EBV naive
Primary acute
Past infection
Recovery/
reactivation Inconclusive
A EBV naive Neg Neg Neg 438 76 2 12 1 28 319d 63.9
B Primary acute Neg Pos Pos 34 0 31 0 1 2 0 91.2
C Primary acute Neg Pos Neg 27 7 10 4 1 2 3e 41.7
D Primary acute Neg Neg Pos 4 0 3 0 0 1 0 75.0
E Past infection Pos Neg Neg 1,243 6 2 431 2 84 718d 82.1
F Recov/Reacta Pos Pos Neg 90 2 3 65
3 17 0 N/Cg
G Recov/React Pos Pos Pos 10 0 5 3 1 1 0 N/C
H Recov/React Pos Neg Pos 0 0 0 0 0 0 0 N/C
Total 1,846 91 56 515 9 135 1,040
a
Recov/React, recovery/reactivation: those patients who are in a late acute infection stage or have benign reactivation.
b
Pos, positive; Neg, negative.
c
See Materials and Methods for classification of EBV stage. Areas of expected concordance between “Presumed” and observed EBV stage are highlighted in bold.
d
Records of a percentage of randomly selected patients were reviewed (see Table 2).
e
Patients were not reviewed due to unavailability of the medical record.
f
Predictive value calculated by dividing the number of patients in the shaded box by the total number of patients with completed chart review in that row.
g
N/C, not calculated. See Results and Discussion.
on May 16, 2020 by guest
http://jcm.asm.org/
would assume that the presumed stage is the correct assign-ment for these patterns. For Table 4, patterns 15, 17, and 22 were included in the calculations of combined sensitivity and predictive value to predict past infection rather than recovery/ reactivation.
As we previously described, the heterophile assay on the BioPlex platform is different from standard latex agglutination heterophile assays in that it detects only IgM antibodies, has a numerical rather than visual cutoff, and utilizes purified horse red blood cell antigen rather than bovine antigen (8). In that report, we utilized a data set different from that presented here and showed that the BioPlex heterophile assay adds diagnostic value for both adults and children (8). It is evident from Tables 2 and 5 in the current study that the heterophile assay does indeed improve the predictive value for the diagnosis of acute infection. Comparing patterns 2 and 5 within Table 2, patterns 4 and 9 within Table 2, and patterns B and C within Table 5, the predictive value for diagnosing acute infection is signifi-cantly higher if the patient has a positive heterophile antibody. One additional reason for this finding is that we have shown previously that there are other causes for a false-positive VCA IgM result, especially acute infection with CMV orToxoplasma
(8). Thus, most of the patients that had pattern 2 in Table 2 likely had one of these conditions and did not have a primary acute EBV infection. However, a false-positive VCA IgM re-sult is much less likely in the setting of a concurrently positive heterophile assay.
The nine patterns represented in Table 4 are the most com-mon and have high enough associations with an EBV stage to be considered indicative of those respective stages. Interest-ingly, these patterns could be used to diagnose more than 95% of the patients in this study (1,757/1,846 patients) with good diagnostic accuracy. In our patient population, we had patients being evaluated for acute disease and for pretransplant sero-logical status. As a result, the diagnostic utility shown in Tables 4 and 6 may differ if the patient demographics are significantly different (e.g., mostly acutely ill pediatric patients and few pretransplant patients). This should be kept in mind when extrapolating our data to other centers.
IgG and IgM antibodies to VCA and heterophile antibodies are commonly the only three antibodies tested in clinical prac-tice for determination of EBV status or for diagnosing acute EBV-related disease. Shown in Table 5 are the eight possible serological patterns using only these three antibodies. Table 6 displays calculations using the most common patterns (similar to those shown in Table 4) and only these three antibodies. Comparing sensitivities and predictive values between Tables 4 and 6 suggests that using all five antibodies provides better sensitivity for diagnosing primary acute EBV infection, since only 53% of patients determined to have primary acute infec-tion were identified using the three analytes, compared to 64% when all five antibodies are utilized. One of the primary rea-sons for this is the higher predictive value seen when patients have both positive VCA IgM and EA-D IgG antibodies com-pared to only positive VCA IgM (see Table 2, patterns 2 and 4). In Table 5, pattern C contains both EA-D IgG-positive and -negative patients, and the predictive value for that pattern (41.7%) is not sufficient to consider it associated with primary acute disease. In contrast, pattern 4 in Table 2 did have
suffi-TABLE 6. Evidence-based verification of four EBV serological patterns for interpretation of VCA IgG, VCA IgM, and heterophile antibody assay results Pattern designation or parameter a Serological pattern b No. of, or parameter value (%) for, patients PPV (%) d NPV (%) d OR d P value In study With EBV diagnosis based on medical record review c , e VCA IgG VCA IgM Het IgM EBV naive Primary acute Past infection Recovery/ reactivation Inconclusive A Neg Neg Neg 438 295 2 31 1 109 67.4 (62.7–71.7) 98.7 (97.9–99.2) 150.8 (91.9–247.4) ⬍ 0.0001 B Neg Pos Pos 34 0 31 0 1 2 91.2 (76.3–98.1) 98.5 (97.8–99.0) 683.1 (196.7–2,372) ⬍ 0.0001 E Pos Neg Neg 1,243 10 2 1,104 6 121
其
87.7 (85.8–89.4) 92.6 (90.0–94.7) 89.1 (61.6–128.8) ⬍ 0.0001 F Pos Pos Neg 90 2 3 65 31 7 Total 1,805 307 38 1,200 11 249 Combined sensitivity e 94.0 f (91.7–96.3) 53.5 g (39.9–66.7) 96.9 h (95.7–97.8) Combined specificity e 90.7 (89.1–92.1) 99.8 (99.5–99.9) 74.3 (70.8–77.7) a Patterns correspond to those shown in Table 5. b Pos, positive; Neg, negative. c See Materials and Methods for classification of EBV stages. d PPV, positive predictive value; NPV, negative predictive value; OR, odds ratio. Ninety-five percent confidence intervals are in parentheses. e Combined sensitivity and specificity refer to sensitivity and specificity for combined boldfaced numbers of patients with the indicated serological pattern; 95% confidence intervals are shown in parentheses. f Calculated as 295/(307 ⫹ 7), where 7 is the number of patients with this diagnosis having a serologic pattern that could not be verified. g Calculated as 31/(38 ⫹ 20), where 20 is the number of patients with this diagnosis having a serologic pattern that could not be verified. h Calculated as 1,169/(1,200 ⫹ 7), where 7 is the number of patients with this diagnosis having a serologic pattern that could not be verified.
on May 16, 2020 by guest
http://jcm.asm.org/
[image:6.585.52.264.69.723.2]cient predictive value and was able to be included in the cal-culations of sensitivity in Table 4.
Predictive values when three antibodies were used to predict EBV diagnosis were similar to predictions made using all five analytes. One likely reason for this stems from the perfor-mance of the BioPlex VCA IgG assay, as discussed above. Since the BioPlex VCA IgG has a strong association with past infection and is thus unlikely to be positive in patients with early acute disease, it is therefore not as essential to perform the EBNA-1 IgG assay to verify that the patient is indeed in the past-infection stage. In addition, except for the relatively small number of patients with a primary acute EBV infection, EA-D IgG was of little utility. Concerning predictive values, it should be noted that these values are dependent on the prev-alence of EBV disease in the given population. At our institu-tion, we test pre- and posttransplant patients, thus lowering our overall prevalence of acute EBV disease. Centers should take this into account when applying these tables to their patient population and adjust for their prevalence.
It should be noted that, as described above, there are dif-ferences in the VCA-IgG and heterophile antibody assays on the BioPlex 2200 platform compared to other assays. This suggests that the interpretive patterns shown here are specific to use with BioPlex results. However, in this study and two previous studies (3, 7), there was very strong (92 to 97%) concordance between BioPlex 2200 and predicate assay results. Therefore, Tables 4 and 6 may also be useful for interpretation of EBV serologic results generated with other assays, but fur-ther studies obviously are needed to support that hypothesis.
Based on these data, we recommend an evidence-based ap-proach to the interpretation of BioPlex EBV serological pat-terns. We suggest the use of Table 4 to interpret the serological patterns when five serological tests are ordered, and because of the better sensitivity observed, we further recommend testing all five antibodies when trying to diagnose primary acute EBV disease. We also provide Table 6 to be used when only EBV VCA IgG, IgM, and heterophile antibodies are ordered and suggest that testing of only these three antibodies is sufficient
when trying to simply establish the EBV serologic status of a patient. We feel that only patterns that appear in these tables can be interpreted with confidence, since there are not enough data to support the interpretation of other serological patterns. We do not propose or recommend the isolated use of these tables in the diagnosis of EBV-related disease, but we suggest that this represents an evidence-based tool to be used in con-junction with other laboratory and clinical parameters for the classification of the EBV disease stage.
REFERENCES
1.Baetens, D. G., and L. M. Van Renterghem.2001. Coupled particle light scattering: a new technique for serodiagnosis of Epstein-Barr virus infection. J. Med. Virol.64:519–525.
2.Bauer, G.2001. Simplicity through complexity: immunoblot with recombi-nant antigens as the new gold standard in Epstein-Barr virus serology. Clin. Lab.47:223–230.
3.Binnicker, M. J., D. J. Jespersen, J. A. Harring, L. O. Rollins, and E. M. Beito.2008. Evaluation of a multiplex flow immunoassay for detection of Epstein-Barr virus-specific antibodies. Clin. Vaccine Immunol.15:1410– 1413.
4.Hess, R. D.2004. Routine Epstein-Barr virus diagnostics from the laboratory perspective: still challenging after 35 years. J. Clin. Microbiol.42:3381–3387. 5.Jensen, H. B.2006. Epstein-Barr virus, p. 637–647.InB. Detrick, R. G. Hamilton, and J. D. Folds (ed.), Manual of molecular and clinical laboratory immunology, 7th ed. ASM Press, Washington, DC.
6.Johannsen, E. C., R. T. Schooley, and K. M. Kaye.2005. Epstein-Barr virus (infectious mononucleosis), p. 1801–1820.InG. L. Mandell, J. E. Bennett, and R. Dolin (ed.), Principles and practice of infectious diseases, 6th ed., vol. 2. Elsevier, Philadelphia, PA.
7.Klutts, J. S., R. S. Liao, W. M. Dunne, Jr., and A. M. Gronowski.2004. Evaluation of a multiplexed bead assay for assessment of Epstein-Barr virus immunologic status. J. Clin. Microbiol.42:4996–5000.
8.Klutts, J. S., A. H. Wu, A. Smith, B. Yen-Lieberman, and A. M. Gronowski. 2008. Diagnostic performance of a new automated heterophile antibody test in adults and children. Diagn. Microbiol. Infect. Dis.61:351–353. 9.Martins, T. B., C. M. Litwin, and H. R. Hill.2008. Evaluation of a multiplex
fluorescent microsphere immunoassay for the determination of epstein-barr virus serologic status. Am. J. Clin. Pathol.129:34–41.
10.Rickinson, A. B., and E. Kieff.2007. Epstein-Barr virus, p. 2655–2700.In
D. M. Knipe, and P. M. Howley (ed.), Fields virology, 5th ed.. Lippincott-Raven, Philadelphia, PA.
11.Storch, G. A.2000. Diagnostic virology. Clin. Infect. Dis.31:739–751. 12.Zeytinoglu, A., I. Altuglu, E. Karatas, and R. Yazan Sertoz.2008.
Compar-ison of immunofluorescence assay and multiplexed microparticle-based im-munoassay for detecting Epstein-Barr virus viral capsid antigen antibodies. J. Virol. Methods148:300–302.