large B cell lymphoma cells provides a basis
for rational combinatorial therapy
Leandro C. Cerchietti, … , Gabriela Chiosis, Ari Melnick
J Clin Invest.
2010;
120(12)
:4569-4582.
https://doi.org/10.1172/JCI42869
.
B cell lymphoma 6 (
BCL6
), which encodes a transcriptional repressor, is a critical oncogene
in diffuse large B cell lymphomas (DLBCLs). Although a retro-inverted BCL6 peptide
inhibitor (RI-BPI) was recently shown to potently kill DLBCL cells, the underlying
mechanisms remain unclear. Here, we show that RI-BPI induces a particular gene
expression signature in human DLBCL cell lines that included genes associated with the
actions of histone deacetylase (HDAC) and Hsp90 inhibitors. BCL6 directly repressed the
expression of p300 lysine acetyltransferase (
EP300
) and its cofactor HLA-B–associated
transcript 3 (
BAT3
). RI-BPI induced expression of p300 and BAT3, resulting in acetylation of
p300 targets including p53 and Hsp90. Induction of p300 and BAT3 was required for the
antilymphoma effects of RI-BPI, since specific blockade of either protein rescued human
DLBCL cell lines from the BCL6 inhibitor. Consistent with this, combination of RI-BPI with
either an HDAC inhibitor (HDI) or an Hsp90 inhibitor potently suppressed or even
eradicated established human DLBCL xenografts in mice. Furthermore, HDAC and Hsp90
inhibitors independently enhanced RI-BPI killing of primary human DLBCL cells in vitro. We
also show that p300-inactivating mutations occur naturally in human DLBCL patients and
may confer resistance to BCL6 inhibitors. Thus, BCL6 repression of
EP300
provides a basis
for rational targeted combinatorial therapy for patients with DLBCL.
Research Article
Oncology
Find the latest version:
BCL6 repression of
EP300
in human diffuse
large B cell lymphoma cells provides a basis
for rational combinatorial therapy
Leandro C. Cerchietti,1,2 Katerina Hatzi,1,2 Eloisi Caldas-Lopes,3 Shao Ning Yang,1,2
Maria E. Figueroa,1,2 Ryan D. Morin,4 Martin Hirst,4 Lourdes Mendez,1
Rita Shaknovich,5 Philip A. Cole,6 Kapil Bhalla,7 Randy D. Gascoyne,8
Marco Marra,4 Gabriela Chiosis,3 and Ari Melnick1,2
1Hematology and Oncology Division, and 2Department of Pharmacology, Weill Cornell Medical College, New York, New York, USA. 3Department of Molecular Pharmacology and Chemistry, Sloan-Kettering Institute, New York, New York, USA. 4Genome Sciences Centre, British Columbia Cancer Agency, Vancouver, British Columbia, Canada. 5Department of Pathology, Weill Cornell Medical College, New York, New York, USA.
6Department of Pharmacology and Molecular Sciences, Johns Hopkins University School of Medicine, Baltimore, Maryland, USA. 7The University of Kansas Cancer Center, Kansas University Medical Center, Kansas City, Kansas, USA.
8Centre for Lymphoid Cancers and the Departments of Pathology and Experimental Therapeutics, British Columbia Cancer Agency, British Columbia Cancer Research Centre, Vancouver, British Columbia, Canada.
B cell lymphoma 6 (
BCL6
), which encodes a transcriptional repressor, is a critical oncogene in diffuse large
B cell lymphomas (DLBCLs). Although a retro-inverted BCL6 peptide inhibitor (RI-BPI) was recently shown
to potently kill DLBCL cells, the underlying mechanisms remain unclear. Here, we show that RI-BPI induces a
particular gene expression signature in human DLBCL cell lines that included genes associated with the actions
of histone deacetylase (HDAC) and Hsp90 inhibitors. BCL6 directly repressed the expression of p300 lysine
acetyltransferase (
EP300
) and its cofactor HLA-B–associated transcript 3 (
BAT3
). RI-BPI induced expression
of p300 and BAT3, resulting in acetylation of p300 targets including p53 and Hsp90. Induction of p300 and
BAT3 was required for the antilymphoma effects of RI-BPI, since specific blockade of either protein rescued
human DLBCL cell lines from the BCL6 inhibitor. Consistent with this, combination of RI-BPI with either
an HDAC inhibitor (HDI) or an Hsp90 inhibitor potently suppressed or even eradicated established human
DLBCL xenografts in mice. Furthermore, HDAC and Hsp90 inhibitors independently enhanced RI-BPI
kill-ing of primary human DLBCL cells in vitro. We also show that p300-inactivatkill-ing mutations occur naturally
in human DLBCL patients and may confer resistance to BCL6 inhibitors. Thus, BCL6 repression of
EP300
provides a basis for rational targeted combinatorial therapy for patients with DLBCL.
Introduction
Diffuse large B cell lymphomas (DLBCLs) are the most common form of non-Hodgkin lymphoma and generally present as an aggressive and rapidly progressive disease. Approximately 60% of DLBCLs can be cured by combining cytotoxic chemotherapy plus CD20 monoclonal antibody immunotherapy (1). Although these are relatively good outcomes, 40% of patients remain incurable. Even though the toxicities of chemoimmunotherapy are usually tolerable with proper medical management, it is desirable to move toward forms of molecular targeted therapy that, by modifying the criti-cal oncogenic pathways to which these tumors are addicted, could improve efficacy and reduce toxicity of antilymphoma regimens. Since lymphomas are typically highly complex from the molecular standpoint, it is unlikely that hitting a single target would be cura-tive. It is therefore relevant to explore mechanisms through which oncogenic pathways could be combinatorially targeted.
The most commonly involved oncogene in DLBCL is the B cell lymphoma 6 (BCL6) transcriptional repressor (2). Constitutive expression of BCL6 in DLBCL occurs in at least 70% of patients and is often driven by translocations to heterologous promoters or by point mutations in BCL6 promoter negative regulatory ele-ments (3–5). Constitutive expression of BCL6 in mice results in the
development of DLBCL similar to the human disease, suggesting that BCL6 is an initiating factor in lymphomagenesis (6). Deple-tion or blockade of BCL6 in human DLBCL cell lines or primary human DLBCL specimens causes cell death, indicating that these tumors are often addicted to this oncoprotein and require its con-tinuous function in order to maintain their survival (7, 8).
BCL6 is a member of the BTB/POZ–Zinc finger family of tran- scription factors and mediates transcriptional repression by recruit-ing corepressors to its various target genes. The N-terminal BTB domain of BCL6 forms an obligate homodimer, and the interface between BTB monomers forms a specific binding groove for the SMRT (NCOR2), NCOR (NCOR1), and BCOR corepressors (9). The activity of BCL6 can be disrupted by the administration to lympho-ma cells of peptides that compete with NCOR2, NCOR1, and BCOR for attachment to the BTB corepressor–binding groove (10). These BCL6 peptide inhibitors (BPI) reactivate BCL6 target genes and kill DLBCL cells. Recently, a synthetic D amino acid, retro-inverted BPI (RI-BPI), was shown to have favorable pharmacokinetic and toxicity profiles and potent efficacy against BCL6-dependent DLBCL cells both in vitro and in vivo (8). BCL6 inhibitors thus constitute a pow-erful form of targeted therapy for the treatment of DLBCLs.
BCL6 mediates its biological effects in lymphoma cells by repressing or modulating expression of its direct transcriptional targets. Genomic localization studies using ChIP-on-chip showed that BCL6 binds target genes involved in cellular functions such
Conflict of interest: The authors have declared that no conflict of interest exists.
as cell-cycle control, transcriptional regulation, apoptosis, pro- tein metabolism, and others (11). We predicted that such down-stream pathways could themselves be therapeutically targeted to provide enhanced antilymphoma activity in combination with
BCL6 inhibitors and thus provide a basis for rational combina-torial therapy for DLBCL. The large numbers of downstream target genes complicate the effort to select what might be the most functionally rel-evant pathways. Moreover, we wished to prioritize pathways for which there are drugs already approved for clinical use or in clinical trials. We hypoth-esized that connectivity mapping of the RI-BPI gene signature would identify classes of drugs more likely to synergize with it in killing lymphoma cells. Connectivity mapping is a bio- informatics method that scores simi-larities and differences between gene sets such as those induced by drugs in tumor cells (12). In addition, our goal was to explore the molecular mecha-nisms that link other drugs to BCL6 and their potential to serve as rational targeted therapy in combination with BCL6 inhibitors.
Results
The RI-BPI response signature suggests a potential functional relationship with histone deacetylase and Hsp90 inhibitors. We postulated that the cellular response to BCL6 blockade would include upregulation of target genes that contribute to the death of RI- BPI–treated lymphoma cells. We rea-soned that drugs that induce at least partially overlapping gene signatures with RI-BPI might further enhance BCL6 blockade by more extensively inducing related downstream antilym-phoma effects. We therefore exposed 5 BCL6-dependent (OCI-Ly7, OCI-Ly10, SU-DHL4, SU-DHL6, and Farage), and 4 BCL6-independent DLBCL cell lines (Karpas422, Toledo, Pfeiffer, and OCI-Ly4) (8, 13) to 10 μM RI-BPI versus a control peptide (CP) for 24 hours. The mRNA from these cells was submitted to gene expression microarray profil-ing. Across all BCL6-dependent DLBCL cells, 44 unique genes displayed a more than 1.8-fold increase and 8 showed a more than 1.8-fold decrease in relative transcript abundance when compared with BCL6-independent DLBCL cells (Supplemental Figure 1A; supplemen-tal material available online with this article; doi:10.1172/JCI42869DS1). The skewing toward gene activation by RI-BPI was expected, since BCL6 is a transcriptional repressor. The 52 gene “RI-BPI response signature” contained known BCL6 targets such as FOSB, CD55,
CD274, DUSP5 , etc. (11) (Supplemental Figure 1B). In order to iden-tify drugs with signatures related to RI-BPI and that might thus
Figure 1
functionally enhance its actions, we performed connectivity map-ping using a publicly available algorithm (12). Two classes of drugs were broadly enriched as inducing positively correlated gene signa-tures, and these were histone deacetylase (HDAC) inhibitors (HDI) including drugs such as suberoylanilide hydroxamic acid (SAHA), valproic acid (VPA), and trichostatin-A (TSA), and the Hsp90 inhibi-tors geldanamycin, 17-allylamino-17-demethoxy-geldanamycin (17-AAG), and radicicol (Supplemental Figure 2).
EP300 and its cofactor BAT3 are direct BCL6 targets that may link the actions of RI-BPI to those of HDI and Hsp90 inhibitors. We next explored possible mechanistic links among RI-BPI, HDIs, and Hsp90 inhibitors (Figure 1A). In previous ChIP-on-chip experiments, we identified p300 lysine acetyltransferase (EP300) (KAT3B), a lysine acetyl transferase, as well as its critical cofactor HLA-B–associated transcript 3 (BAT3 ) as putative BCL6 target genes (11), suggest-ing that BCL6 might suppress p300-mediated protein acetylation. BCL6 repression of EP300 might explain some of the links among the 3 classes of drug, since acetylation of Hps90 by p300 has been shown to disrupt Hsp90 chaperone functions, and likewise HDIs can also hyperacetylate and inhibit Hsp90 (14). In order to deter-mine whether BCL6 blockade could induce expression of EP300 and BAT3 , we exposed the 3 BCL6-dependent DLBCL cell lines SU-DHL6, Farage, and OCI-Ly7 to 10 μM RI-BPI or CP and measured their relative transcript abundance at 6 and 12 hours by quantita-tive PCR (QPCR) (Figure 1B). At 12 hours, RI-BPI induced a 2- to 3-fold induction of these genes, accompanied by a corresponding increase at 24 hours in their protein levels as shown by immu-noblotting and densitometry (Figure 1C). The binding of BCL6 to the promoters of EP300 and BAT3 observed by ChIP-on-chip
was confirmed by quantitative ChIP (QChIP) and coincided with the presence of DNA elements consistent with BCL6-binding sites (Figure 1D). In contrast, no BCL6 binding was observed further upstream to these sites.
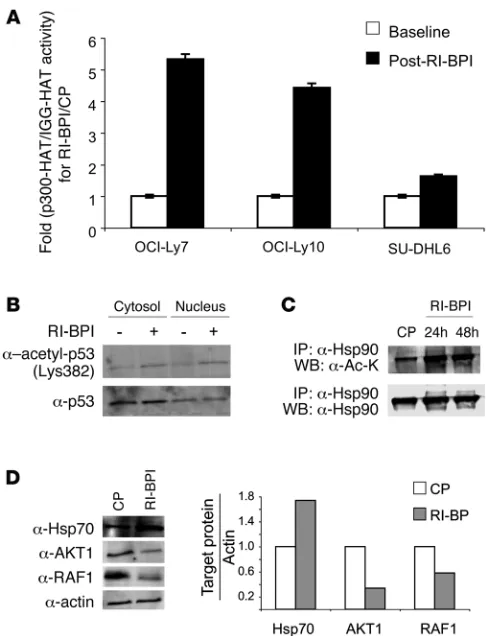
[image:4.585.42.285.80.398.2]RI-BPI induces p300 acetyltransferase activity and acetylation of p53 and Hsp90 . To determine the functional impact of RI-BPI induc-tion of EP300 and BAT3, the nuclear extracts of 3 DLBCL cell lines were exposed to 10 μM RI-BPI or CP for 24 hours and subjected to immunoprecipitation with p300 antibody or IgG control; pro- tein acetylation was measured using a histone lysine acetyltrans-ferase–activity (HAT-activity) assay. Consistent with its effect on expression of EP300 and BAT3, RI-BPI induced p300-specific HAT activity between 1.7- and 5.4-fold in the DLBCL cells (Fig- ure 2A). The increases in p300 abundance and lysine acetyltrans-ferase activity were accompanied by an increase in acetylation of the p53 tumor suppressor at lysine 382, as shown in experi-ments where the nuclear and cytosolic extracts of OCI-Ly7 cells were treated for 24 hours with RI-BPI or CP and immunoblotted with acetyl-p53K382 and p53 antibodies (Figure 2B). RI-BPI like-wise induced acetylation of Hsp90 as demonstrated by Hsp90 immunoprecipitations followed by immunoblot for acetyl-lysine or Hsp90 (Figure 2C). Hsp90 is acetylated by p300, and hyper-acetylation of Hsp90 by HDI or HDAC6 knockdown attenuates its chaperone activity and results in a compensatory increase in Hsp70 levels in cancer cells (15–19). Accordingly, 10 μM RI-BPI caused a reduction in the Hsp90 client proteins RAF1 and AKT1, and an increase in Hsp70 as shown by immunoblotting and densitometry in OCI-Ly7 DLBCL cells (Figure 2D). Treat-ment of DLBCL cells with the Hsp90 inhibitor PU-H71 (7) and
Figure 2
RI-BPI increases the lysine-acetyltransferase activity of p300. (A) p300-HAT activity was measured in OCI-Ly7, OCI-Ly10, and SU-DHL6 cells before (white bars) and after (black bars) treatment with BPI (10 μM) for 24 hours normalized to control-treated cells (CP). The HAT activity associated with p300 was determined by p300 immunoprecipitation versus IgG control followed by incubation of the immunoprecipitates with specific HAT substrates and cofactors. The resulting acetylated product was measured by spectrophotometry (OD440nm). Results
the HDI SAHA had similar effects on the levels of these 3 pro-teins (Supplemental Figure 3). The data provide a mechanistic link and suggest partially overlapping functions of RI-BPI, HDIs, and Hsp90 inhibitors.
EP300 reactivation is required for the antilymphoma activity of RI-BPI. The p300 inhibitors Lys-CoA and Lys-CoA-TAT have been shown to specifically block the KAT domain of p300 in vitro and in vivo (20–22). In order to determine whether p300 KAT activity contrib- utes to the therapeutic effect of RI-BPI, we exposed a panel of BCL6-dependent DLBCL cells to 5 μM Lys-CoA-TAT, 10 μM RI-BPI, or both for 48 hours and measured cell viability. In cells treated with either Lys-CoA-TAT or RI-BPI alone, the respective control was used in combination (CP for RI-BPI and tat-DDDD for Lys-CoA-TAT). The reduction of cell viability induced by RI-BPI was at least partially blocked by coadministration of p300 inhibitor in all cell lines (Figure 3A). In a confirmatory experiment, 2 dominant nega-tive forms of p300 lacking the KAT domain also rescued DLBCL cells from the loss of viability induced by RI-BPI (Supplemental Figure 4). The DLBCL cell line RC-K8 lacks p300-dependent KAT activity due to a mutation that generates a truncated protein (23) (Supplemental Figure 5). The transfection of full-length p300 in RC-K8 cells sensitized these cells to RI-BPI, as observed by a 30% reduction of the RI-BPI GI50, GI75, and GI90 compared with the parental cell line (Supplemental Figure 5). A similar effect was
found for the p300-truncated cell line Karpas422 (not shown). Induction of the p300 cofactor BAT3 was also important for the activity of RI-BPI. BAT3 could be depleted from several DLBCL cell lines after siRNA transduction (Supplemen-tal Figure 6). When transduced prior to RI-BPI treatment, BAT3 siRNA rescued DLBCL cells from loss of viability (Figure 3B). Collectively, the data indicate a criti-cal role for p300 downstream of BCL6 in DLBCL cells and suggest that coinduc-tion of BAT3 is required for this effect.
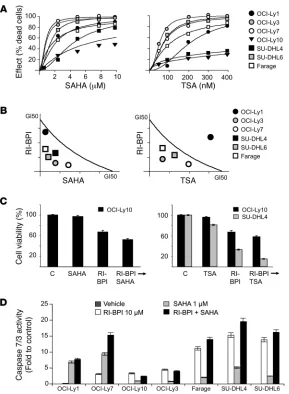
RI-BPI synergizes with HDAC inhibitors. We postulated that the common actions of RI-BPI and HDI in inducing p300-related protein acetylation, as well as their vari-ous other nonoverlapping effects, could translate to additive or even synergistic antilymphoma activity. In order to first determine drug GI50 concentrations, we exposed BCL6-dependent DLBCL cells to increasing concentrations of the HDI SAHA, TSA, and VPA (Figure 4A, Supple-mental Figure 7A, and SuppleSAHA, TSA, and VPA (Figure 4A, Supple-mental Table 1). Each of these inhibitors is based on a different chemical scaffold, and the use of all 3 allows drug class effects to be distinguished from molecule-specific idiosyncratic actions. The GI50 concen-trations of RI-BPI in these cell lines were previously reported (8). Combinatorial activity was determined by administering increasing doses of RI-BPI with each HDI and measuring cell viability at 48 hours. An isobologram analysis revealed potent synergy between RI-BPI and SAHA in 6 out of 7 cell lines and addi-tive effects in the seventh (OCI-Ly10). Synergy was observed in 4 out of 7 cell lines with TSA and additive effects in 2 cell lines (OCI-Ly10 and SUDHL4; Figure 4, B and C). RI-BPI synergized with VPA in 3 out of 7 cell lines and was additive in 3 cell lines (Supplemental Figure 7). To characterize the type of cell death induced by the com-bination of RI-BPI and SAHA, we also measured cell viability, direct cytotoxicity, and apoptosis induction. The number of viable cells (determined by measuring the activity of a live-cell protease) was inversely proportional to the number of dead cells (determined by measuring the activity of a dead-cell extracellular protease), consis-tent with results obtained with metabolic and dye-exclusion assays (not shown). We assessed apoptosis by measuring the activity of caspase 7/3. In most cases, the drugs alone and in combination induced the activity of caspase 7/3, suggesting that they mostly kill lymphoma cells through apoptosis (Figure 4D).
[image:5.585.43.376.81.326.2]In order to determine the impact of the combination of RI-BPI and SAHA on p300 activity, we performed additional HAT assays and observed that the combination increased the p300 activity to a greater extent than each drug alone (Supplemental Figure 8). This effect translates in higher acetylation of histone 3 and lower abun- dance of RAF1 with the combination, as shown by immunoblot- ting and densitometry (Supplemental Figure 9). AKT1 protein lev-els were also further reduced by the combination versus either drug
Figure 3
alone although less markedly than RAF1 (not shown). As for RI-BPI, p300 was shown to be important for the response of most DLBCL cell lines to SAHA since Lys-CoA-TAT at least partially rescued cells from being killed by the HDI (Supplemental Figure 10). Finally, transfection of wild-type p300 in the RC-K8 (EP300 mutant) DLBCL cell line increased the responsiveness of these cells to SAHA, demon-strated by a reduction in GI50, GI75, and GI90 of SAHA from 36% to 45% compared with the parental cell line (Supplemental Figure 5). Taken together, these results suggest that p300 is an important con-tributor to the therapeutic efficacy of the drugs in combination.
RI-BPI synergizes with Hsp90 inhibitors. Since Hsp90 inhibitors and RI-BPI attenuate Hsp90 chaperone activity through different mecha-nisms, we predicted that these 2 classes of drugs would exhibit more potent antilymphoma activity in combination. Moreover, in previous work, we showed that BCL6 is an Hsp90 client protein, suggesting an additional mechanism through which these drugs might interact (7). Dose-response experiments were performed with 2 different classes of Hsp90 inhibitors: 17-dimethylaminoethylamino-17-demethoxy- geldanamycin (17-DMAG), a more potent derivative of geldanamy-cin; and PU-H71, which is a purine scaffold Hsp90 inhibitor with favorable pharmacologic properties (24). Dose-response experiments confirmed that these drugs potently suppress BCL6-dependent
DLBCL cells (Figure 5A). Potent synergy was observed in combina-tion experiments where RI-BPI and either of the 2 Hsp90 inhibitors were administered at increasing concentrations up to their respec-tive GI50 concentrations (Figure 5B). For most of the cells, each drug alone and in combination induced caspase 7/3 activity, suggesting apoptotic cell death (Figure 5C). The combinatorial effect of RI-BPI and PU-H71 in suppressing Hsp90 activity was further illustrated by the fact that the 2 drugs together more potently suppressed RAF1 protein levels, as shown by immunoblotting and densitometry. RI-BPI reduced RAF1 to 90% of control-treated cell levels, PU-H71 reduced RAF1 to 60%, and the combination to 30% (Supplemental Figure 9). Collectively, the data indicate that both HDAC and Hsp90 inhibitors synergize with RI-BPI and could thus form the basis for rational combinatorial molecular-targeted therapy for DLBCL. The molecular basis of synergy is likely related to BCL6 regulation of
EP300, but may also involve other actions of these drugs.
[image:6.585.43.332.79.473.2]HDI and Hsp90 inhibitors can potentiate the actions of RI-BPI in vivo. In order to determine the impact of RI-BPI combinatorial therapy in a preclinical model, we compared and contrasted the action of RI-BPI, SAHA, and PU-H71 alone or in combination in mice bear-ing human lymphoma xenografts. Two BCL6-dependent DLBCL cell lines (Farage and OCI-Ly7) were used to establish xenografts in
Figure 4
RI-BPI synergizes with HDAC inhibitors. (A) 7 BCL6-depen-dent DLBCL cell lines were exposed to 6 concentrations of SAHA (from 0.5 to 10 μM), TSA (from 25 to 400 nM), or vehicle control (DMSO, 0.1% in water) for 48 hours and analyzed for viability. Dose-effect (percentage of dead cells) curves were plotted. Data points represent experi-mental data for a particular dose effect. The curves were derived using these data points and the Compusyn soft-ware. (B) The same cells were treated with 6 concentra-tions of SAHA or TSA and the combination of these drugs with 6 concentrations of RI-BPI at a constant ratio (con-current administration). Conservative GI50 isobolograms
for the combination of SAHA or TSA with BPI for each drug were plotted. Data points falling on the line indicate an additive effect, points below the line indicate synergy, and points above the line indicate infra-additive effect. The dose values for each GI50 for each cell line are shown
in Supplemental Table 1. (C) For the cell lines that were resistant (i.e., the GI50 was higher than the upper dose
limit) to 1 or more drugs, a potentiation effect with BPI was calculated. Cells were treated with BPI (10 μM) or SAHA (1 μM) or TSA (100 nM) or the combination of these for 48 hours (sequential schedule BPI→drug). Cell viability was determined and compared with control-treated cells. (D) The 7 DLBCL cell lines were exposed to RI-BPI (10 μM) (white bars), SAHA (1 μM) (light gray bars), RI-BPI plus SAHA (black bars), or vehicle control (dark gray bars, not visible) for 48 hours and analyzed for caspase 7/3 activity.
SCID mice. For each cell line, cohorts of 5 mice were treated with DMSO (SAHA vehicle), water (PU-H71 and RI-BPI vehicle), SAHA (20 mg/kg/d), PU-H71 75 (mg/kg/d), RI-BPI (25 mg/kg/d), SAHA plus RI-BPI, or PUH71 plus RI-BPI. Dosing of these compounds was chosen based on previous reports of antitumoral effect with mild or no toxicity (7, 8, 25, 26). Treatment was initiated when tumors reached approximately 100 mm3. The experiments are shown in 2 figures, 1 for SAHA (Figure 6) and 1 for PU-H71 (Figure 7). Since the vehicle-treated controls all displayed similar growth kinetics, all 10 of these animals were considered as a group. Tumor burden was evaluated by measuring xenograft volume, weight, and serum human β2-microglobulin. SAHA suppressed tumor volume and weight compared with controls (t test: P = 0.0026 and
P = 0.018 in Farage, and P = 0.02 and P = 0.005 in OCI-Ly7 xeno-grafts, respectively), as did RI-BPI (P = 0.0002 and P = 0.0005 in Farage, and P = 0.015 and P = 0.002 in OCI-Ly7 xenograft, respec-tively; Figure 6, A and B). The combination of RI-BPI and SAHA more potently suppressed xenografted tumors (P = 0.0001 volume,
P < 0.0001 weight, and P = 0.03, β2-microglobulin in Farage, and
P < 0.0001 volume, P < 0.001 weight and P = 0.0001, β 2-micro-globulin in OCI-Ly7 xenografts, respectively). Histochemistry of the tumors also showed a greater abundance of tumor cell death in the SAHA plus RI-BPI–treated cells compared with controls or each drug alone (Figure 6C). The apoptotic index (%) of SAHA-treated tumors was 18 ± 2.7 and 17.8 ± 3.6, RI-BPI was 18.2 ± 2.6 and 14.4 ± 2.3, and the combined treatment was 27 ± 3 and 33.2 ± 4 for OCI-Ly7 and Farage tumors, respectively (Figure 6C).
A previous report showed that PU-H71 suppressed DLBCL xeno- grafts as a single agent (7). Accordingly, in an independent experi-ment, we observed that PU-H71 could again potently suppress both Farage and OCI-Ly7 xenografts (volume: P = 0.0002 and P = 0.001, weight: P = 0.002 and P < 0.0005, β2-microglobulin: P = 0.01 and
P = 0.0001, respectively) (Figure 7, A and B). The combination of RI-BPI plus PU-H71 was remarkably potent. Suppression of tumor xenografts as compared with controls was P < 0.0001 for volume and weight as well as β2-microglobulin for both cell line xenografts. Remarkably, 50% of the animals treated with the 2 drugs had no evidence of tumor when their matched controls were sacrificed. This antitumor effect was also readily apparent upon histochemical analy-sis of the available xenografts (i.e., not including those mice in which tumors completely disappeared). The apoptotic index (%) of PU-H71–treated tumors was 16.2 ± 2.8 and 18 ± 4.3, RI-BPI was 18.8 ± 3.5 and 13.8 ± 2.4, and the combined treatment was 37.2 ± 3.2 and 36.6 ± 3.7 for OCI-Ly7 and Farage tumors, respectively (Figure 7C).
The favorable toxicity profiles of both RI-BPI and PU-H71 were previously published (7, 8), and SAHA is well characterized and in clinical use. The combination of RI-BPI plus SAHA or PU-H71 did not induce unexpected toxicities. Consistent with previous reports, the PU-H71– and RI-BPI–treated mice showed no evidence of toxicity based on macroscopic criteria such as body weight, pos-ture, etc. as well as microscopic examination of the various tissues upon necropsy. By the same criteria, no toxicity was detected in animals treated with the drug combination (body weight is shown in Supplemental Figure 11). In the case of SAHA, there was some evidence of mild intestinal mucositis and a decrease in the intake in both the single and combined treatment animals. The body weight was not significantly affected during the treatment course (Supplemental Figure 11). The addition of RI-BPI did not increase the incidence or severity of any side effect. RI-BPI–based combi-natorial therapy therefore has a potent antilymphoma effect and favorable toxicity profile in the preclinical setting.
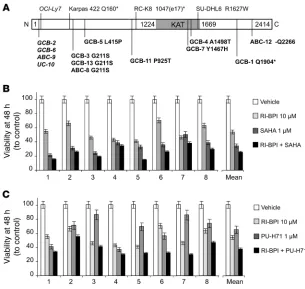
[image:7.585.42.332.82.371.2]P300 function is reduced in primary DLBCL due to both transcriptional and genetic mechanisms. In order to confirm the relevance of EP300 as a critical target gene in DLBCL, we next examined its genetic and
Figure 5
RI-BPI synergizes with Hsp90 inhibitors. (A) 7 BCL6-dependent DLBCL cell lines (Ly7, SU-DHL6, OCI-Ly1, Farage, OCI-Ly3, SU-DHL4, and OCI-Ly10) were exposed to 6 concentrations of PU-H71 (from 0.5 to 5 μM), 17-DMAG (from 0.5 to 5 μM), or vehicle control (water or DMSO, respectively) for 48 hours and analyzed for viabil-ity. Dose-effect (percentage of dead cells) curves were plotted. The x axis shows the dose of the Hsp90 inhibitor. The y axis shows the fractional effect of the drug as com-pared with control on cell viability. The experiment was done in 4 replicates. The goodness of fit for the experi-mental data to the median-effect equation (linear correla-tion coefficient) obtained from the logarithmic form of this equation was equal or higher than 0.90 for each curve. (B) The same panel of cells was treated with 6 concen-trations of PU-H71 or 17-DMAG and the combination of these drugs with 6 concentrations of RI-BPI at a constant ratio. Conservative GI50 isobolograms for the combination
of PU-H71 or 17-DMAG with RI-BPI for each drug were plotted. The dose values for each GI50 for each cell line
transcriptional status in primary DLBCL cases. Immunohistochemistry was performed to determine the abundance of BCL6, p300, and BAT3 in 56 DLBCL cases. The data revealed an inverse association between BCL6 and p300 or BAT3 protein abundance (P < 0.001 and
P < 0.00001, respectively) (Supplemental Figure 12), suggesting that the pathway is functional in DLBCL. Considering that p300 KAT activity appears to have a tumor suppressor effect in DLBCL and is mutated in RC-K8 cells, we next explored the genetic integrity of the
EP300 locus in 10 DLBCL cell lines and 93 DLBCL germline–matched patient samples. A total of 16 mutations affecting EP300 were detected, 3 of them in cell lines and 13 in patient samples. Synonymous muta- tions were detected in 1 cell line (OCI-Ly7) and 4 patients. Nonsyn-onymous candidate mutations predicted to alter p300 protein were found in 2 DLBCL cell lines (Karpas422 and SU-DHL6) and 9 of 93 (9.7%) primary DLBCL samples (Figure 8A). Two of these mutations, one in the cell line Karpas422 and the second in a patient sample, are
expected to result in truncated p300 protein or lead to non–sense-mediated decay of the mRNA from the mutant allele. There is a single replacement that appears to be highly recurrent, as it represented 3 of the 13 mutations (G211S). Another mutation that appears likely to have an impact on the KAT function of p300 is Y1467H, which was observed in a single patient sample. Based on the solved structure of p300, the affected tyrosine is involved in hydrogen bonds with at least 3 separate atoms on the substrate Lys-CoA (20). Another muta-tion, the only deletion observed, removes 3 nucleotides, which retains the reading frame but would result in the loss of a glutamine (Figure 8A). These results are consistent with a tumor suppressor function for EP300 in DLBCL, which is either suppressed by BCL6-mediated transcriptional repression or by genetic mutations.
[image:8.585.45.386.75.538.2]HDAC and Hsp90 inhibitors enhance RI-BPI killing of primary human DLBCL cells. Although the combination of RI-BPI with HDAC and Hsp90 inhibitors exhibited potent activity against lymphoma cell
Figure 6
SAHA enhances RI-BPI antilymphoma effect in vivo. (A and B) Left panels: tumor growth plots in Farage (A) and OCI-Ly7 (B) xenografted mice treated with control (DMSO, 10% in saline, n = 10, black squares), RI-BPI (25 mg/kg/d) (n = 5, white squares), SAHA (20 mg/kg/d) (n = 5, gray squares), or the combination of RI-BPI and SAHA (n = 5, black circles) for 10 consecutive days. The y axis indi-cates tumor volume (in mm3) and the x
axis days of treatment. P values repre-sent the comparison of tumor volumes in treated to control mice at day 9 by t test. Right panels, top: Serum levels of human
lines, these long-term cultures may not necessarily reflect the status of primary DLBCL in human patients. We therefore obtained single- cell suspensions from lymph node biopsies of 8 confirmed BCL6- positive DLBCL patients. The CD19-positive DLBCL cells were iso-lated and cocultured with a feeder layer of HK dendritic cells in a dual chamber separated by a 0.4-μm porous membrane. CD19 cells were exposed to 1 μM of PU-H71, 1 μM of SAHA, 10 μM of BPI, a combination of the drugs, or vehicle in 4 replicates. After 48 hours of exposure, cell death and viability were determined. Most of the cases displayed greater than 25% loss of viability after exposure to a single drug. In all cases, combinatorial therapy was more potent than single drugs (Figure 8, B and C). Synergy could not be calculated in these experiments since there were insufficient cells to test multiple doses. Overall, these results are consistent with our cell line and xenograft studies and support the notion that RI-BPI–based combination ther-apies with HDI or Hsp90 inhibitors represent a promising approach for the targeted therapy of DLBCL.
Discussion
[image:9.585.42.384.79.531.2]BCL6 has emerged as a major therapeutic target in B cell lym-phomas. The safety and efficacy of the specific BCL6-targeted therapy drug RI-BPI in preclinical studies supports the use of this agent to anchor combinatorial targeted therapy. Rational design of such combinations requires knowledge of biochemi-cal and biological mechanisms through which BCL6 maintains lymphoma cell survival. We approached this challenge by first identifying a gene signature uniformly induced by RI-BPI across BCL6-dependent DLBCL cells regardless of their genetic back-ground. The goal of this experiment was to identify a core gene set rather than to comprehensively catalog every transcript that can be induced by RI-BPI. We reasoned that a robust core signa-ture would be most representative of the actions of RI-BPI and thus most suitable for connectivity mapping with other drug sig-natures contained within the C-map database. This procedure identified HDAC and Hsp90 inhibitors as displaying partially
Figure 7
PU-H71 enhances RI-BPI antilymphoma effects in vivo. (A and B) Left panels: tumor growth plots in Farage (A) and OCI-Ly7 (B) xenografted mice treated with control (water,
n = 10, black squares), RI-BPI (25 mg/kg/d) (n = 5, white squares), PU-H71 (75 mg/kg/d) (n = 5, gray squares), or a combination of RI-BPI and PU-H71 (n = 5, black circles) for 10 consecutive days. The y axis indi-cates tumor volume (in mm3) and the x axis
overlapping signatures with RI-BPI. Both of these classes of drugs are pleiotropic in their actions since they can alter the acetylation and stability of numerous protein substrates respectively.
HDAC inhibitors exhibit activity against several types of B cell lymphoma cell lines in vitro and in vivo (27), presumably due to acetylation of a diverse set of nuclear and cytoplasmatic pro-teins. One recent report showed that SAHA and other HDIs could upregulate up to 10% of all protein acetylation sites by at least a factor of 2 (18). The multiplicity of protein targets coupled with the molecular heterogeneity of DLBCL make it difficult to predict which actions of HDI will predominate in a given tumor’s genetic background. Accordingly, we have not been able to identify any single genetic or biological feature among DLBCL cell lines that correlates with resistance or sensitivity to HDI (data not shown).
Moreover, a phase II clinical trial with the HDAC inhibitor SAHA in relapsed DLBCL patients showed limited activity of this drug as single agent (28). In the setting of DLBCL, this class of drugs will most likely be useful in rational combination with other agents. Hsp90 is highly expressed in DLBCL (7, 8, 29) and often displays aberrant distribution with prominent nuclear localization in addition to its usual cytoplas-matic pattern (7). In addition to maintaining the stability of oncogenic signaling proteins such as RAF1 and AKT1 (30), Hsp90 has been shown to chaperone mutant oncogenes, including BCR-ABL in chronic myeloid leukemias (31–33) and NPM-ALK in anaplastic large-cell lymphomas (34). Hsp90-mediated stabilization of AKT has been implicated as contributing to the survival of DLBCL cells, and the Hsp90 inhibitor IPI-504 was shown to exhibit synergy with the AKT inhibitor LY24009 (35). Of particular signifi-cance to DLBCL pathogenesis, Hsp90 mediates the stabilization of BCL6 mRNA and protein (7). The importance of BCL6 as a substrate protein is underlined by the fact that a degradation-resis-tant BCL6 mutant partially rescued DLBCL cells from Hsp90 inhibitor–induced apoptosis (7). Moreover, BCL6-independent DLBCL cells are relatively less sensitive to these drugs (7).
[image:10.585.43.348.81.370.2]In seeking to determine the mechanistic basis for the connectivity among RI-BPI, HDIs, and Hsp90 inhibitors, we identified EP300 as a cru-cial BCL6 target gene. RI-BPI blockade of BCL6 induced EP300 mRNA and protein expres-sion as well as its KAT enzymatic activity. The importance of p300 KAT activity downstream of RI-BPI is underlined by the observations that (a) specific p300 KAT domain inhibitors or transfection of p300 dominant negative mutants (in which the KAT domain has been deleted) partially rescued the actions of RI-BPI; (b) BCL6 also directly represses BAT3, which is required for p300-mediated acetylation of tar-get proteins, and BAT3 depletion also rescued DLBCL cells from RI-BPI; and (c) somatic p300 mutations that affect the KAT domain were observed to occur naturally in DLBCL patients, consistent with a tumor-suppressor role for this protein. Since p300-mediated acetylation of Hsp90 attenuates its chaperone functions (14), it is reasonable to consider that BCL6 blockade could lead to reduction in Hsp90 activity. This effect would be conceptually similar to the observation that HDIs attenuate Hsp90 activity by promoting its acetylation, thus providing a functional link among these 3 classes of drugs (14). Accord-ingly, we observed that in DLBCL cells, both HDI and RI-BPI induce Hsp90 hyperacetylation and a reduction in its canoni-cal substrate proteins AKT1 and RAF1, as well as the expected compensatory increase in Hsp70 (36). The data suggest the exis-tence of a feedback loop between BCL6 and Hsp90, whereby BCL6 induces Hsp90 activity by suppressing its acetylation (via p300 repression) and Hsp90 sustains BCL6 activity by
Figure 8
EP300 genetic lesions and the impact of combinatorial therapy on primary DLBCL speci-mens. (A) Representation of the EP300 mutations found in DLBCL cell lines (n = 10) and patient samples (n = 93). The EP300 protein (N1 to C2414 terminus) is represented as a
white bar with the KAT domain (1224 to 1669) in gray. Synonymous mutations are itali-cized. For nonsynonymous mutations, the substituted amino acid is indicated. Truncated proteins are indicated with an asterisk. The data correspondent to the cell line RC-K8 is from the literature (23). Patient samples are categorized accordingly to their DLBCL subtype as ABC, GCB, and unclassifiable (UC). (B) CD19+ single-cell suspensions from
lymph node biopsies of 8 confirmed BCL6+ DLBCL specimens were cocultured with HK
dendritic cells in a dual chamber separated by a 0.4-μm porous membrane. CD19+ cells
were exposed to vehicle (white bars), 10 μM of RI-BPI (light gray bars), 1 μM of SAHA (dark gray bars), or the combination of RI-BPI and SAHA (black bars) for 48 hours. Cell viability (represented as percentage of control-treated cells) is shown on the y axis. Individual cases as well as the average for all the cases are shown on the x axis. The experiment was carried out in 4 replicates. (C) Similar experimental conditions as in B
maintaining its mRNA and protein levels. Blockade of either arm (by either RI-BPI or Hsp90 inhibitor) disrupts both BCL6 and Hsp90 functions and leads to killing of lymphoma cells.
RI-BPI induction of p300 likely delineates additional functional links with HDI. For example, p300 acetylation of p53 can increase its transcriptional and biological actions (37–40). While p53 is also a BCL6 target gene, it has been shown that not only mutant but also wild-type p53 can be expressed in DLBCL along with BCL6 (41, 42). Yet even though expressed, p53 function is attenuated in DLBCL cells. Along these lines, previous data indicate that RI-BPI can induce the functional activity of already expressed p53 in DLBCL cells, regardless of whether p53 was mutant or wild type (41). p53-activating peptides or small molecules according-ly enhanced the cell-killing activity of RI-BPI, while in contrast, dominant negative p53 or the p53 inhibitor pifithrin-α partially rescued DLBCL cells from RI-BPI (41). Connecting these data together suggests a scenario whereby RI-BPI induced, p300-medi- ated acetylation of p53 plays a crucial role in inducing p53 func-tion and mediating antilymphoma effects.
Our data point toward a role for p300 as a tumor suppressor. A recent study showed that EP300 is mutated in RC-K8 DLBCL cells, resulting in loss of its KAT domain (23). We now describe point mutations that disrupt the KAT domain of p300 in DLBCL patients as well as in several additional DLBCL cell lines. The functional impact of these mutations is highlighted by the fact that transfection of wild-type p300 in RC-K8 cells and Karpas422 DLBCL cells sensitizes these cells to RI-BPI and SAHA (but not PU-H71, which does not target protein acetylation). Loss of func-tion mutations of the KAT domain of p300 were also reported to induce increased proliferative potential in hematopoietic progeni-tor cells (43). Moreover, transfection of a dominant negative KAT mutant p300 attenuated the response of DLBCL cells to RI-BPI, similar to the effect of administering specific p300 inhibitor drugs. These results do not rule out the possibility that other proteins with KAT activity could also contribute to the effect of RI-BPI. In this regard, we found that RI-BPI could increase the mRNA lev-els of the CBP lysine acetyltransferase (CREB-binding protein), although to a lesser level than EP300 or BAT3 (data not shown). Notably, despite their similarities, p300 and CBP may regulate dif-ferent sets of genes and mediate different biological effects (44), such as those involved in the apoptotic response to DNA damage (39). Notably, in a similar fashion to EP300, several other BCL6 target genes with tumor suppressor activity are mutated or deleted in DLBCL including PRDM1 (45), TP53 (46), and CDKN2A (47). Although BCL6 represses these genes, genetic lesions would pre-sumably more profoundly and stably inactivate these loci and alter the physiology of malignant lymphoma cells.
From the translational perspective, we predicted that RI-BPI might synergize with HDI or Hsp90 inhibitors to kill lymphoma cells by more potently inducing protein acetylation and inhibiting Hsp90. Along these lines, we observed that the combination of RI-BPI with Hsp90 inhibitors or HDI leads to a greater reduction of Hsp90 client proteins than single drug treatment and that combi-nation of RI-BPI and HDI induces greater p300 KAT activity and histone acetylation than either agent alone. Dose-response experi-ments combining RI-BPI with chemically distinct HDI and Hsp90 inhibitors accordingly revealed synergy in a majority of DLBCL cell lines. While these data do not rule out that other nonover-lapping effects of these classes of drugs contribute to synergistic
antilymphoma activity, they do support the rationale for combi-natorial therapy. When tested in a preclinical model, these same combinations again yielded more potent suppression of lympho- mas in vivo than any of the drugs alone, including complete regres-sion of tumors in mice treated with the combination of RI-BPI and Hsp90 inhibitor. These data are potentially clinically relevant. Combinatorial therapy also displayed enhanced killing of puri-fied primary human DLBCL cells. One of the HDAC inhibitors used in this study, SAHA, is of clinical use. The PU-H71 Hsp90 inhibitor is promising from the clinical standpoint, since it has a wider therapeutic window than most other chemical scaffolds targeting Hsp90, making it possible to deliver a more potent anti-tumor effect with less toxicity (7, 48). The fact that these drugs do not have known overlapping toxicities and were accordingly non-toxic when administered as combinations in mice further merits their consideration for use in rationally designed combinatorial targeted therapy clinical trials for patients with DLBCLs.
Methods
Cell lines and drugs
The DLBCL cell lines OCI-Ly1, OCI-Ly4, OCI-Ly7, and OCI-Ly10 were grown in medium containing 90% Iscove’s and 10% FCS, and supple-mented with penicillin G/streptomycin; the DLBCL cell lines Pfeiffer, Toledo, OCI-Ly4, OCI-Ly3, Farage, SU-DHL6, and SU-DHL4 were grown in medium containing 90% RPMI and 10% FCS supplemented with peni-cillin G/streptomycin, l-glutamine, and HEPES. RC-K8 cells were grown
in medium containing 95% advanced RPMI and 5% FCS supplemented with penicillin G/streptomycin, l-glutamine, and HEPES. PU-H71 and
17-DMAG were synthesized in the laboratory of G. Chiosis. TSA and VPA were purchased from Sigma-Aldrich. SAHA was a gift from Athon Pharma Inc. PU-H71, 17-DMAG, TSA, SAHA, and VPA were added from a concentrated stock solution to the 10% serum-containing culture medium. The BCL6 peptide inhibitor RI-BPI corresponds to sequence S6.2 as previously published (8). Control and RI-BPI peptides were syn-thesized by Biosynthesis Inc. Lys-CoA-TAT and control (DDDD-TAT) were synthesized in the laboratory of P.A. Cole (22).
Growth inhibition determination
DLBCL cell lines were grown at respective concentrations sufficient to keep untreated cells in exponential growth over the 48-hour drug expo-sure time. Cell viability was measured using a fluorometric resazurin reduction method (CellTiter-Blue; Promega) and trypan blue dye exclu-sion. Fluorescence (560Ex/590Em) was determined using a Synergy4
microplate reader (BioTek). The number of viable cells was calculated by using the linear least-squares regression of the standard curve. Fluores-cence was determined for 6 replicates per treatment condition, and cell viability in drug-treated cells was normalized to their respective controls. Unless stated otherwise, the experiments were carried out in biological triplicate. For the drug combination experiments, 3 timing schedules were tested during the 48-hour exposure time. In the concurrent schedule, RI-BPI (and CP) was administered at time 0 together with the drugs (and controls). In the sequential schedule RI-BPI (and CP) was administered at time 0 followed by drugs (and controls) at 24 hours (BPI→drug) or drugs (and controls) were administered at time 0 followed by RI-BPI (and CP) at 24 hours (drug→BPI). The best schedule for most of the cell lines tested was selected to plot the isobolograms and potentiation graphs. The CompuSyn software package (Biosoft) was used to plot dose-effect curves, determine the drug concentration that inhibits the growth of cell lines by 50% compared with control (GI50
Cell death characterization
Cell viability, direct cytotoxicity, and apoptosis induction were determined in DLBCL cell lines exposed for 24 hours to 1 μM of PU-H71, 1 μM of SAHA, 10 μM of BPI, a combination of the drugs, or vehicle in triplicate. Cell viability was assessed by measuring the activity of a live-cell protease using a cell-permeable peptide substrate that is cleaved intracellularly to generate a fluorescent signal proportional to the number of living cells (ApoTox-Glo; Promega). Cell toxicity was determined by measuring the activity of a dead-cell extracellular protease (which is released from cells that have lost membrane integrity) using a cell-impermeable peptide sub- strate that is cleaved extracellularly to generate a fluorescent signal propor-tional to the number of dead cells (ApoTox-Glo; Promega). The number of apoptotic cells was determined by measuring the activity of the caspases 7 and 3 using a luminogenic substrate (Caspase-Glo 3/7; Promega) follow-ing the manufacturer’s instructions. Apoptosis induction was defined as a decrease in cell viability with a concomitant increase in both cytotoxicity and caspase 7 and 3 activity. In addition, the type of cell death was morpho-logically confirmed by microscopy after staining with ethidium bromide and acridine orange.
Primary lymphoma samples
Deidentified patient tissues were obtained in accordance with and approv-al from the Institutional Review Board (IRB) of the Weill Cornell Medical College. We obtained single-cell suspensions from lymph node biopsies by physical disruption of tissues followed by cell density gradient separa-tion (Fico/Lite LymphoH; Atlanta Biologicals). CD19 cells were positively selected from the mononuclear cell suspension using CD19 magnetic beads and an auto-MACS cell separator (Miltenyi Biotec). Cell number and viability were determined by a dye-exclusion method (EasyCount; Immunicon). Primary DLBCL cells were cultured in 96-well chambers featuring 2 compartments separated by a 0.4-μ m porous polyester mem-brane (Corning Inc.). The lower chamber contained HK dendritic cells to support the growth of DLBCL cells contained in the upper chamber. Cells were grown in advanced RPMI medium with 10% human serum supple-mented with antibiotics, l-glutamine, and HEPES for 48 hours. Primary cells were seeded in HK-conditioned medium for 2 hours followed by 2 hours of drug exposure and transferred to the coculture system for the remainder of the experiment. Cells were treated with 1 μM of PU-H71, 1
μM of SAHA, 10 μM of BPI, a combination of the drugs, or vehicle in 4 replicates. After 48 hours of exposure, viability was determined by using an ATP-based luminescent method (CellTiter-Glo; Promega) and dye-exclusion based method (Easycount; Immunicon).
Rescue experiments
Lys-CoA treatment rescue. DLBCL cell lines were treated with Lys-CoA-TAT or DDDD-TAT (as control) at 5 μM every 24 hours and (a) RI-BPI or CP at 10 μM once over the 48-hour drug exposure time or (b) SAHA at 1 μM or DMSO control once over the 48-hour drug exposure time. Cell viability was determined using a fluorometric resazurin reduction method (CellTiter-Blue; Promega), and trypan blue dye exclusion (8). Results are normalized to DDDD-TAT and expressed as percentage of rescue relative to Lys-CoA-TAT.
P300 dominant negative rescue. Two P300-Δ HAT dominant negative con-structs (P300-Δ1514-1922 and P300-Δ1472-1522) cloned in pcDNA3 or the empty pcDNA3 vector were electroporated in 107
OCI-Ly10 and SU-DHL6 cells using the cuvette-format Amaxa electroporator in T buffer (Program G16; Amaxa Biosystems). All the constructs were cotransfected with the GFP plasmid provided by the manufacturer (Amaxa) to determine transfection efficacy. After a brief incubation in antibiotic-free medium, cells were allowed to recover, viewed and counted under the microscope, and plated to a final concentration of 106 cells/ml in complete medium.
After 48 hours, the cells were exposed to 10 μ M RI-BPI or CP for an addi- tional 48-hour period. Cell viability was determined as above using resa-zurin reduction and trypan blue dye exclusion.
BAT3 siRNA rescue. Predesigned siRNA targeting BAT3 (ON-TARGETplus SMART pool L-005062-01-0005; Thermo) and control (a sequence with no significant similarity to any vertebrate gene; 12935-110 Lo GC Duplex 2; Invitrogen) were electroporated in OCI-Ly3, SU-DHL4, and SU-DHL6 cells using the 96-well format Amaxa electroporator with up to 2 μM of siRNA using the SF transfection buffer (Amaxa) or subjected to the procedure without siRNA (mock control). After a brief incubation in antibiotic-free medium, cells were allowed to recover and plated to a final concentration of 106 cells/ml in complete medium for 48 hours. An aliquot of cells were
taken at 0, 12, 24, 48, and 72 hours and subjected to Western blotting to detect BAT3 protein abundance. At 48 hours after the transfection (the nadir for BAT3 expression), the cells were treated with 10 μM RI-BPI or CP for 24 hours and analyzed for viability as above.
EP300 expression rescue. Full-length EP300 cloned in CMV-HA vector and empty CMV-HA vector was electroporated in RC-K8 and Karpas422 cells using the 96-well format Amaxa electroporator. After brief incubation in antibiotic-free medium, cells were allowed to recover and plated to a final concentration of 106 cells/ml in complete medium for 24 hours. An aliquot
of cells was taken at 0, 24, and 48 hours and subjected to HA tag immu- noblotting. At 24 hours after the transfection (the point where HA expres-sion reached its maximum), the cells were treated with 6 concentrations of RI-BPI, SAHA, and PU-H71 for 48 hours and analyzed for viability by a metabolic assay (CellTiter-blue; Promega). The GI50, GI75, and GI90 for the
cells transfected with EP300 and control plasmid were calculated using the Compusyn software.
Immunoblotting
Lysates from DLBCL cells were prepared using 50 mM Tris, pH 7.4, 150 mM NaCl, and 1% NP-40 lysis buffer. Lysates for nuclear fractions were obtained using a fractionation kit (Biovision) following the manufactur-er’s instructions. Protein concentrations were determined using the BCA kit (Pierce). Protein lysates (50 μ g) were resolved by SDS-PAGE, trans-ferred to nitrocellulose membrane, and probed with the indicated primary antibodies: mouse anti-Hsp90α/β (Assay Designs), goat anti-Hsp90α/β (Santa Cruz Biotechnology Inc.), mouse anti-Hsp70 (Assay Designs), mouse anti–acetylated-lysine (Cell Signaling), rabbit anti–acetylated-p53 (Lys382) (Cell Signaling), mouse anti-p300 (Millipore), rabbit anti-p300 (N-15; Santa Cruz Biotechnology Inc.), rabbit anti-p300 (C-20; Santa Cruz Biotechnology Inc.), rabbit anti-p53 (FL393) (Santa Cruz Biotechnology Inc.), mouse anti-p53 (Pab240) (Santa Cruz Biotechnology Inc.), rabbit anti-Akt (Millipore), rabbit anti-Raf1 (Santa Cruz Biotechnology Inc.), rabbit anti–BCL6 N3 (Santa Cruz Biotechnology Inc.), mouse anti–BCL6 D8 (Santa Cruz Biotechnology Inc.), rabbit anti-GAPDH (Santa Cruz Bio- technology Inc.), rabbit anti-actin (Santa Cruz Biotechnology Inc.), rab-bit anti–histone 3 (Abcam), and mouse anti-BAT3 (Novus). Membranes were then incubated with a peroxidase-conjugated correspondent second-ary antibody. Detection was performed using the ECL system (Vector) according to the manufacturer's instructions. Densitometry values were obtained by using ImageJ 1.40g software (NIH).
P300-HAT activity assay