EMG FEATURES REDUCTION USING FUZZY C-MEANS
CLUSTERING TECHNIQUE
1
M.H.JALI, 2N.I.E.JUSOH, 3M.N.M.NASIR, 4T.A.IZZUDDIN, 5M.F.BAHAROM
Faculty of Electrical Engineering, Universiti Teknikal Malaysia Melaka, Melaka, MALAYSIA
Email:[email protected],[email protected],[email protected],
4
[email protected] , [email protected]
ABSTRACT
This paper illustrates the electromyography (EMG) features reduction for classification by using Fuzzy C-Means Clustering (FCM) technique. There are two types of EMG study which are diagnosis EMG and kinesiological EMG. The diagnosis EMG is study about the characteristics of the motor unit action potential for duration and amplitude while for the kinesiological EMG is about the movement analysis of the muscle activity. This work will focus more on kinesionological EMG that used two types of electrode which are surface electrode and fine wire. The EMG signal is a measure of electrical current during the contraction of the muscle. EMG classification is not an easy task due to the signal contains a lot of uncertainties that leads to a high dimensional feature vector. The objective of this work is to extract the time domain features from the EMG signal and to perform the features reduction technique based on different pattern using FCM. In this work, five subjects that use right hand as dominant and without previous illness record are selected.The EMG signal is collected at the forearm muscle. Then, the subjects will be asked to perform 5 different patterns which are lateral, tripod, tip, power and extension..It is expected that FCM could perform EMG features reduction for classifying the upper limb muscle based on the different pattern perform.
Keywords: Electromyography, Fuzzy C-Means Clustering, forearm muscle, Classification,Pattern
1. INTRODUCTION
Research on EMG classification is essential in the field of medical research and human technology interaction. It required a strong foundation of the neuromuscular system, impact of the tools used during signal acquisition in order to collect meaningful data and signal processing technique. One of the commonly application related to this study is prosthetic device
Fuzzy logic has been applied to many fields in the control system. The idea of fuzzy logic is from Dr.LotfiZadeh of the University of California at Berkeley in the 1960s. Fuzzy logic is based on degree of truth whether 1 or 0. The EMG is commonly used in various fields to investigate the muscular activities. During the contraction of the muscle, it will produce the EMG signal and the electrical activities aredetected [3]. The control of prosthesis and other assistive equipment is one of the most
important applicationsof EMG signal
classification[2]. It will record the electrical activity from the skeletal muscle and evaluates the data [3]. According from the theory of Peter
Konrad [4], there have two types of electrode
which are surface (non-invasive) and
intramuscular (invasive) electrode to measure the EMG signal. The advantage when using the intramuscular (invasive) electrode is the signal from the muscle that is show more accurate. The active electrode it has built-in the amplifier and filter that will increase the noise while doing the experiment [6]. Then, for the passive electrode [7], there have no built-in the amplifier and filter but this electrode has the electrode gel. While, the surface of non-invasive electrode is the surface just only to apply on the skin and not inserted to the skin. Thus, the signal show less accuracy compared to the signal when using the invasive electrode.
[10]. The performance of signal classification in
time domain features are chosen compared to frequency domain and time- frequency domain because low noise environments and their lower computational complexity [8]. The time domain also has the disadvantages that are the data will assumed in stationary state for the non-stationary properties of the EMG signal that the raw EMG signal not in time domain of the featured of the extraction [9] [11].
The objective of this project is to reduce the bundle of features that have been extracted from the EMG signal using FCM technique. A highly accurate feature is very important to represent the uniqueness of each feature and to distinguish between each pattern. Based on this work, it contribute a new features reduction technique to select the most appropriate features to represent each of the patterns conducted by subjects. It will answer the questions regarding the problem to determine the suitable features to be used for pattern recognition. This result could be further used to implement in the prosthesis control design.
2. METHODS
This research starts with experimental setup; follow by the EMG data acquisition. Then, the time domain features is extracted from the signal. Next the EMG features is validate using ANOVA test to ensure the accuracy of further analysis. Subsequently the FCM is applied to the features in order to observe the data clustering. Finally, based on the data clustering the best features for each patterns are determined by considering the distance between the features data as well as the suitability of each pattern for this work. The process involved can be divided into several phase which are:-
A. Experimental setup
The subject comprises of male and female that have right hand as a dominant with average weight of 50kg to 60kg. The healthy conditions of the subjects are also important to ensure the signal is not disturbed by external factor. Besides, the preparation of the skin is crucial to reduce the skin impedance. Before pasting of the electrode, the skin must be clean and dry. Therefore, an alcohol swab is applied to the skin to clean the location of the electrode. For the sweaty skin types and hairy, the electric shaves is used to remove the hair. After
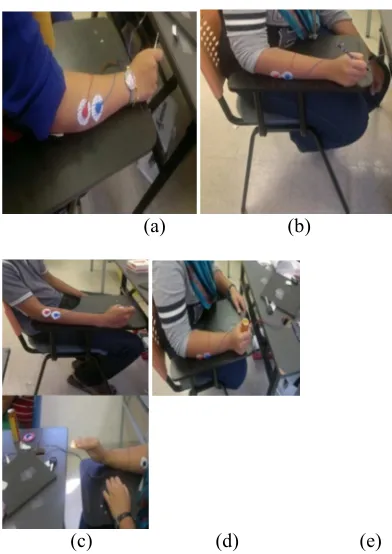
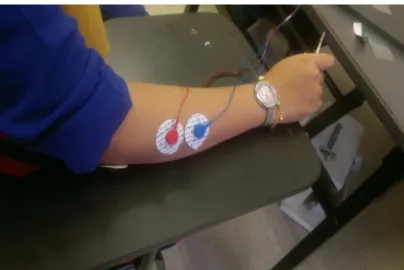
removing the skin hair, the surface was clean up with wet tissueuntil it dry.The experimental setup need to be standard during data acquisition to ensure consistency of the result. In this experiment, there were 5 subjects involved and each subject was asked to perform 5 types of pattern which are lateral, tripod, tip, power and extension as shown in Figure 1(a),(b),(c),(d) and (e). The data were collected from the subjects for 5 seconds. However, to avoid the difference in time, the stop watch was used to set the time during the experiment to the subject.The electrode was placed at forearm muscle due to limitation of number of channel used in Muscle V3 equipment. The electrode is the sensor that detects the raw EMG signal during the data acquisition. The reference electrode which is the ground electrode is place at the bone [13]. The other two electrodes is place 1cm distance from each other at forearm muscle as shown in Figure 2.
(a) (b)
[image:2.612.324.520.342.619.2](c) (d) (e)
Figure 1 : Pattern Movement For Each Subject, (A) Lateral, (B) Tripod, (C) Tip, (D) Power And (E)
Extension
B. EMG data acquisition
already amplified and filtered the raw EMG [image:3.612.92.294.218.353.2]
signal. Therefore, further signal conditioning is not required. NI myRIOis interfaced with the LabVIEW myRIO toolkit for data display and recorder as shown in Figure 3.The EMG signal variation during muscle contraction can be observed from the LabVIEW simulation.From the observation of the EMG signal in the form of size and shape of the wave, an appropriate data will be collected for further analysis.
[image:3.612.91.291.385.513.2]Figure 2: The Placement Of The Electrodes
[image:3.612.91.294.542.677.2]Figure 3: NI Myrio & Muscle V3
Figure 4: Labviewas Display And Data Recorder.
C. Time domain features extraction
This research focused on four types of time domain features which are Root Mean Square (RMS), Mean Absolute Value (MAV), Standard Deviation (STD) and Variance (VAR). The descriptions of each feature are as follow [12]:-
a. Mean absolute value (MAV) feature
isequivalent to average rectified value (ARV). It can be calculated using the moving average of fullwave rectified EMG. It is an easy way for detection of muscle contraction levels and it is a popular feature used in myoelectric control application. It is represent as:
MAV = ∑ | | (1)
b. Root mean square (RMS) is model as
amplitude modulated Gaussian random process which isrelated to the constant force and non-fatiguing contraction[12]. It can be define as:
RMS = ∑ (2)
c. Standard deviation features is
generallyrepresent the confidence
interval in statistical data of sEMG signal. A low standard deviation indicate that the data points tend to be very close to mean and vice versa if a high standard deviationvalue.It can be define as:
STD = ∑ (3)
d. Variance is the average of the squared
differences from the mean. It can be define as:
VAR = ∑ (4)
the validation of the features, ANOVA test is [image:4.612.102.308.211.354.2]
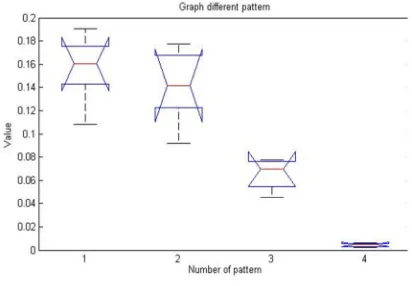
performed in Matlab. Based on the result, the p-value is 0.00152 which is less than 0.05 for 5 common features of EMG signal. Therefore, when the p-value is less than 0.05, the process can be consider success. Figure 5 shows the variation of each group of features when the p-value is 0.00152.Table 1 shows the features extraction data for each pattern.
Figure 5: Graph ANOVA When P-Value 0.00152
Table 1: The Features Extractiondata For Each Pattern.
Pattern RMS MAV STD VAR
Lateral 0.16-0.18 0.16-0.18 0.04-0.05 0.002-0.003
Tripod 0.10-0.12 0.08-0.10 0.05-0.06 0.003-0.004
Tip 0.14-0.16 0.10-0.12 0.00-0.01 0.006-0.007
Power 0.16-0.18 0.14-0.16 0.07-0.08 0.005-0.006
Extension 0.18-0.20 0.16-0.18 0.06-0.07 0.004-0.005
D. Fuzzy C-Means features reduction clustering technique
There are two types of the fuzzy logic system which is Mamdani and Sugeno. The best type of the fuzzy logic system is Mamdani types. It is because this type based on the human-like manner [11]. In this work, the fuzzy C- Means Clustering (FCM) is used. To identify the grouping from the large data is the objective of clustering to make the data briefly. FCM shows the clustering technique of the group data points into a specific number of data point in the dataset in a different clusters. When the data point that too close to the centre of the cluster it will have a high degree of membership function while the data point that is far away from the centre of the cluster will have a low membership function. Fuzzy Logic Toolbox command line function
fcm performs FCM clustering starts with an initial guess for the cluster centers, which are intended to mark the mean location of each cluster. The initial guess for these cluster centers is most likely incorrect. Then, fcm assigns every data point a membership grade for each cluster. By iteratively updating the cluster centers and the membership grades for each data point, fcm iteratively moves the cluster centers to the right location within a data set. This iteration is based on minimizing an objective function that represents the distance from any given data point to a cluster center weighted by that data point's membership grade. The information by fcm to help to create the fuzzy inference system by creating the membership functions to represent the fuzzy classification for each cluster [14].
For each iteration, FCM algorithm will maintain the centre vector of each cluster by calculating the weighted average of the data-points given by the degree of membership. It will
minimise the following objective functionJ :-
J=∑i=1N∑j=1Cδij∥xi−cj∥2(1)(5)
Where ∥xi−cj∥ is the norm that measures the
closeness of the data point xi to the centre vector
cj of cluster j, cj is the centre vector for cluster ,N
is the number of data points, C is the number of
clusters required and δij is the degree of
membership for the ith data point xi in cluster j.
3. RESULTS AND DISCUSSION
This section discusses the experimental results of the features reduction using FCM
algorithm. There are five different
pattern. Figure 7 to10 shows the plotting of each
feature values versus pattern.
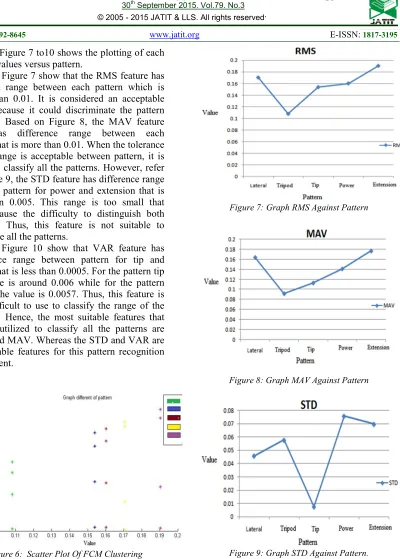
Figure 7 show that the RMS feature has different range between each pattern which is more than 0.01. It is considered an acceptable range because it could discriminate the pattern clearly. Based on Figure 8, the MAV feature also has difference range between each patternthat is more than 0.01. When the tolerance of the range is acceptable between pattern, it is easier to classify all the patterns. However, refer to Figure 9, the STD feature has difference range between pattern for power and extension that is less than 0.005. This range is too small that might cause the difficulty to distinguish both patterns. Thus, this feature is not suitable to recognise all the patterns.
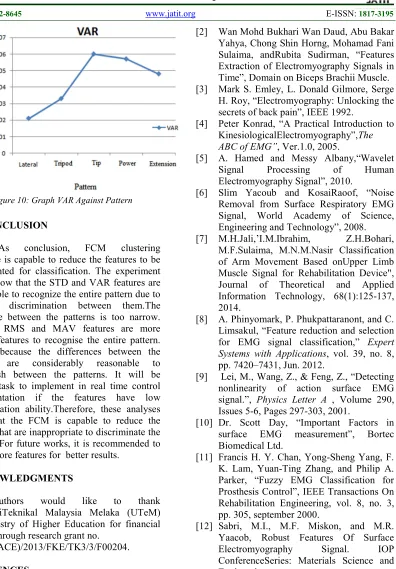
Figure 10 show that VAR feature has difference range between pattern for tip and power that is less than 0.0005. For the pattern tip the value is around 0.006 while for the pattern power, the value is 0.0057. Thus, this feature is very difficult to use to classify the range of the pattern. Hence, the most suitable features that can be utilized to classify all the patterns are RMS and MAV. Whereas the STD and VAR are not suitable features for this pattern recognition experiment.
Figure 6: Scatter Plot Of FCM Clustering
Figure 7: Graph RMS Against Pattern
[image:5.612.124.524.47.606.2]Figure 8: Graph MAV Against Pattern
Figure 10: Graph VAR Against Pattern
4. CONCLUSION
As conclusion, FCM clustering
technique is capable to reduce the features to be implemented for classification. The experiment results show that the STD and VAR features are not suitable to recognize the entire pattern due to lack of discrimination between them.The difference between the patterns is too narrow. Whereas RMS and MAV features are more suitable features to recognise the entire pattern. This is because the differences between the
patterns are considerably reasonable to
distinguish between the patterns. It will be difficult task to implement in real time control implementation if the features have low discrimination ability.Therefore, these analyses prove that the FCM is capable to reduce the features that are inappropriate to discriminate the pattern. For future works, it is recommended to extract more features for better results.
ACKNOWLEDGMENTS
The authors would like to thank
UniversitiTeknikal Malaysia Melaka (UTeM) and Ministry of Higher Education for financial support through research grant no.
FRGS(RACE)/2013/FKE/TK3/3/F00204.
REFERENCES
[1] M. B. I. Reaz, M. S. Hussain and F.
Mohd-Yasin, “Detection, processing,
classification andapplications”, Techniques of EMG signal analysis.
[2] Wan Mohd Bukhari Wan Daud, Abu Bakar Yahya, Chong Shin Horng, Mohamad Fani Sulaima, andRubita Sudirman, “Features Extraction of Electromyography Signals in Time”, Domain on Biceps Brachii Muscle. [3] Mark S. Emley, L. Donald Gilmore, Serge
H. Roy, “Electromyography: Unlocking the secrets of back pain”, IEEE 1992.
[4] Peter Konrad, “A Practical Introduction to
KinesiologicalElectromyography”,The
ABC of EMG”, Ver.1.0, 2005.
[5] A. Hamed and Messy Albany,“Wavelet
Signal Processing of Human
Electromyography Signal”, 2010.
[6] Slim Yacoub and KosaiRaoof, “Noise Removal from Surface Respiratory EMG Signal, World Academy of Science, Engineering and Technology”, 2008.
[7] M.H.Jali,’I.M.Ibrahim, Z.H.Bohari,
M.F.Sulaima, M.N.M.Nasir Classification of Arm Movement Based onUpper Limb Muscle Signal for Rehabilitation Device", Journal of Theoretical and Applied Information Technology, 68(1):125-137, 2014.
[8] A. Phinyomark, P. Phukpattaranont, and C. Limsakul, “Feature reduction and selection
for EMG signal classification,” Expert
Systems with Applications, vol. 39, no. 8,
pp. 7420–7431, Jun. 2012.
[9] Lei, M., Wang, Z., & Feng, Z., “Detecting nonlinearity of action surface EMG
signal.”, Physics Letter A , Volume 290,
Issues 5-6, Pages 297-303, 2001.
[10] Dr. Scott Day, “Important Factors in
surface EMG measurement”, Bortec
Biomedical Ltd.
[11] Francis H. Y. Chan, Yong-Sheng Yang, F. K. Lam, Yuan-Ting Zhang, and Philip A. Parker, “Fuzzy EMG Classification for Prosthesis Control”, IEEE Transactions On Rehabilitation Engineering, vol. 8, no. 3, pp. 305, september 2000.
[12] Sabri, M.I., M.F. Miskon, and M.R. Yaacob, Robust Features Of Surface
Electromyography Signal. IOP
ConferenceSeries: Materials Science and Engineering,
[13] M.H. Jali, M.F. Sulaima, T.A. Izzuddin,
W.M. Bukhari, M.F. Baharom,
“Comparative Study of EMG based Joint Torque Estimation ANN Models for Arm
Rehabilitation Device”, International
Journal of Applied Engineering Research, Vol 9 (10), pp. 1289 - 1301, 2014